Weather Events
Figure 1: The most frequent weather events occurring during the four evolution stages of a Shapiro-Keyser cyclone.
| Parameter | Description |
|---|---|
| Precipication | Most intense precipitation occurs during the intensification and the mature stage. The highest precipitation rates occur in the area of the rising warm conveyor belt (e.g., warm front). At advanced stages and with the splitting of the warm conveyor belt into two branches, higher precipitation rates occur inside the occlusion-like cloud band. |
| Temperature | Warm air masses occur in the warm sector and within the system core (i.e., surface pressure minimum). A temperature drop occurs after the passage of the cold front. |
| Wind (incl. gusts) | High wind speeds occur, related to the passage of the cold front and gusty winds behind the cold front. The highest wind speeds occur at the southern tip of the occlusion-like cloud band (e.g., Sting Jet). |
| Other relevant information | Turbulence may occur at jet-level near the tropopause fold. There is a risk of freezing rain below the warm front in winter. Thunderstorms embedded in the cold front may also be encountered in winter. |
Weather events for the early stages of the Shapiro Keyser cyclone are described in detail in the chapter related tI uso the conceptual model "Wave" which reflects the early stage of a Shapiro-Keyser cyclone. We therefore start with the intensification stage, followed by the mature and dissipation stages. A Shapiro-Keyser cyclone development that lasted from 30 November at 18:00 UTC to 02 December 2021 at 00:00 UTC is used as a case-study for illustration.
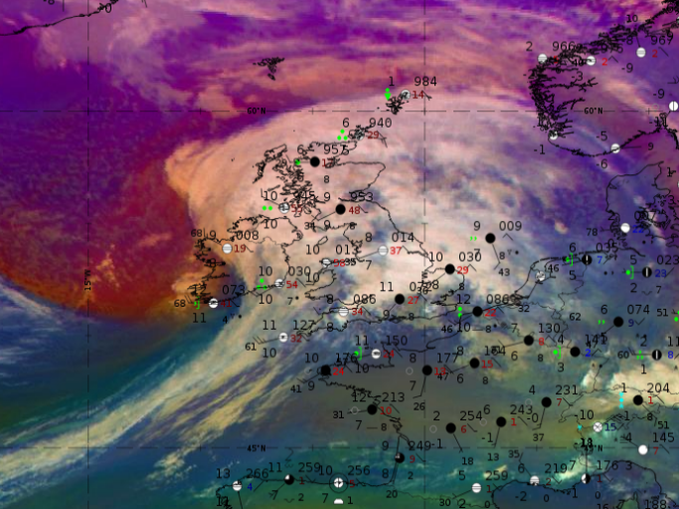
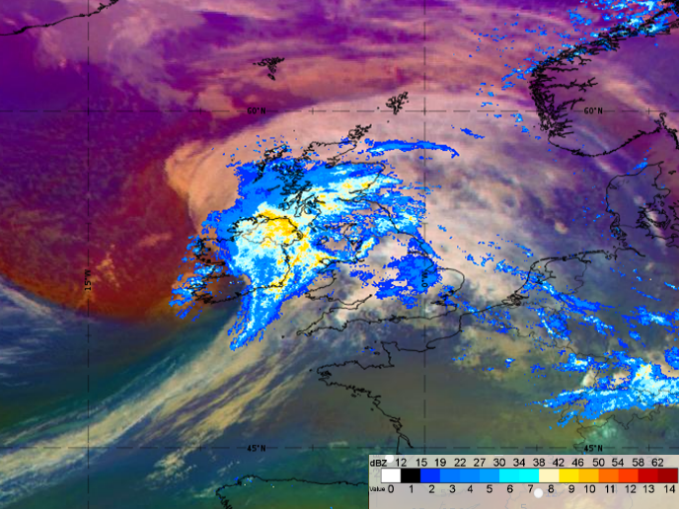
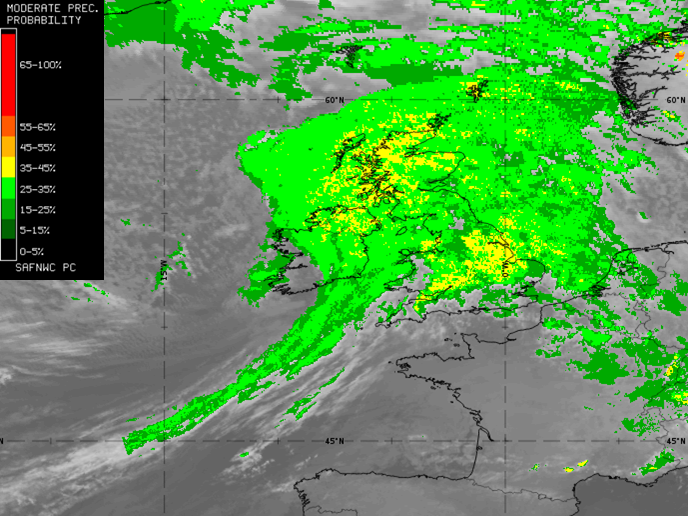
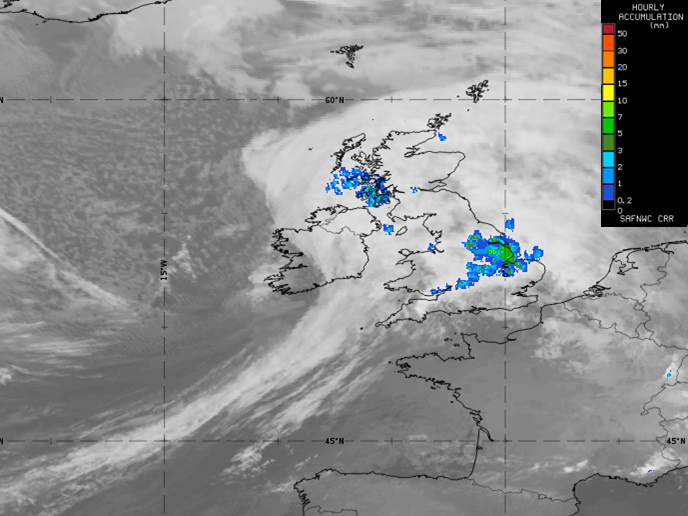
The intensification stage (30 November 2021 at 18:00 UTC):
Most intense precipitation is found at the western part of the warm front (Ireland and Scotland). This area is collocated with the right entrance region of a jet streak.
|
|
Figure 2: Airmass RGB with Synop data and with superimposed Radar reflectivity (move the slider to compare the two images).
The NWC SAF satellite products Precipitating Clouds (PC) and Convective Rainfall Rate (CRR) show highest probabilities for rain and highest hourly rainfall rates within the warm front and the warm sector.
|
|
Figure 3: : NWC SAF products Precipitating Clouds and Convective Rainfall Rate (move the slider to compare the two images).
The mature stage (1 December 2021 at 12:00 UTC):
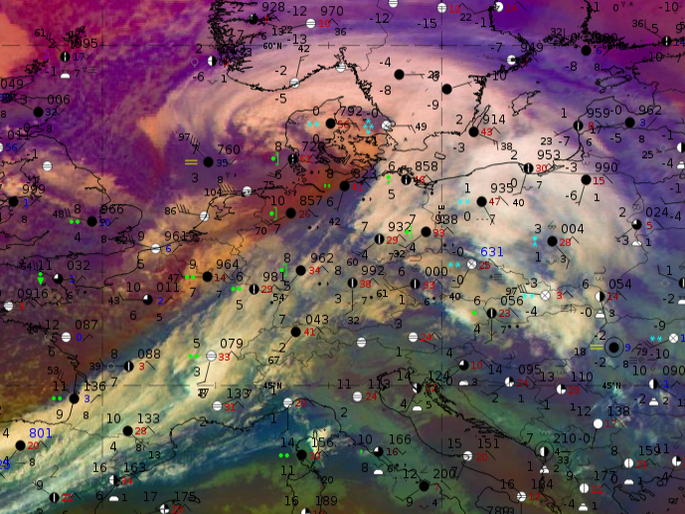
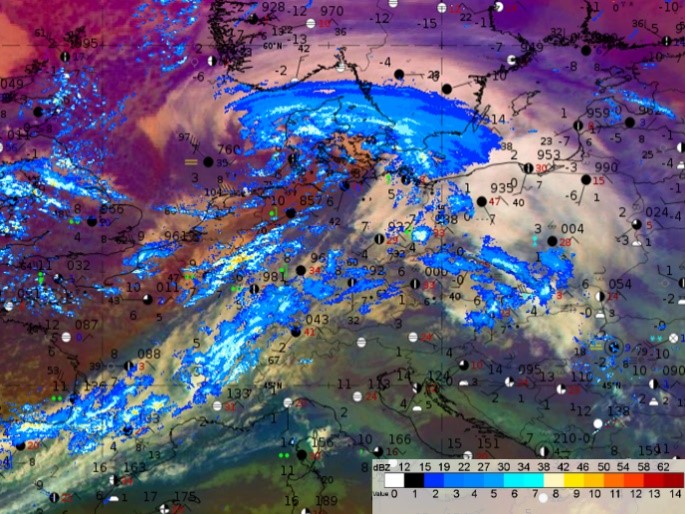
Intense showers partly occur along the cold front where the cloud structure is more inhomogeneous. A more continuous type of rain in the warm front parts of the system characterizes the precipitation that occurs during the mature stage of a Shapiro-Keyser cyclone.
|
|
Figure 4: : Airmass RGB with Synop data and with superimposed Radar reflectivity (move the slider to compare the two images).
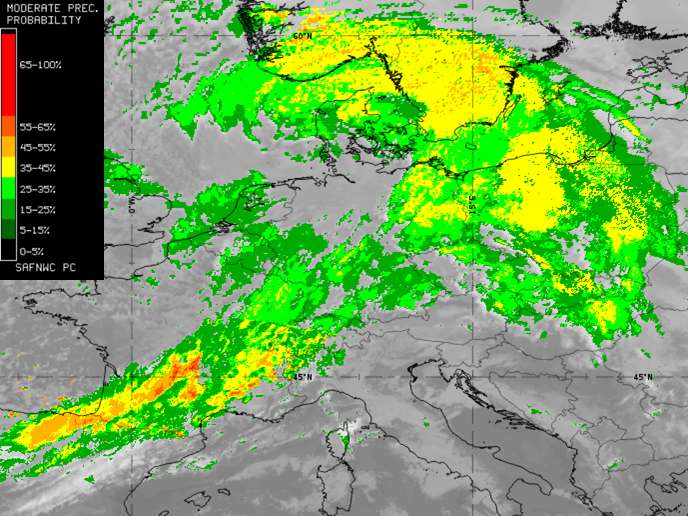
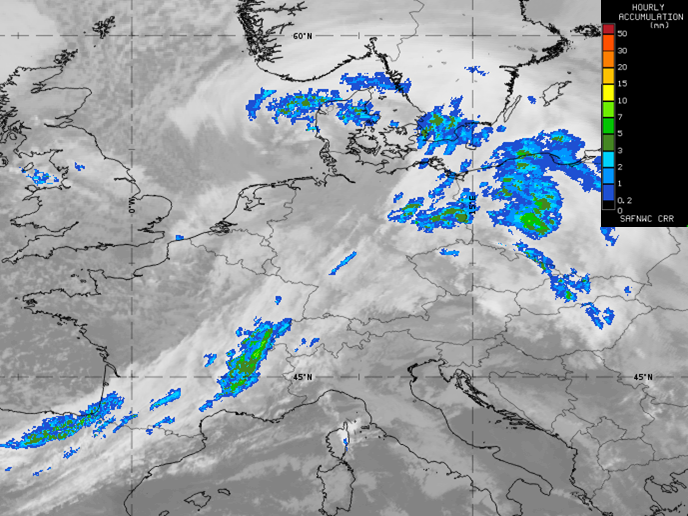
Both NWC SAF precipitation products show widespread rainfall in the warm front areas of the Shapiro-Keyser system. Locally, precipitation can be more intense within the cold front
|
|
Figure 5: : NWC SAF products Precipitating Clouds and Convective Rainfall Rate (move the slider to compare the two images)
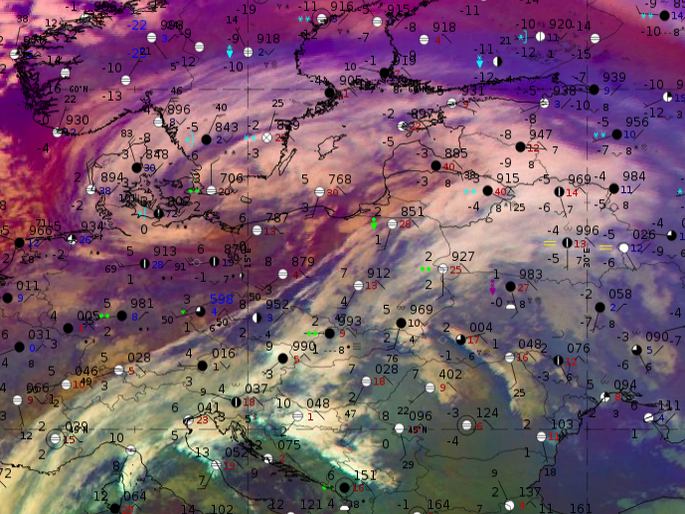
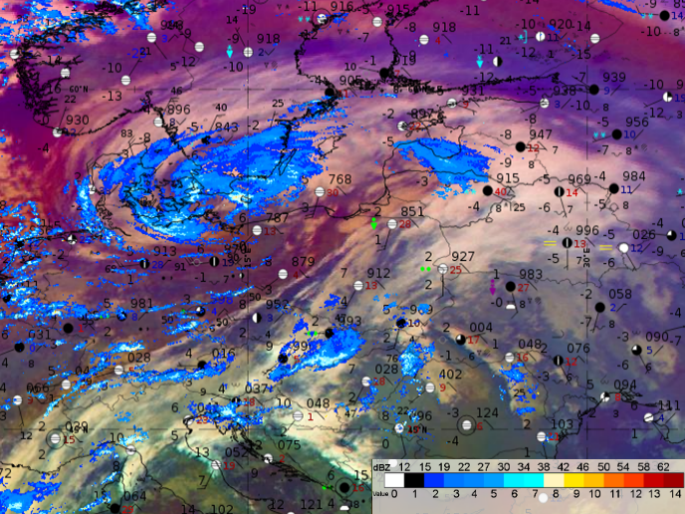
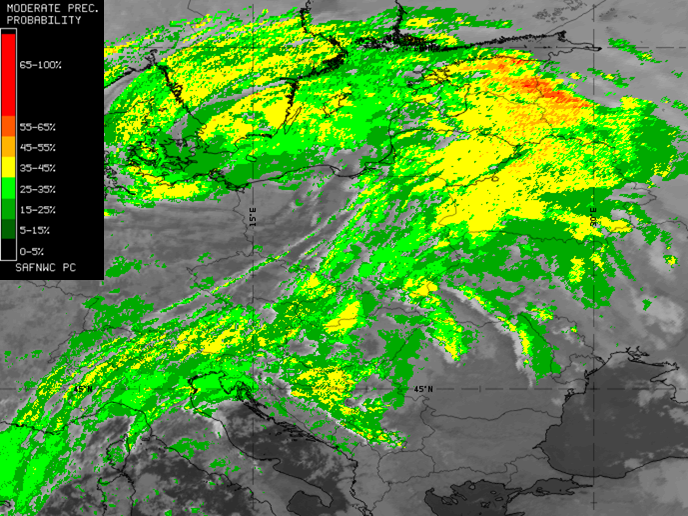
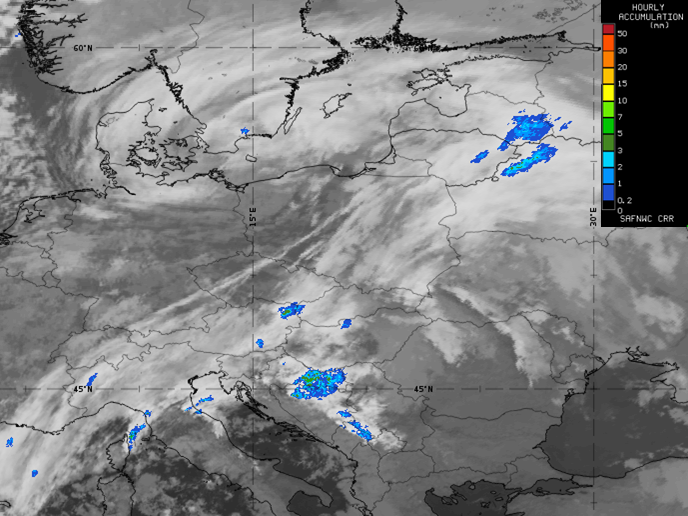
The dissipation stage (2 December 2021 at 00:00 UTC):
At the end of the cyclones life cycle, most precipitation occurs within the system core and the warm front. Showers may still occur in the cold front section of the system.
|
|
Figure 6: : Airmass RGB with Synop data and with superimposed Radar reflectivity (move the slider to compare the two images).
While the PC product shows higher precipitation probabilities at the warm front of the decaying system, the CRR product hardly shows any precipitation spots.
|
|
Figure 7: NWC SAF products Precipitating Clouds and Convective Rainfall Rate (move the slider to compare the two images).

