Cloud Structure In Satellite Images
Shapiro-Keyser cyclones are most frequently observed over the oceans. The life cycle of a Shapiro-Keyser cyclone substantially differs from the that of a Norwegian-type cyclone. This difference is less obvious when looking at satellite imagery, but it becomes more apparent when looking at the NWP parameters that naturally reflect the ongoing physical processes. These differences are most pronounced during the intensification and the mature stages.
Shapiro-Keyser cyclones often show a rapid development and a strong deepening of the surface low, for which reason they often fulfil the criterion of Rapid Cyclogenesis. When the deepening of the surface low within 24 hours exceeds a given threshold, they are classified as Rapid Cyclogenesis. This threshold depends on the geographical position of the system; the classification criterion is as follows:
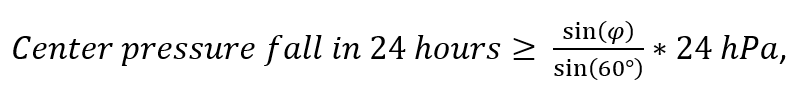
where φ is the geographical latitude of the system.
As for the Norwegian cyclone, we define five development stages in the life-cycle of a Shapiro-Keyser cyclone:
- Initial stage
- Wave stage
- Intensification stage
- Mature stage
- Dissipation stage
However, in this manual the starting point is the satellite images, and as the air mass boundary in the initial stage (1) is often cloud-free or accompanied by randomly arranged cloud patches without any typical structure, it will not be treated in this and the following chapters. Schematics and cases representing the process of cyclogenesis will therefore start with the wave stage (2), where cloud systems already show a more organized structure and can be properly identified in satellite imagery.
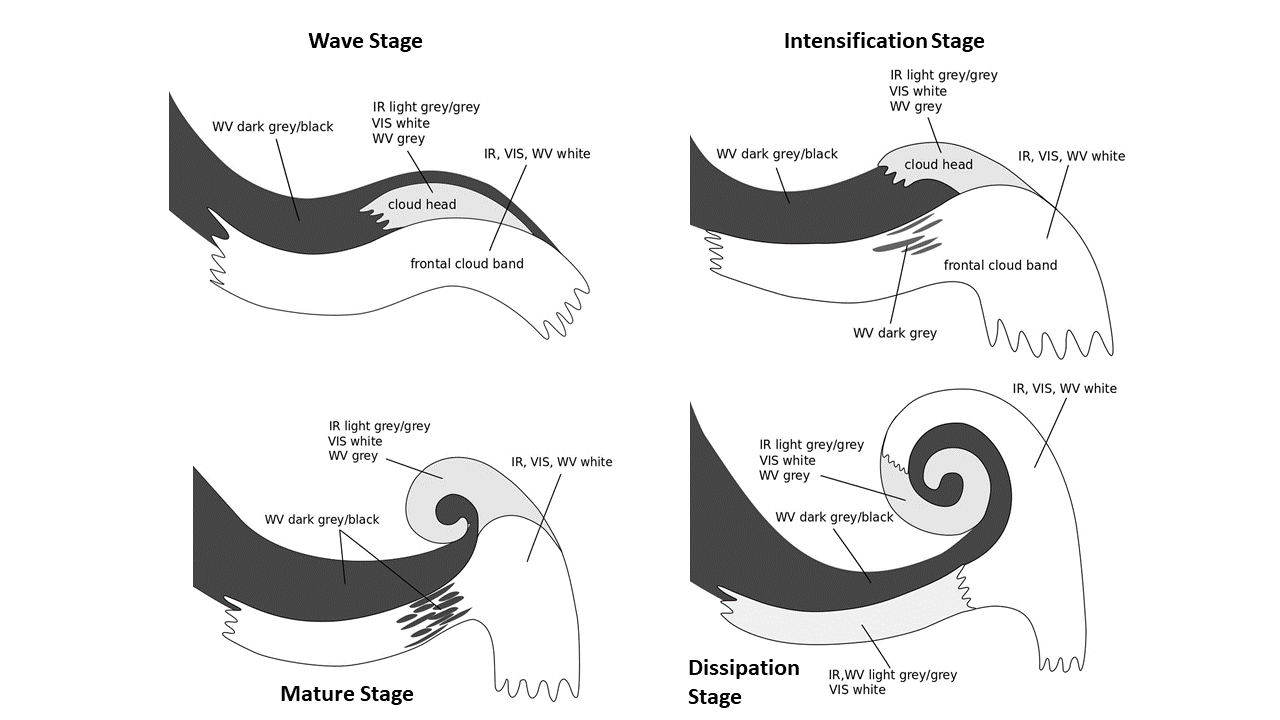
Figure 1: Schematics of the development stages of a Shapiro-Keyser cyclone as depicted in the SEVIRI channels IR 10.8 μm, WV 6.2 μm and HR-VIS.
Appearance in SEVIRI channels IR 10.8 μm, WV 6.2 μm and HR-VIS:
Wave stage:
When the frontal zone starts to form a wave, the frontal cloud band is organized into regions with cyclonic and anticyclonic curvature, which correspond physically to a cold and a warm front, respectively. In this very early stage of the cyclone development, a cloud head emerges at the rear of the transition zone from cold to warm front. This cloud head can be clearly distinguished in IR imagery from the main cloud band because of its lower cloud tops.

Figure 2: Schematics of the wave stage of a Shapiro-Keyser cyclone as depicted in the SEVIRI channels IR 10.8 μm, WV 6.2 μm and HR-VIS.
IR 10.8 μm channel:
- Two main cloud configurations are seen during the wave stage of cyclogenesis: (1) a frontal cloud band usually oriented east to west, and (2) a so-called "cloud head", on the poleward side of the frontal cloud band, protruding from beneath it. The shades of the developing cloud head varies between grey and light grey in the IR channels, mostly with higher tops on the poleward side.
- Dry air originating from higher atmospheric levels descends on the cyclonic side of a jet stream at the rear of the frontal cloud band. This leads to a dark, cloud-free area between the cloud band of the cold front and the cloud head, thereby creating a V-pattern (often also called a dry slot).
WV 6.2 μm channel:
- A dark stripe usually accompanies the formation of a Shapiro-Keyser cyclone. In WV imagery, this dark stripe is located at the rear of the "cold frontal" cloud band in the wave stage.
- The dark stripe occurs at the cyclonic side of the jet stream. Before the development starts, the dark stripe is more distinct upstream of the cloud head.
VIS channel:
- Visible imagery is not well suited to a frontal analysis. Nevertheless, the development of the Shapiro-Keyser system can be monitored from the early wave stage until the final dissipation stage using VIS imagery. The frontal cloud band and the cloud head appear in light grey shades, while the cloud-free areas, especially the dry slot that forms when the cloud head separates from the frontal cloud band, appear darker grey.
Intensification stage:
During the intensification stage of the Shapiro-Keyser cyclone, the curvature of the frontal cloud band accentuates. The cloud head grows larger and starts to separate from the front, with a cloud-free gap opening between the cold front and the rear part of the cloud head. The height difference between the frontal cloud band and cloud head persists.

Figure 3: Schematic of the intensification stage of a Shapiro-Keyser cyclone as depicted in the SEVIRI channels IR 10.8 μm, WV 6.2 μm and HR-VIS.
IR 10.8 μm channel:
- The frontal cloud band consists of high-reaching clouds and appears in white scales in the IR imagery while the cloud head appears in grey scales typical for mid-level cloud heights.
WV 6.2 μm channel:
- When the cloud head detaches from the frontal cloud band during the intensification stage, the dark stripe fills the gap (V-pattern).
VIS channel:
- As the frontal cloud band consists of higher clouds than those of the cloud head, the frontal clouds can cast a distinct shadow on the cloud head, this is visible in VIS imagery.
Mature stage:
During the mature stage of the Shapiro-Keyser cyclone the cloud head transforms into an occlusion-like cloud band that wraps around the low-pressure core of the Shapiro-Keyser cyclone. At the same time, it intensifies and reaches higher atmospheric levels.
The angle between the cold and warm front narrows and reaches about 90° so that they become perpendicular. This pattern, characteristic for this cyclone type, is called a T-bone pattern.
In the mature stage, the warm front is far more clearly visible than the cold front. The cold front often has a patchy structure, and sometimes only consists of high clouds (e.g., an upper-level cold front) with reduced vertical extent.
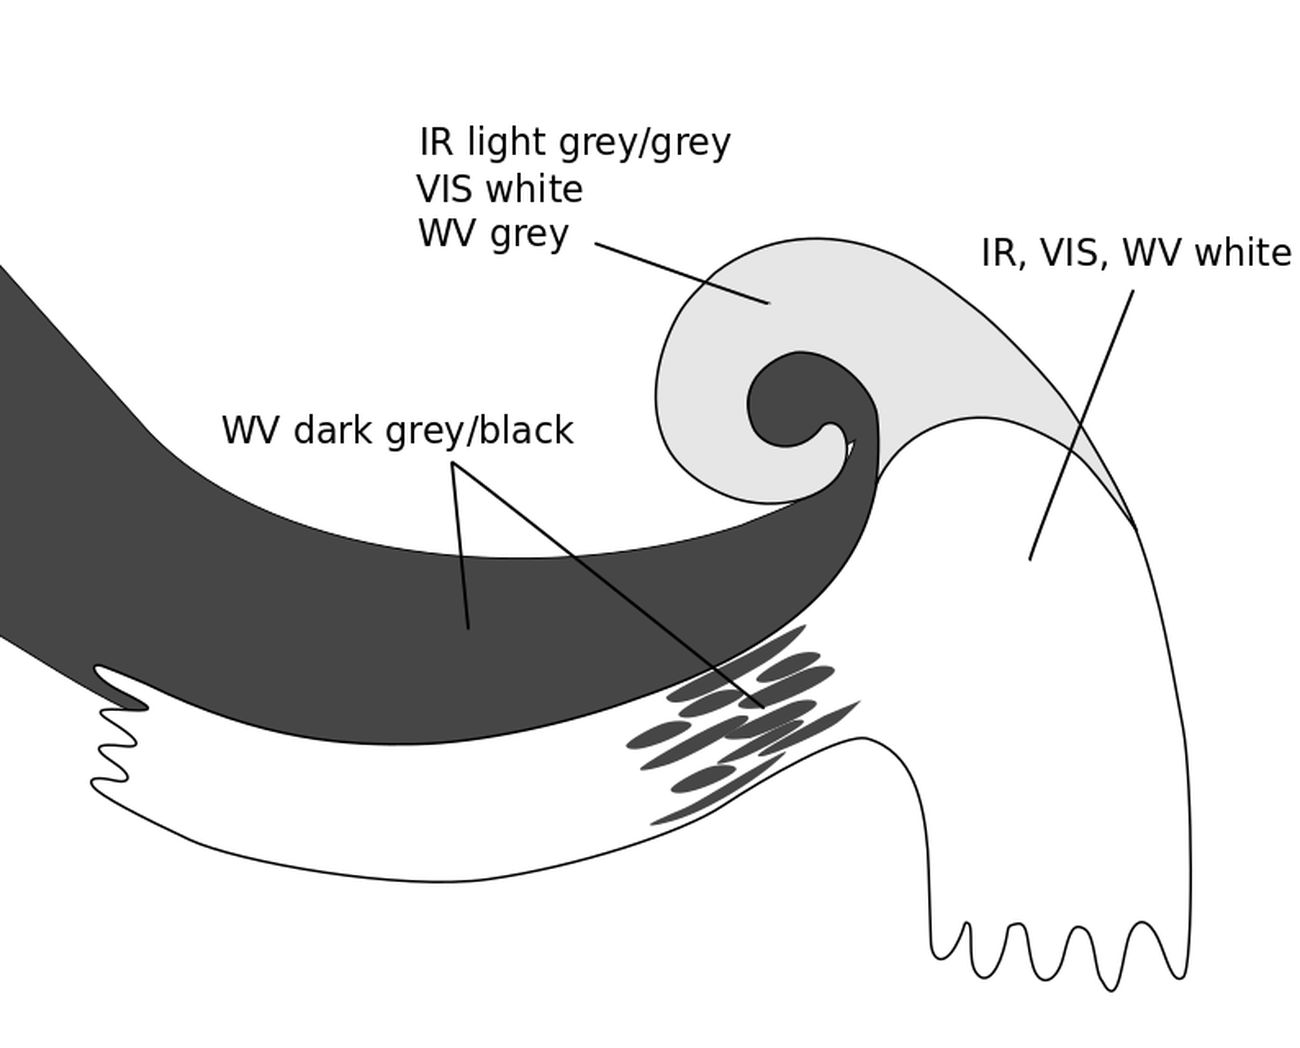
Figure 4: Schematics of the mature stage of a Shapiro-Keyser cyclone as depicted in the SEVIRI channels IR 10.8 μm, WV 6.2 μm and HR-VIS.
IR 10.8 μm channel:
- With the deepening of the surface low in the mature phase, the cloud head detaches from the frontal cloud band and becomes more spiral like in structure. At the same time as the cloud band wraps around the system core, its appearance becomes whiter in the IR imagery.
WV 6.2 μm channel:
- During the mature stage, the cloud head grows into a cyclonically curved cloud spiral with a broad dark area between the spiral and the frontal cloud band. Compared to the intensification stage, the dark stripe becomes greyer and the contrast reduces.
- Another dark stripe that is connected to a second jet streak can be observed ahead of the warm front.
VIS channel:
- The frontal cloud bands are depicted in bright grey shades and the cold front has a less compact structure than the warm front.
Dissipation stage:
During the dissipation stage, the Shapiro-Keyser cyclone strongly resembles the Norwegian cyclone type from the satellite perspective. The former cloud head, now very similar to a classical occlusion cloud band, wraps around the system core and dissipates slowly.

Figure 5: Schematic of the dissipation stage of a Shapiro-Keyser cyclone as depicted in the SEVIRI channels IR 10.8 μm, WV 6.2 μm and HR-VIS.
IR 10.8 μm channel:
- While the warm front is more persistent in IR imagery, the cold front and the occlusion-like cloud band dissolve first. Parts of the cloud spiral disappear as the temperature contrast between the warm core and the surrounding air reduces to zero.
WV 6.2 μm channel:
- The contrast between the dark stripe and the surrounding air reduces.
VIS channel:
- The dissipation process is also visible in VIS imagery as the cloud structure becomes patchier and less compact.
Appearance in Airmass RGB:
The composite image that best represents the Shapiro-Keyser cyclogenesis prcess is the Airmass RGB.
- Reddish brown colours are found in the cold air behind the cold front. They represent dry, sinking air masses, which typically occur in a dry intrusion. They are often co-located with the jet stream.
- Frontal cloud bands are depicted in white unless they are overrun by the dry intrusion. In that case, they have a reddish white colour.
- Cold air masses are typically represented in blue tones, while warmer, tropical air masses are depicted in green.
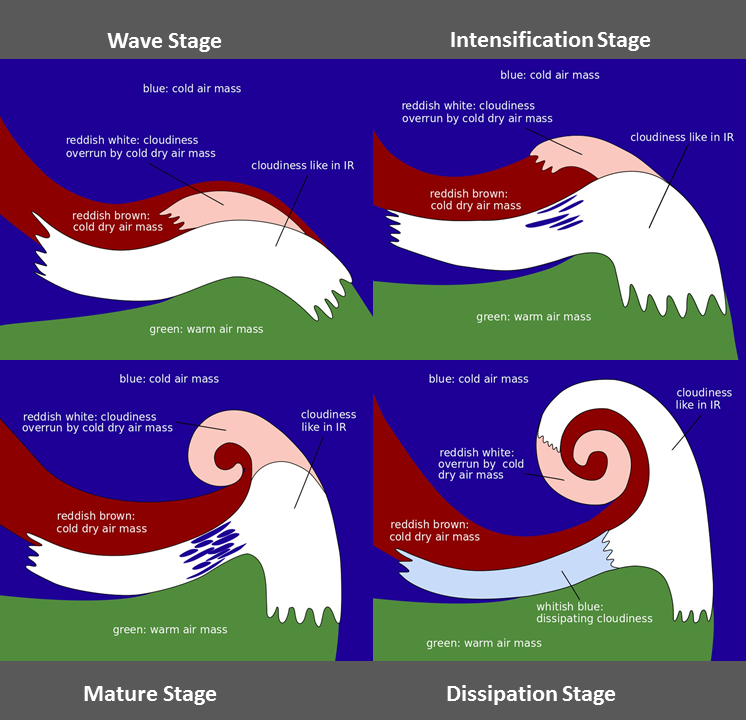
Figure 6: Schematics of the development stages of a Shapiro-Keyser cyclone as depicted in the Airmass RGB.
During the period of 2 to 4 March 2022, a Shapiro-Keyser cyclone developed over the Atlantic Ocean.
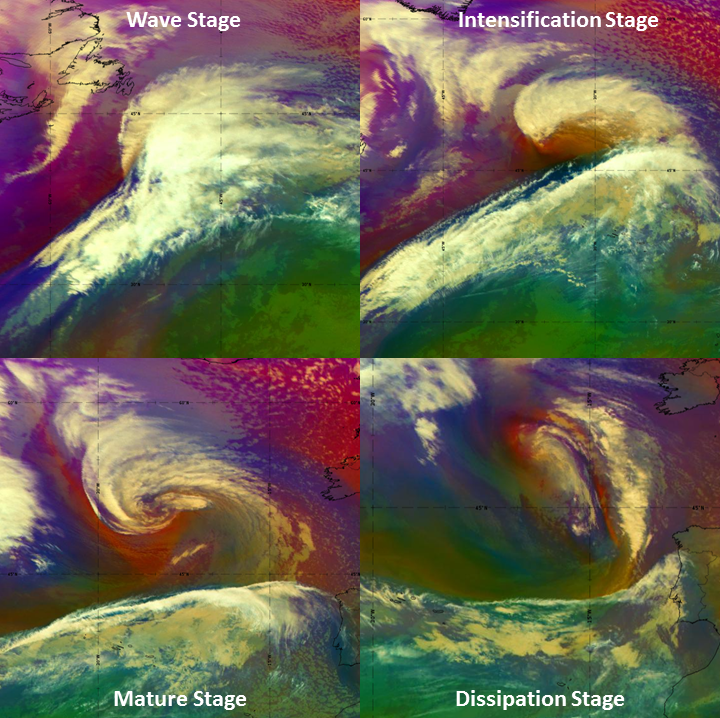
Figure 7: 2 - 4 March 2022, Airmass RGB.
Wave stage: 2 March 2022 at 21:00 UTC - intensification stage: 3 March 2022 at 18:00 UTC;
mature stage: 4 March 2022 at 09:00 UTC; dissipation stage: 4 March 2022 at 21:00 UTC.
The IR 10.8 μm band shows the development of an occlusion-like cloud band (in fact a warm front) around the warm core of the Shapiro-Keyser-system. Cloud fibres can be seen at the rear side of the cold front, indicating the position of the jet.
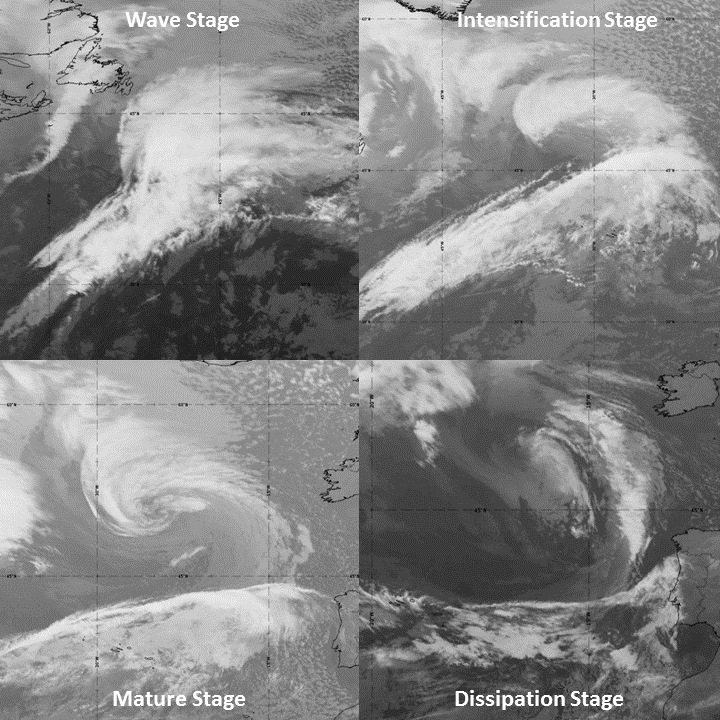
Figure 8: 2 - 4 March 2022, IR 10.8 μm.
Wave stage: 2 March 2022 at 21:00 UTC - intensification stage: 3 March 2022 at 18:00 UTC;
mature stage: 4 March 2022 at 09:00 UTC; dissipation stage: 4 March 2022 at 21:00 UTC.
The water vapour band WV 6.2 μm shows dry sinking air masses (dark areas) behind the cold front and wrapping around the warm core of the Shapiro-Keyser system. During the intensification stage, the dry intrusion is strongest in the cloud-free gap opening between the cold front and the cloud head.
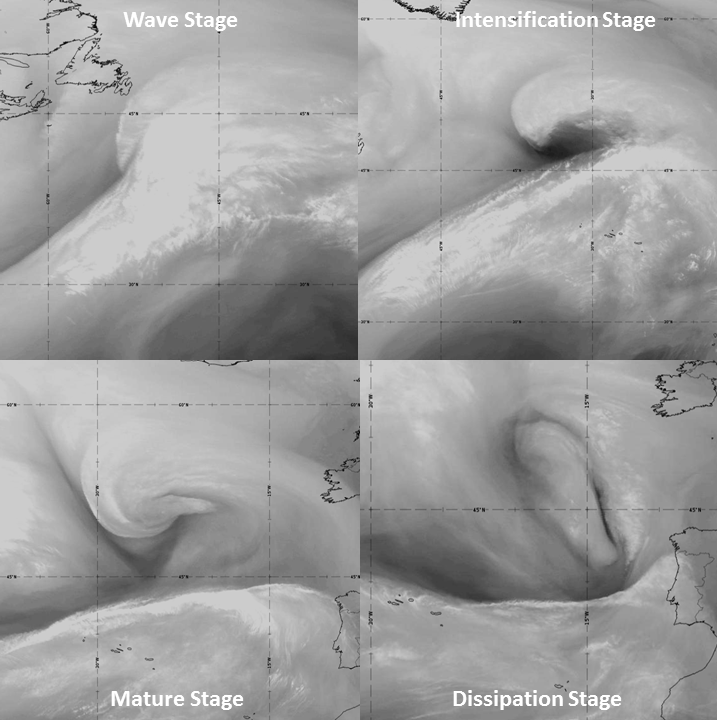
Figure 9: 2 - 4 March 2022, WV 6.2 μm.
Wave stage: 2 March 2022 at 21:00 UTC; intensification stage: 3 March 2022 at 18:00 UTC;
mature stage: 4 March 2022 at 09:00 UTC; dissipation stage: 4 March 2022 at 21:00 UTC.
Bright pixel values show the positions of the fronts in visible imagery. At low solar altitudes, the shadows cast on the cloud tops provide a kind of 3-D effect.
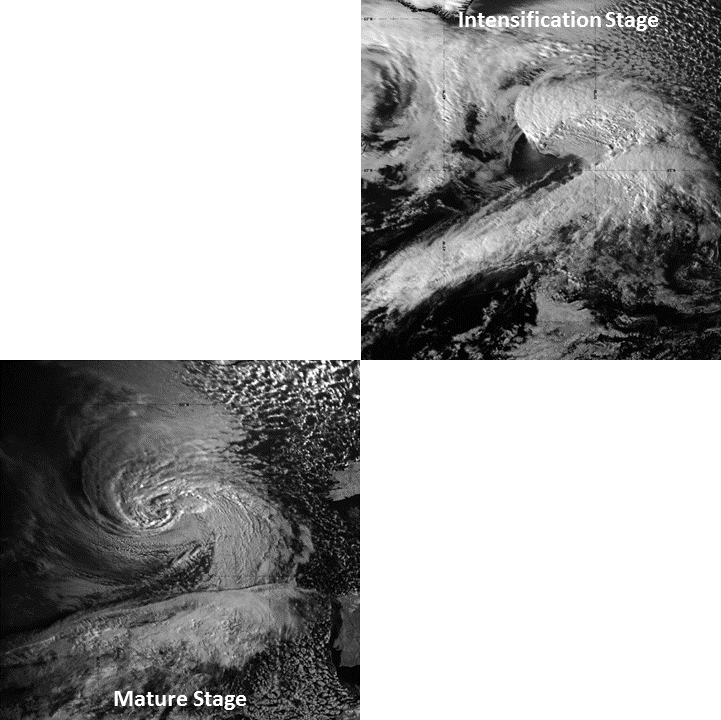
Figure 10:2 - 4 March 2022, VIS 0.8 μm.
Intensification stage: 3 March 2022 at 18:00 UTC; mature stage: 4 March 2022 at 09:00 UTC.