Typical Appearance In Vertical Cross Sections
From the wave stage on, the vertical structure of Shapiro-Keyser cyclones differs fundamentally from the Norwegian cyclone type. This can be seen in vertical cross sections through the fronts of the Shapiro-Keyser cyclone using NWP model data. As in the previous chapters, we focus on the phases where the warm air intrusion forms, i.e. the intensification stage until the final stage of the life cycle: the dissipation stage.
The model parameters that best characterize the evolution of the Shapiro-Keyser cyclone in vertical cross sections (VCS) are:
- temperature
- temperature advection and
- humidity
The Shapiro-Keyser cyclone development case study used here to demonstrate typical vertical cross-sections (using ECMWF model data) is from 3 March 2022 at 15:00 UTC for the intensification stage, 4 March 2022 at 12:00 UTC for the mature stage and 4 March 2022 at 21:00 UTC for the dissipation stage.
The intensification stage
During the intensification stage, warm air from the warm sector of the system invades the area of the surface low at low to middle levels of the troposphere. The protruding warm air masses are separated from the polar air by a baroclinic zone that gradually adopts the characteristics of a warm front. At the same time, the upper-level cold front remains aligned to the lower-level cold front.
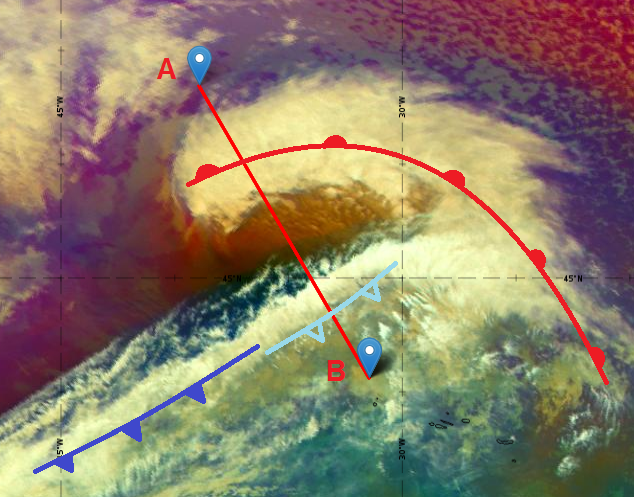

Figure 1:
Left: Airmass RGB from 3 March 2022 at 15:00 UTC with fronts and the position of the vertical cross section.
Right: Schematic of the intensification stage of the Shapiro-Keyser cyclone with fronts and the position of the vertical cross section.
At the intensification stage, the warm front (red line) is very distinctive in the VCS. The warm core and the warm sector consist of a uniform air mass; there is no temperature or humidity gradient below 700 hPa. Nevertheless, at higher levels, an upper-level cold front (light blue line) that corresponds to a weak temperature gradient and a stronger humidity gradient (Figure 4) is clearly seen.

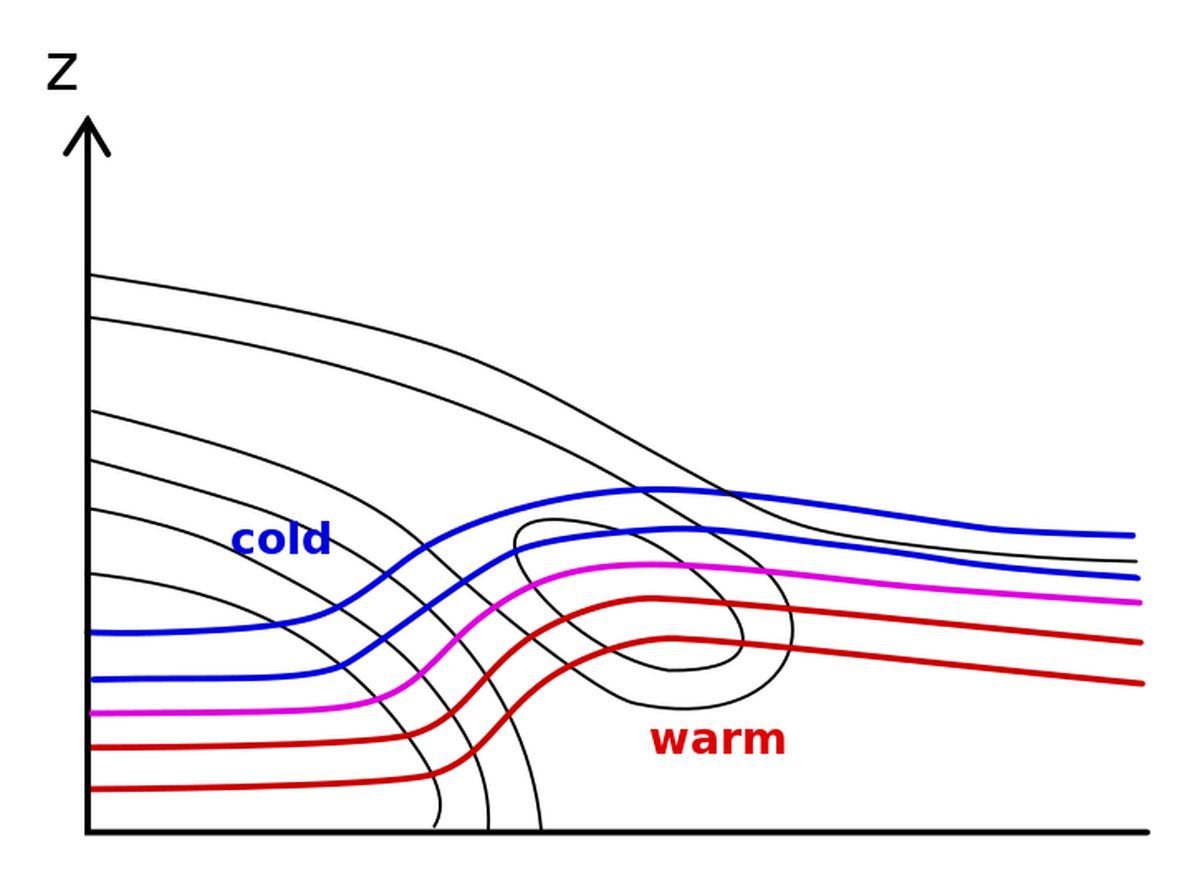
Figure 2:
Left: Vertical cross section showing the equivalent potential temperature (black lines) and the temperature from ECMWF model data (dotted red and blue lines).
Right: Schematic of the vertical cross section.
The VCS shows pronounced warm air advection within the warm front and moderate cold air advection within the upper-level cold front. This confirms that the latter is mainly characterized by a humidity rather than by a temperature gradient.
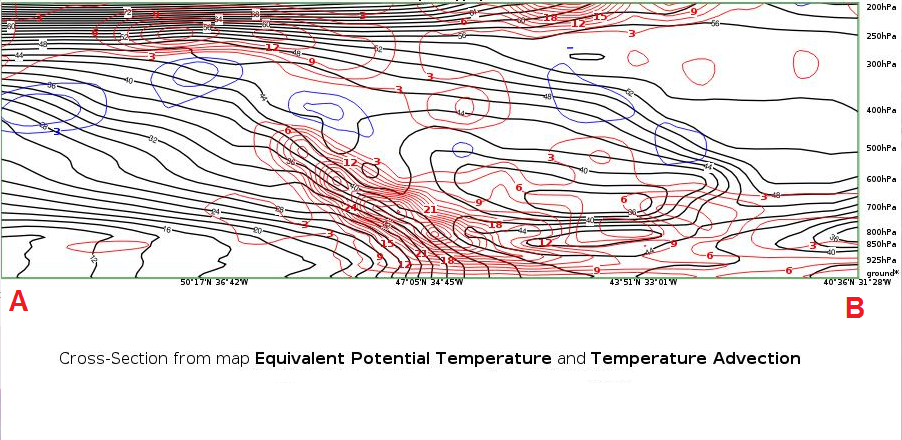
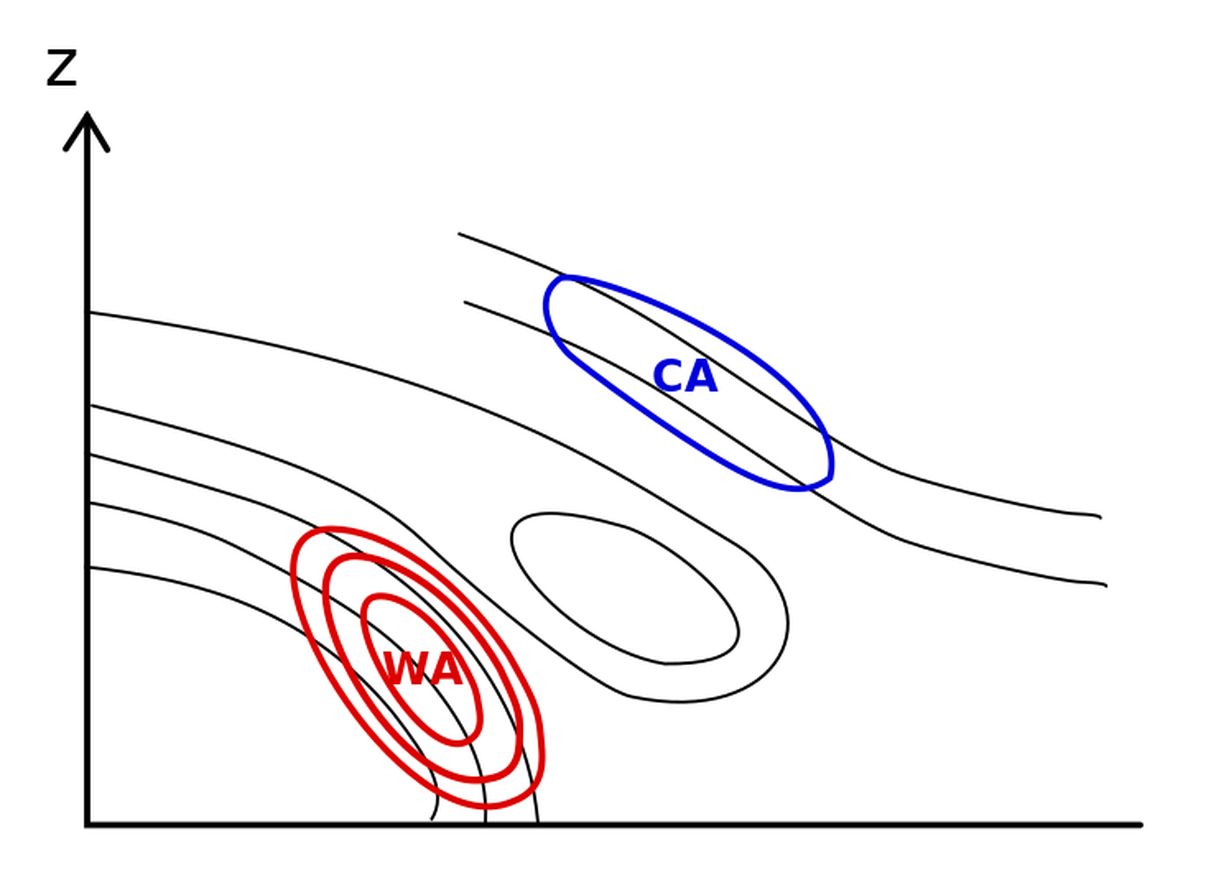
Figure 3:
Left:Vertical cross section showing the equivalent potential temperature (black lines) and the temperature advection (red and blue lines) from ECMWF model data.
Right: Schematic of the vertical cross section.
The dry intrusion between the warm front and the upper-level cold front is clearly visible in the VCS. During the intensification stage, the dry intrusion affects the mid- and upper troposphere only.
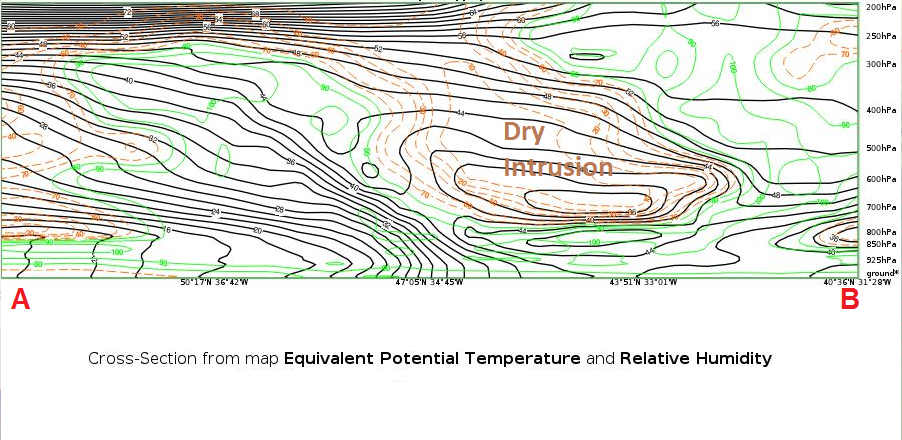
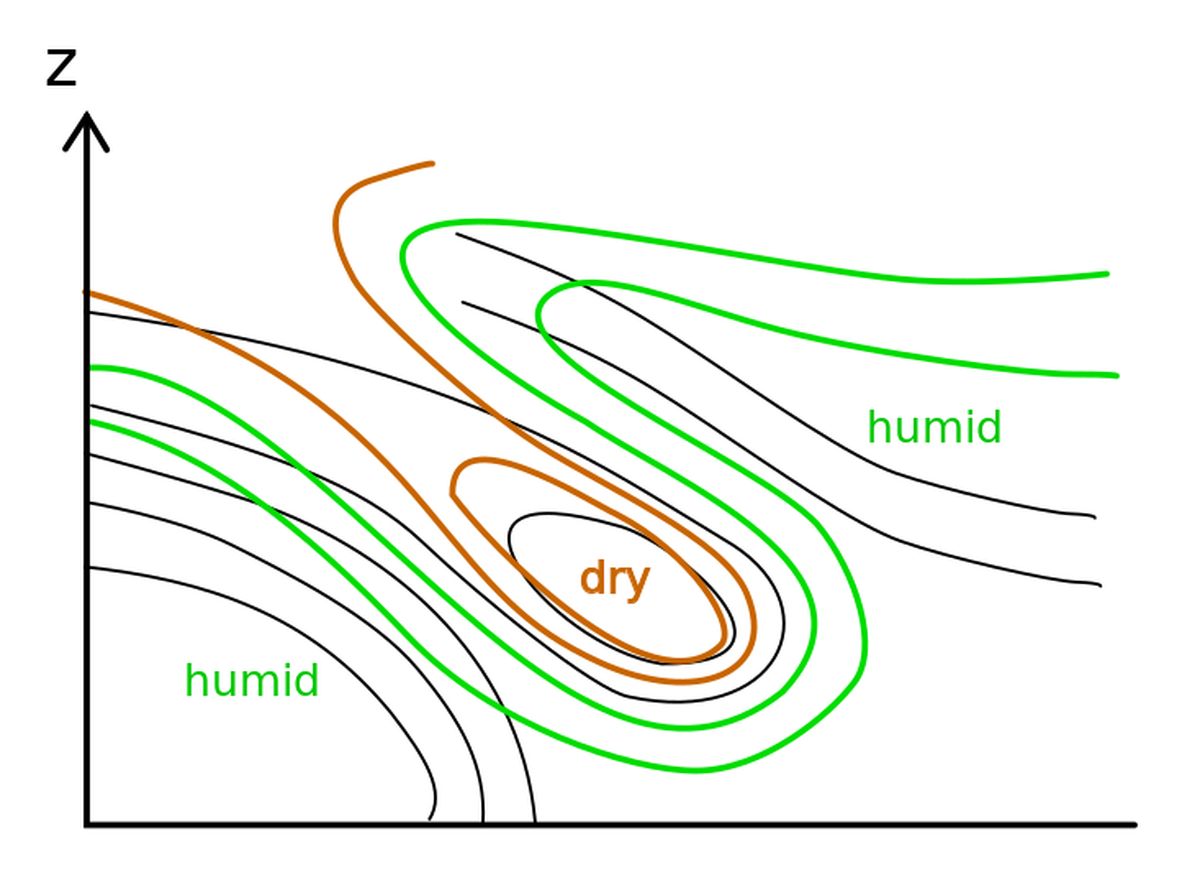
Figure 4:
Left:Vertical cross section showing the equivalent potential temperature (black lines) and relative humidity (green and brown lines) from ECMWF model data.
Right: Schematic of the vertical cross section.
The mature stage
During the mature stage, the warm core of the Shapiro-Keyser system becomes secluded from the warm sector. A VCS through the warm core and the cold front of the Shapiro-Keyser system shows a complex pattern of successive fronts depending on how far the seclusion has progressed.
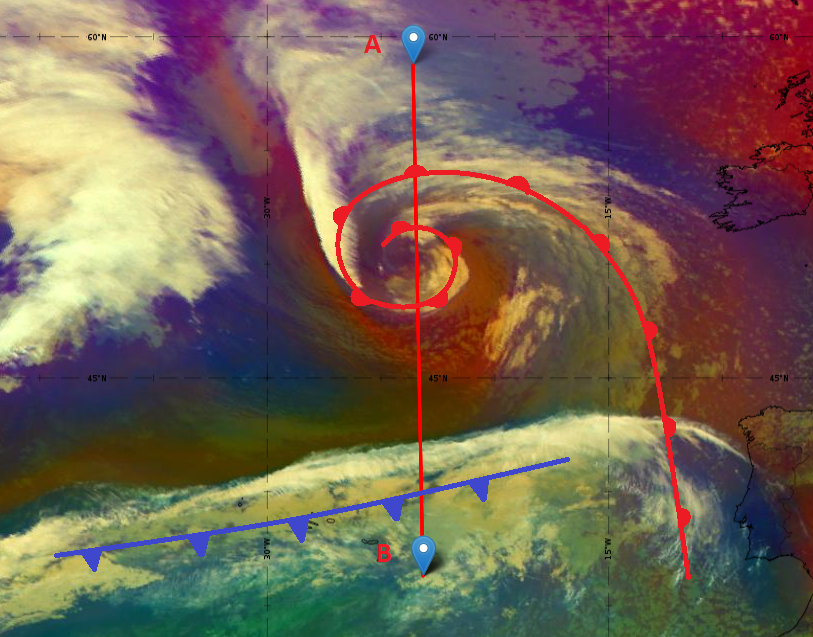

Figure 5:
Left: Airmass RGB from 4 March 2022 at 12:00 UTC with fronts and the position of the vertical cross section.
Right: Schematic of the mature stage of the Shapiro-Keyser cyclone with surface fronts and the position of the vertical cross section.
The number of warm fronts (red lines in Figure 6) depicted in the VCS depends on how far warm air seclusion has progressed. During the seclusion process, cold air wraps around the warm core that is very distinct in the vertical temperature chart. At this stage, the upper-level cold front has transformed into a surface front (blue line), which is characterized by a strong humidity gradient rather than by a temperature gradient.

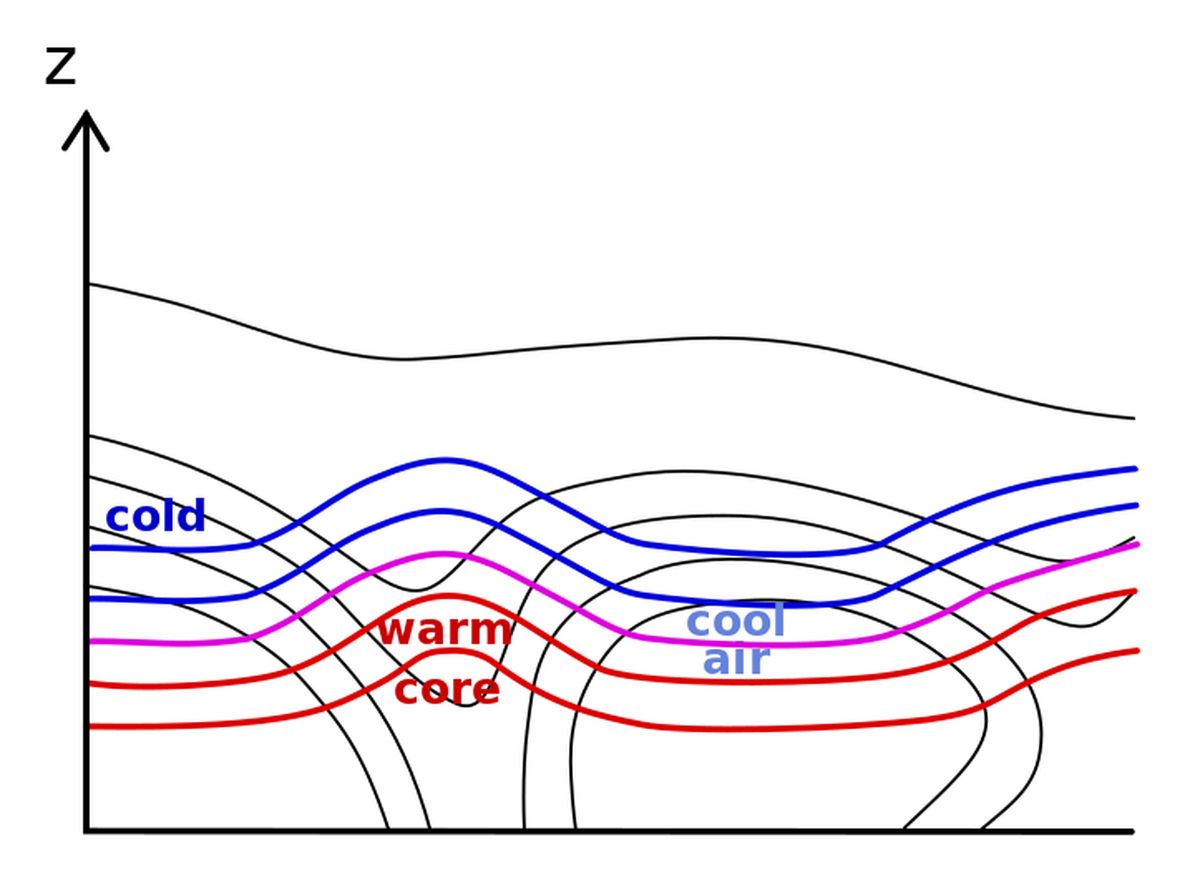
Figure 6:
Left: Vertical cross section showing the equivalent potential temperature (black lines) and the temperature from ECMWF model data (dotted red and blue lines).
Right: Schematic of the vertical cross section.
The warm fronts located around the warm core are characterized by warm air advection and the cold front by cold air advection.

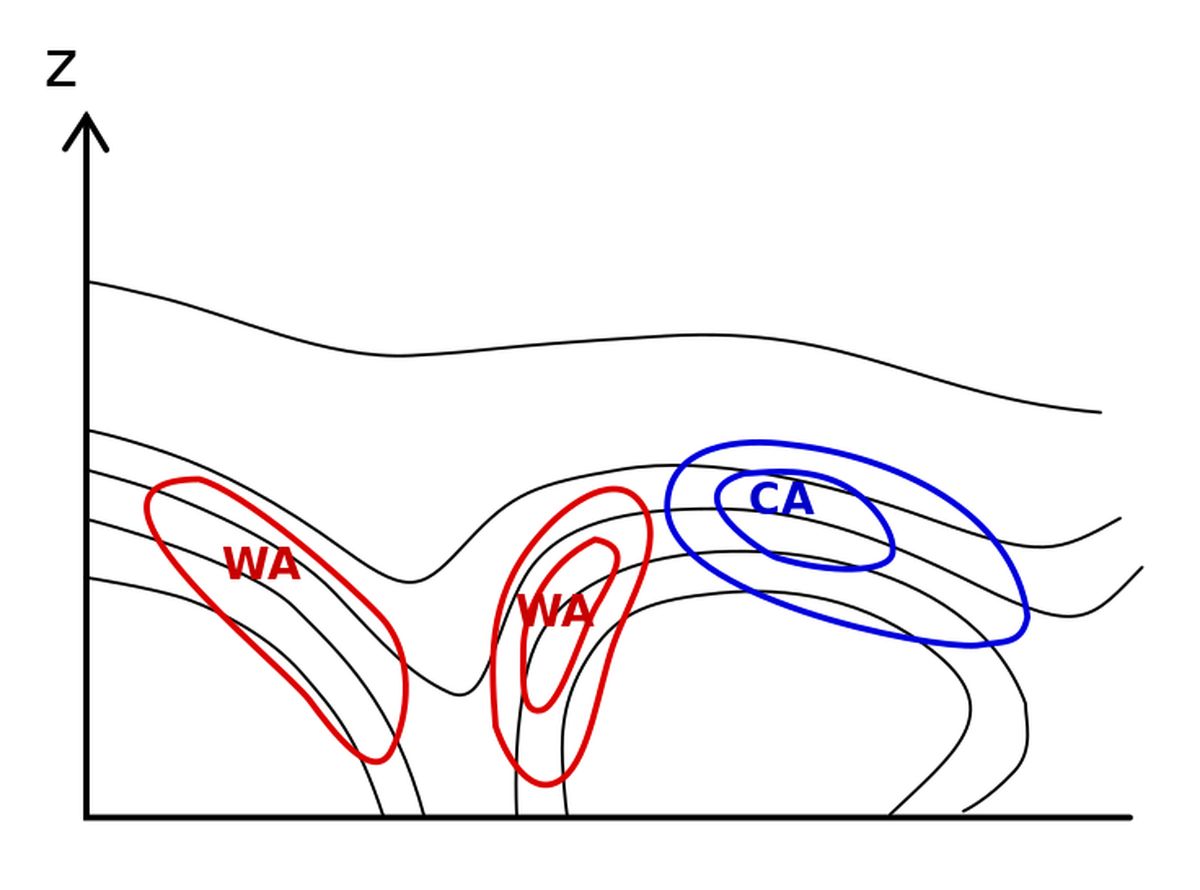
Figure 7:
Left: Vertical cross section showing the equivalent potential temperature (black lines) and the temperature advection (red and blue lines) from ECMWF model data.
Right: Schematic of the vertical cross section.
Figure 8 shows how the dry intrusion has affected even lower atmospheric regions than in the intensification stage.
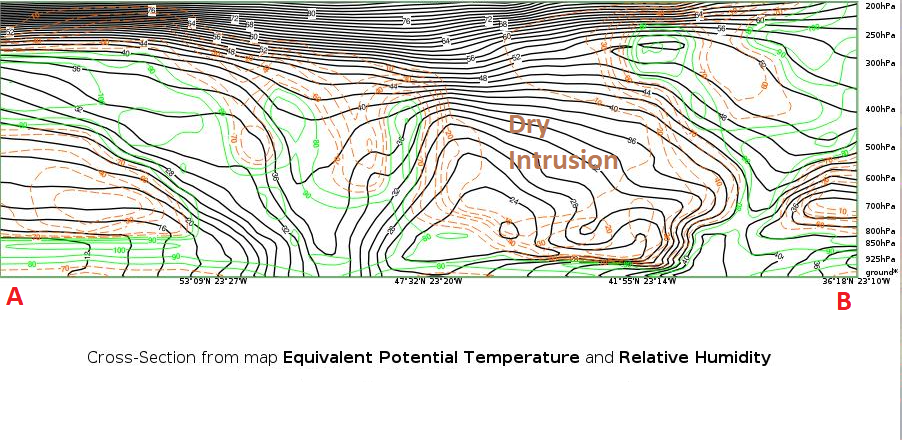
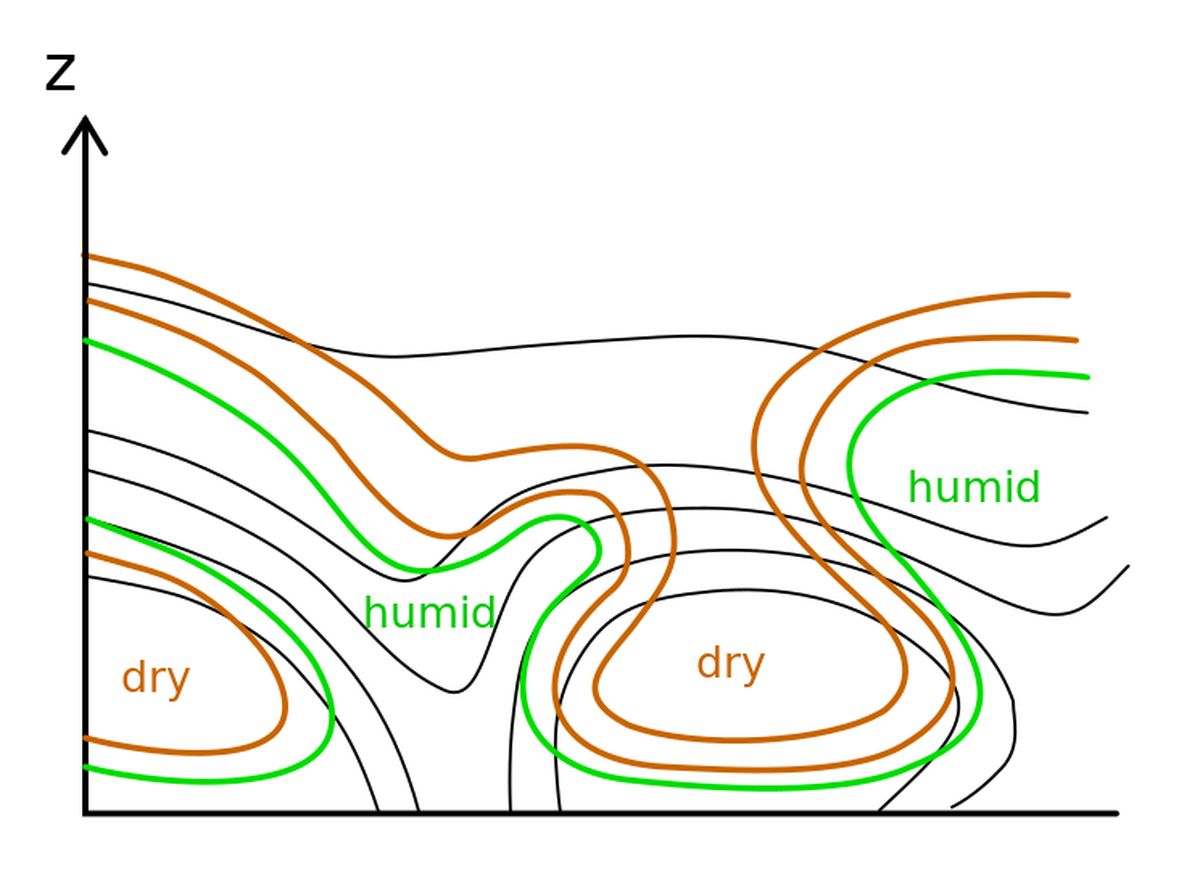
Figure 8:
Left:: Vertical cross section showing the equivalent potential temperature (black lines) and relative humidity (green and brown lines) from ECMWF model data.
Right: Schematic Schematic of the vertical cross section.
The dissipation stage
During the final part of the Shapiro-Keyser cyclone life cycle, the temperatures of the warm core and the surrounding cold air masses adjust, so that the warm front weakens. The cold front finally catches up with the warm front, a similar process to that of the Norwegian cyclone type.

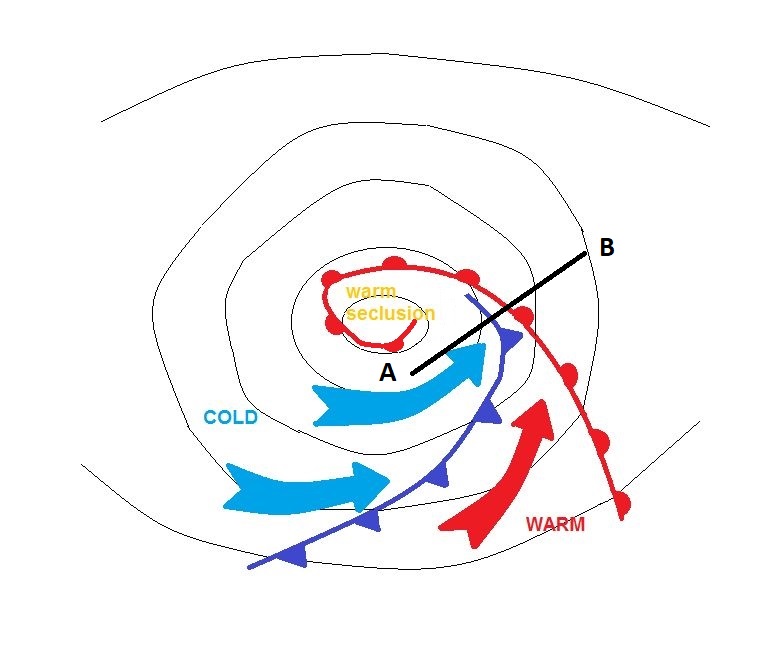
Figure 9:
Left: Airmass RGB from 4 March 2022 at 21:00 UTC with fronts and the position of the vertical cross section.
Right: Schematic of the dissipation stage of the Shapiro-Keyser cyclone with surface fronts and the position of the vertical cross section.
The VCS through the cold and warm front shows them forming a V-shape when looking at equivalent potential temperature. The occlusion is of the warm front type, as the cold front does not reach the ground. The cold front is primarily characterized by a strong humidity gradient rather than by a temperature gradient (see Figure 10).

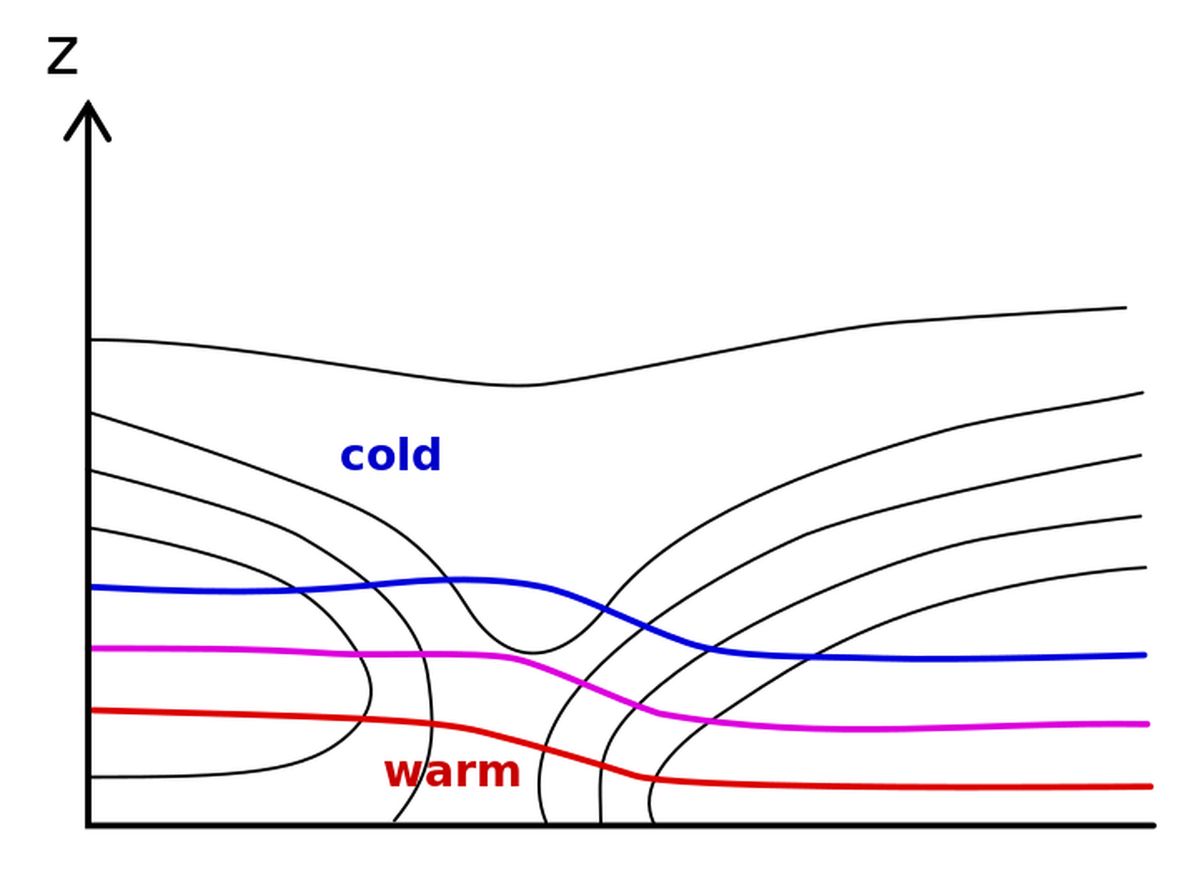
Figure 10:
Left:: Vertical cross section showing equivalent potential temperature (black lines) and temperature (dotted red and blue lines) from ECMWF model data.
Right: Schematic of the vertical cross section.
The warm front is characterized by warm air advection. The magnitude depends on the propagation speed and the intensity of the temperature gradient.

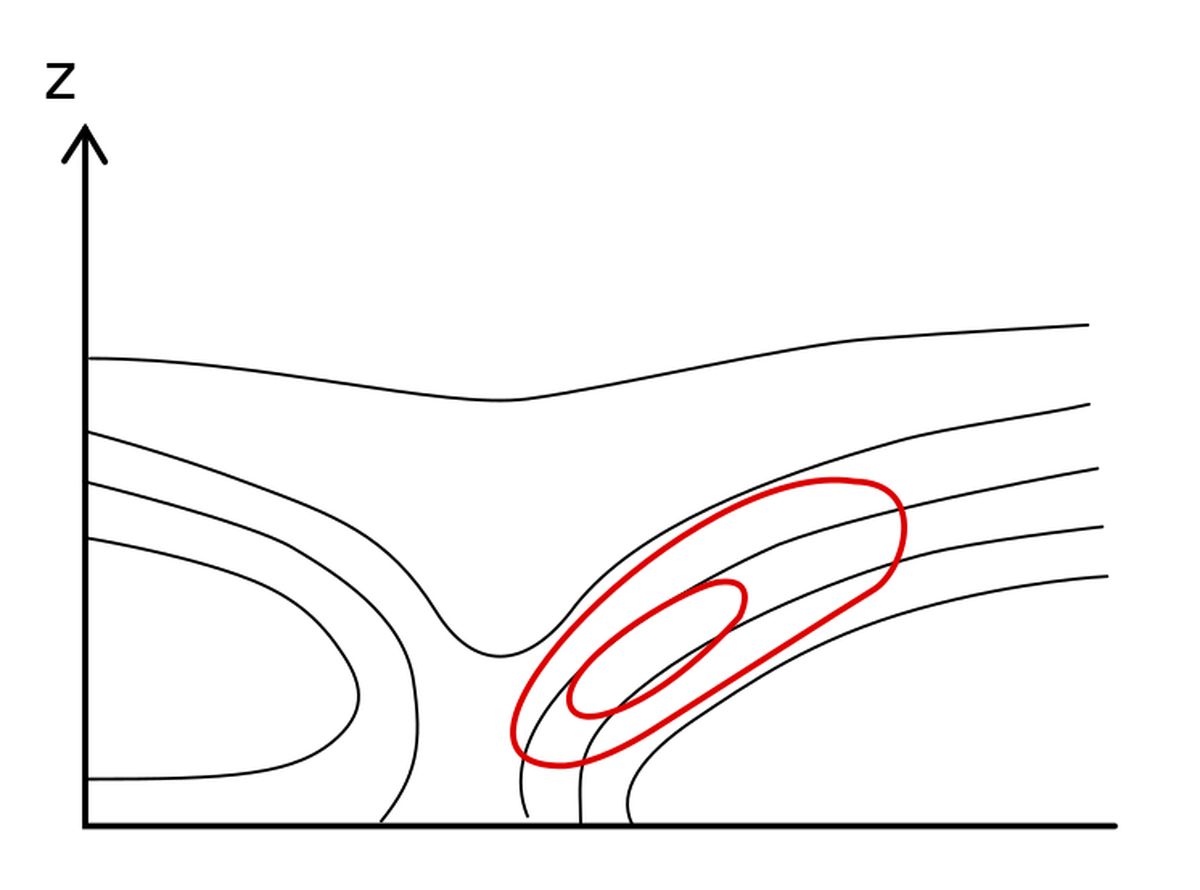
Figure 11:
Left: Vertical cross section showing the equivalent potential temperature (black lines) and temperature advection (red and blue lines) from ECMWF model data.
Right: Schematic of the vertical cross section.
Higher moisture content and temperatures are found in the narrowing warm sector between the cold and the warm front. This frontal configuration is the same as in the Norwegian cyclone type where it is called an occlusion.

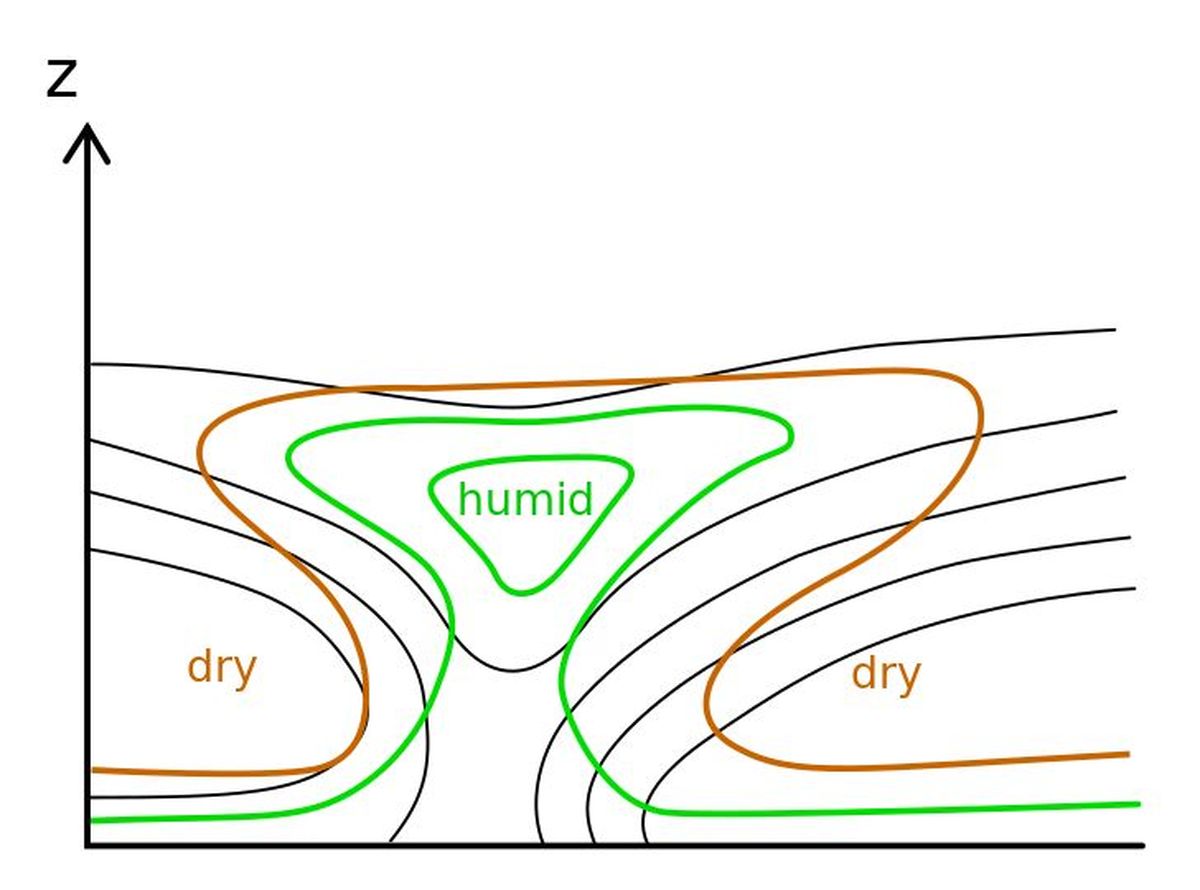
Figure 12:
Left: Vertical cross section showing equivalent potential temperature (black lines) and relative humidity (green and brown lines) from ECMWF model data.
Right: Schematic of the vertical cross section.