Typical Appearance In Vertical Cross Sections
Current numerical weather prediction models do not contain any information about dust size, distribution or concentration, nor do they include cloud microphysical parameterisations to handle the interaction of mineral dust particles with moisture. Furthermore, it is unclear whether models correctly simulate the increased cooling effect during night-time from the presence of mineral dust in the upper troposphere.
Vertical cross sections show:
- A stratified air mass in the upper troposphere with a moist layer on top of a dry layer before ice nucleation starts
- An inclined frontal zone with up-gliding moist air (typically a warm front, but also seen in occlusions with warm front characteristics).
- The moist layer expands vertically with time. This is not necessarily connected to the vertical mixing process, but to the progressing warm front.
The pockmarked pattern of the dusty cirrus cloud deck can be observed all over the cloud shield after the radiative cooling process has occurred during the night.
Case: 30 March 2022; 00:00 - 06:00 UTC
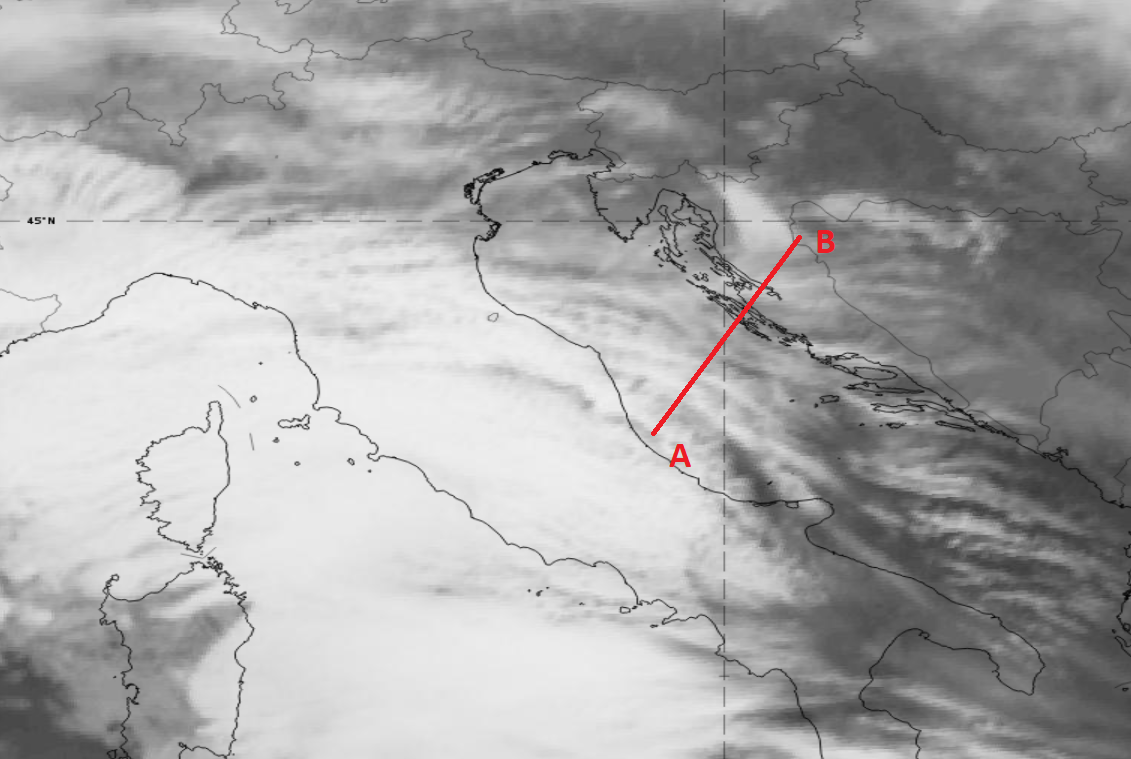
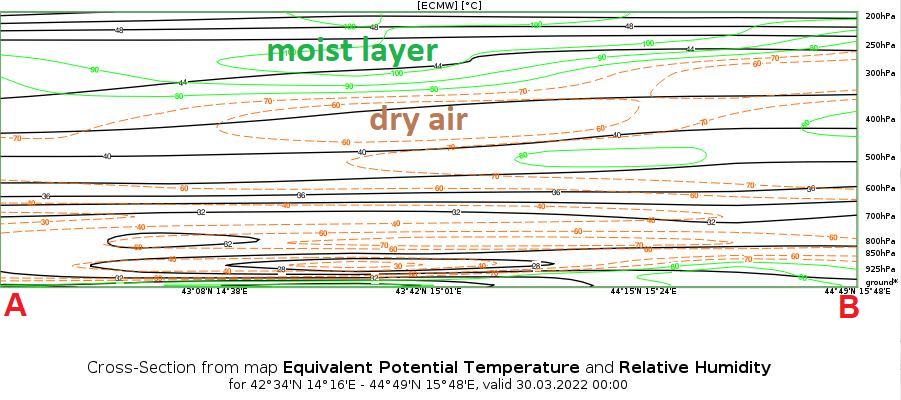
Figure 1: SEVIRI IR 10.8 µm image from 30 March 2022 at 00:00 UTC (left) and corresponding vertical cross section (right) showing the equivalent potential temperature (black) and relative humidity isolines (green/brown) from ECMWF data.
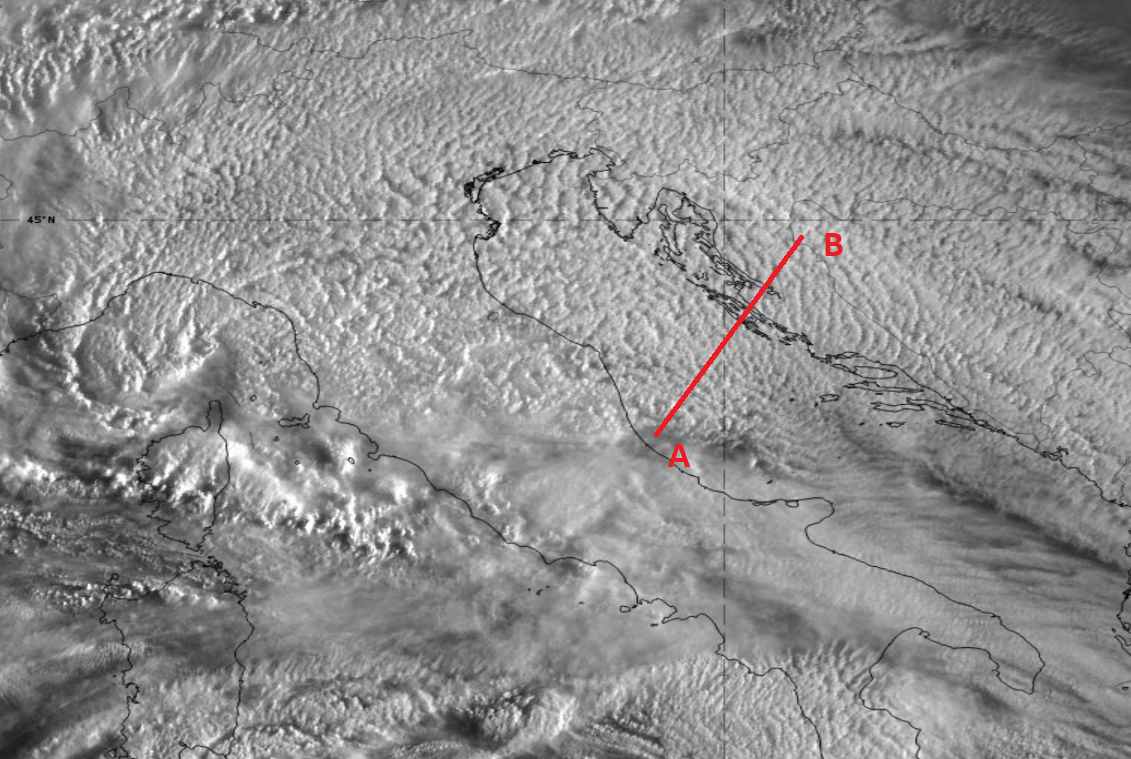
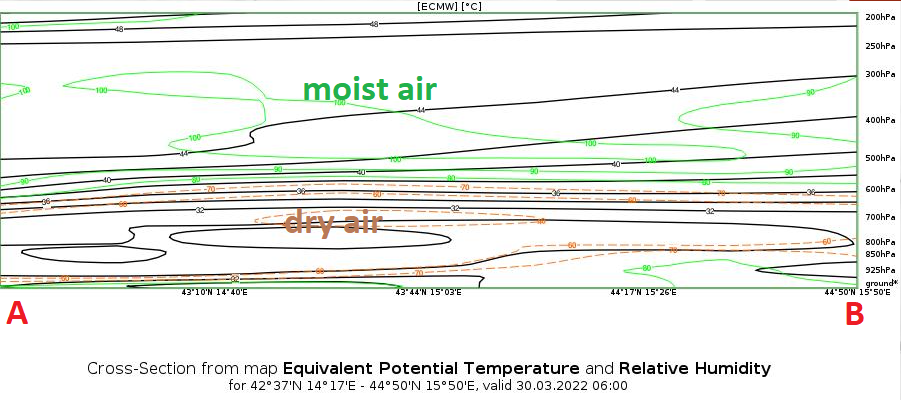
Figure 2: SEVIRI HRVIS image from 30 March 2022 at 06:00 UTC (left) and corresponding vertical cross section (right) showing the equivalent potential temperature (black) and relative humidity isolines (green/brown) from ECMWF data.
The 00 UTC radiosonde profile from Zadar (Figure 3) is in agreement with the model VCS (Figure 1).
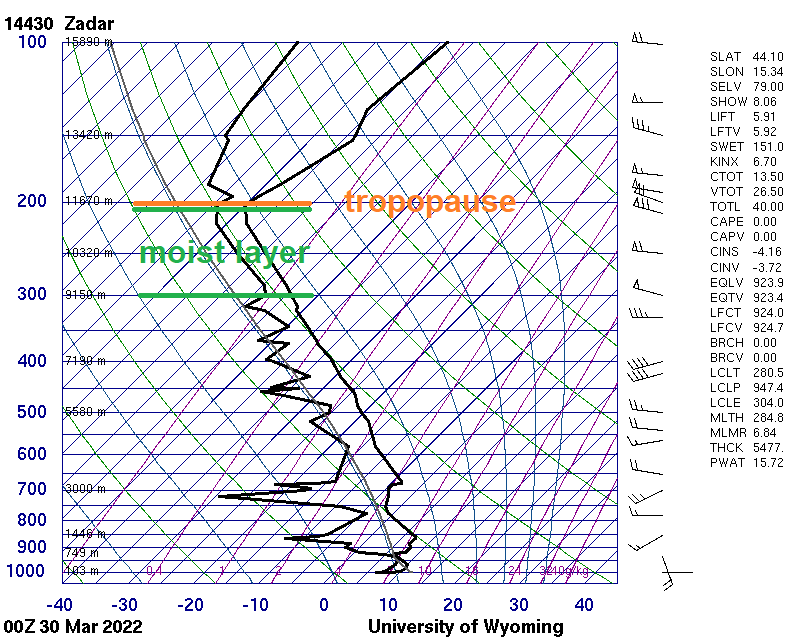
Figure 3: Radiosonde profile of temperature and dew point for Zadar (14430) on 30 March 2022 at 00:00 UTC.