Table of Contents
Cloud Structure In Satellite Images
Dust-Infused Baroclinic Storms (DIBS), sometimes also called Dust-Infused Baroclinic Systems, often show a characteristic cloud top pattern that is best seen at low solar angles in high-resolution visible imagery. When mineral dust reaches the cloud top region due to the strong ascending motions in these baroclinic storms, the opaque cirrus clouds exhibit a cellular structure over large parts of the cloud deck.
The cellular or pockmarked cloud structure is mainly observed at the warm front part of a frontal system, especially if the frontal system is in the form of a cloud shield (see Warm Front Shield). Warm fronts usually have a smooth cloud top layer, so that the difference between a dust-infused cirrus cloud deck and a 'clean air' warm front is clearly visible.
More rarely, this characteristic cloud top structure is observed at Warm Conveyor Belt (WCB) type Occlusions, when the upgliding WCB air splits into two branches (see Occlusion: WCB type).
Appearance in the basic channels
- The cellular pattern of dust-infused cirrus clouds is best seen at low solar angles in high-resolution visible imagery. The uneven structure of the cirrus cloud deck is enhanced by the shadows cast on the cloud top layer.
- At high solar zenith angles, the characteristic cloud pattern is not clearly visible.
- The shallow cloud pattern is not well seen in thermal infrared imagery as the cloud top height variations are rather small and hence the cloud top temperature differences are minimal.
- Water vapor absorption bands do not depict the cellular cloud top structure at any resolution.
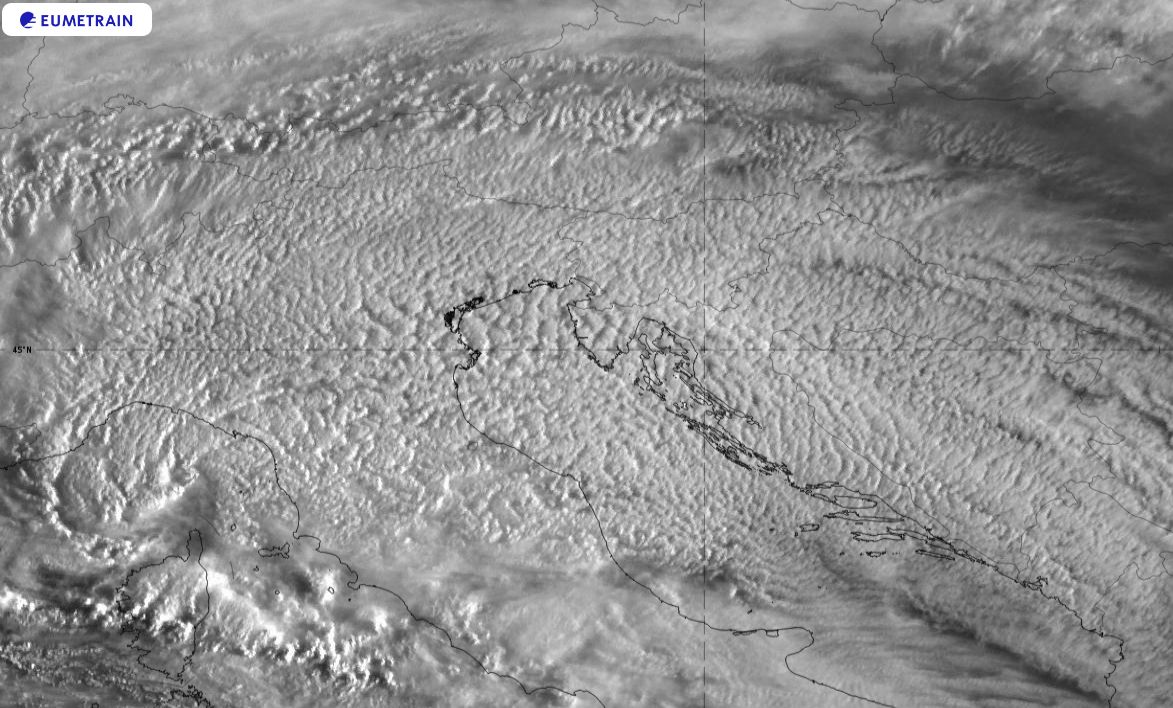
Figure 1: SEVIRI High Resolution Visible image from 30 March 2022 at 06:00 UTC.
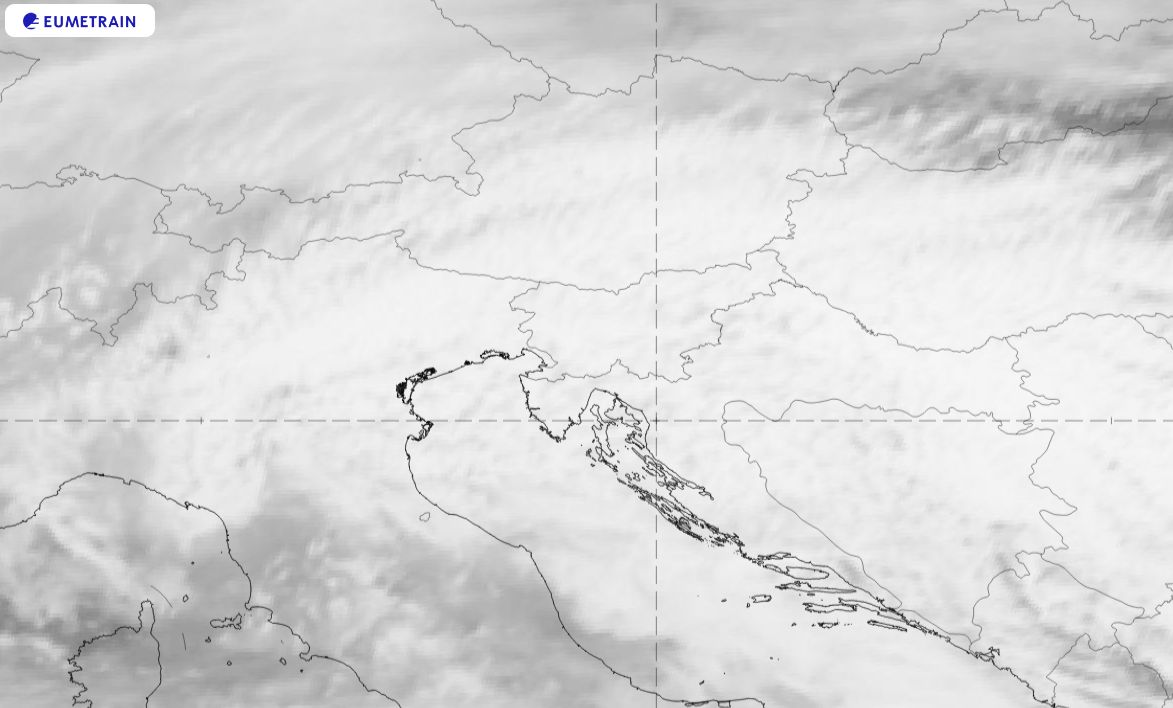
Figure 2: SEVIRI IR 10.8 µm image from 30 March 2022 at 09:00 UTC.
Appearance in standard RGBs:
HRV Cloud RGB
Dusty cirrus clouds appear whitish blue in the HRV Cloud RGB. The high reflectivity of the opaque cloud layer in visible channels combined with very cold cloud tops results in a bluish hue. Shaded areas around the cloud cells are dark blue due to missing the contribution of reflected short wave radiation.
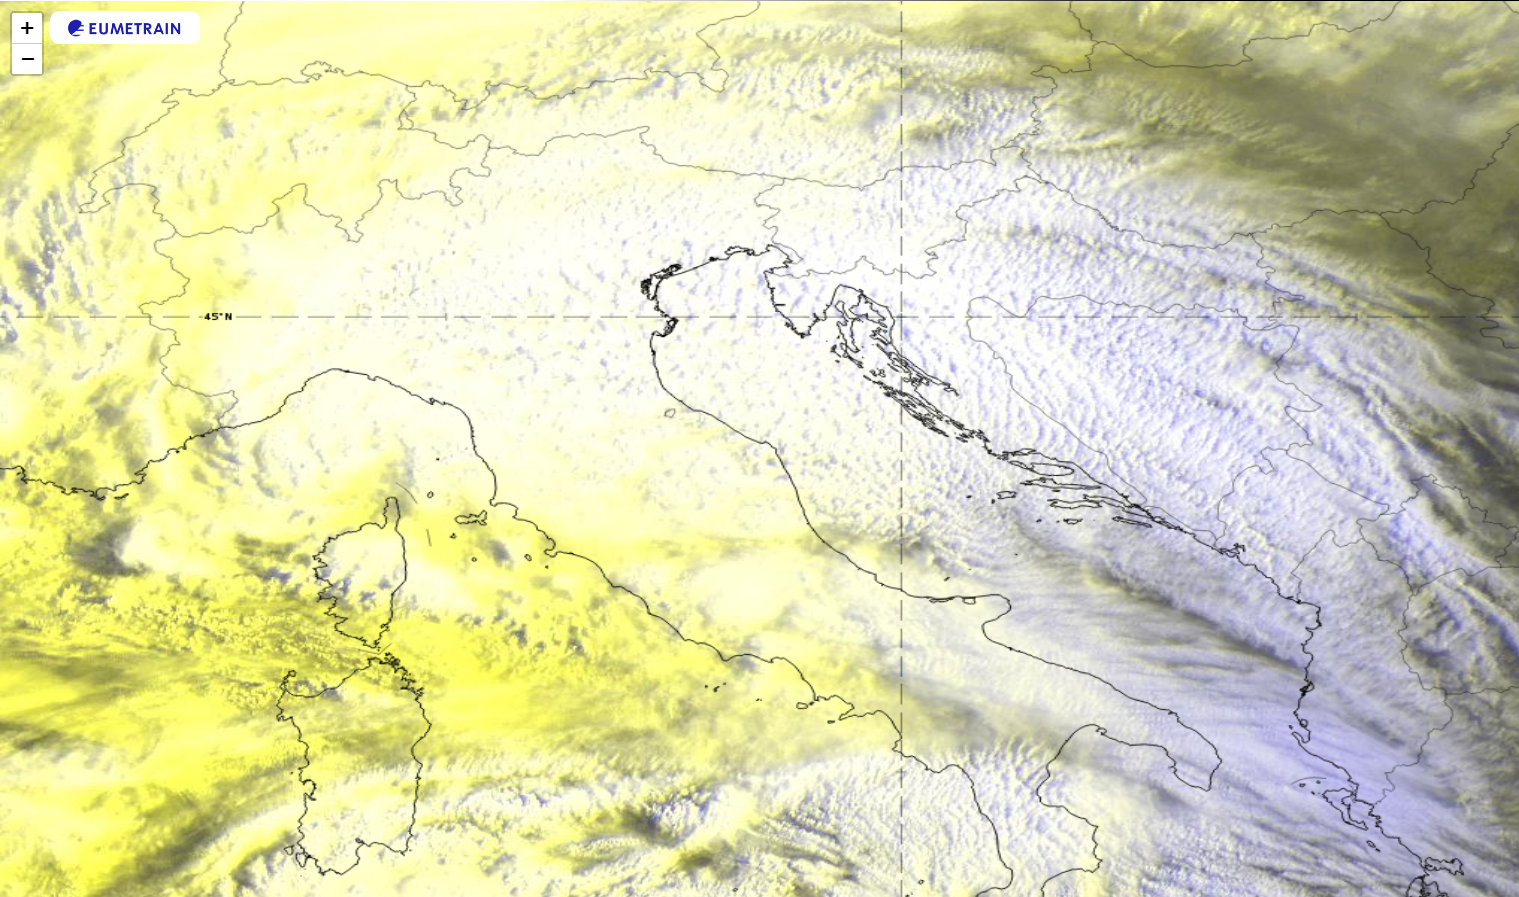
Figure 3: SEVIRI HRV Cloud RGB from 30 March 2022 at 06:00 UTC.
Day Natural Color RGB
The pockmarked cloud structure appears cyan in the Day Natural Color RGB. The cyan color is typical for high reaching opaque clouds made of ice crystals.
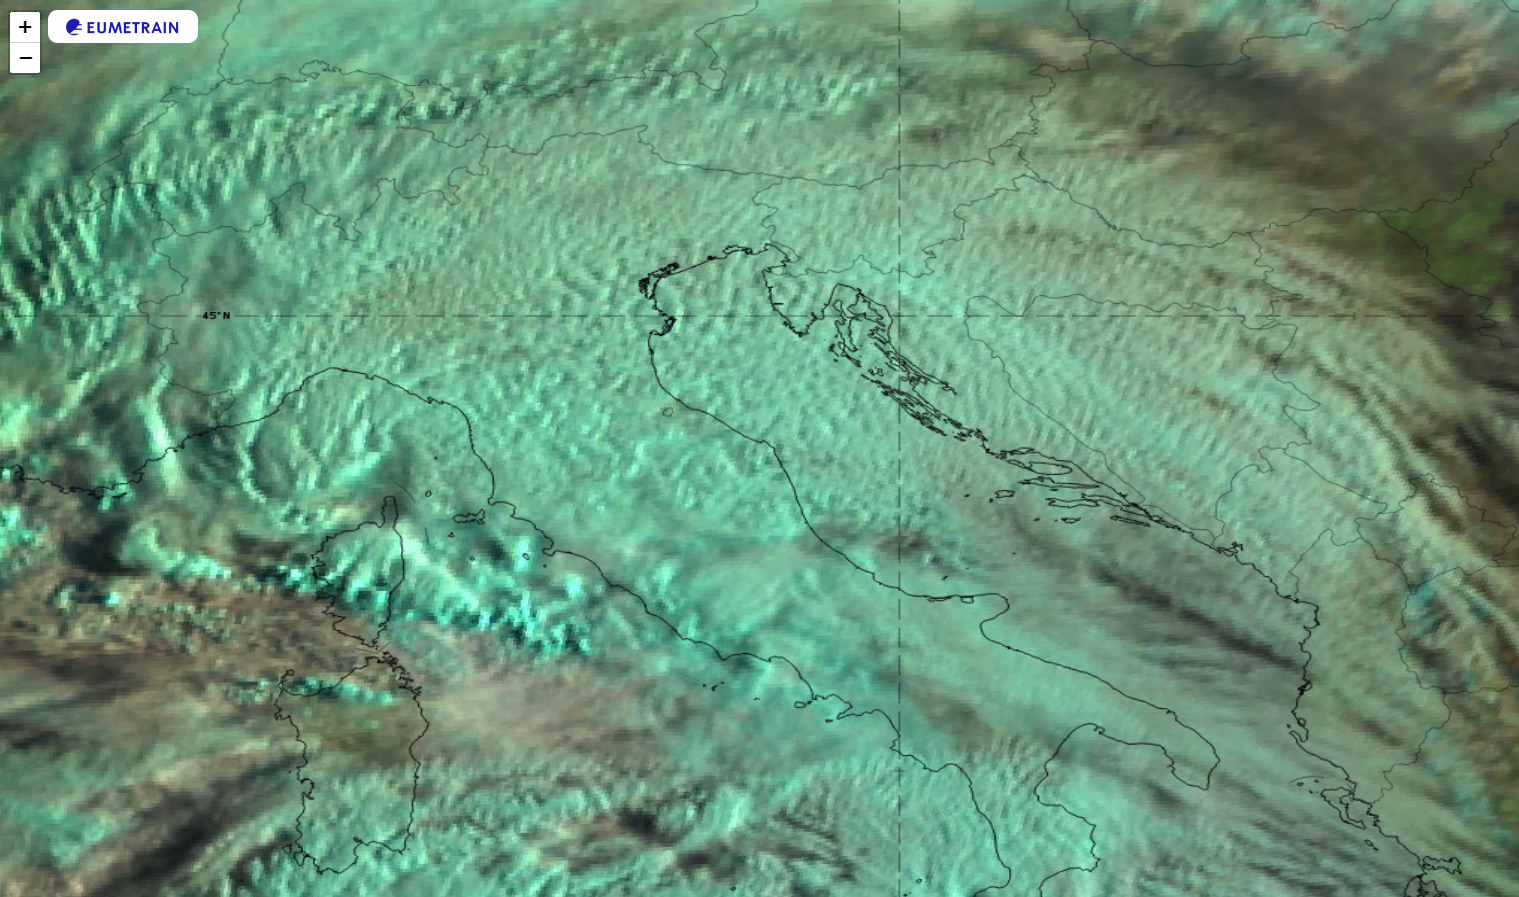
Figure 4: SEVIRI Natural Color RGB from 30 March 2022 at 06:00 UTC.
Severe Storms RGB
Dusty cirrus clouds are characterized by pinkish red to washed-out yellow colours in the Severe Storms RGB. This is an indication of small ice crystals, which typically appear at the top layers of clouds formed by dust.
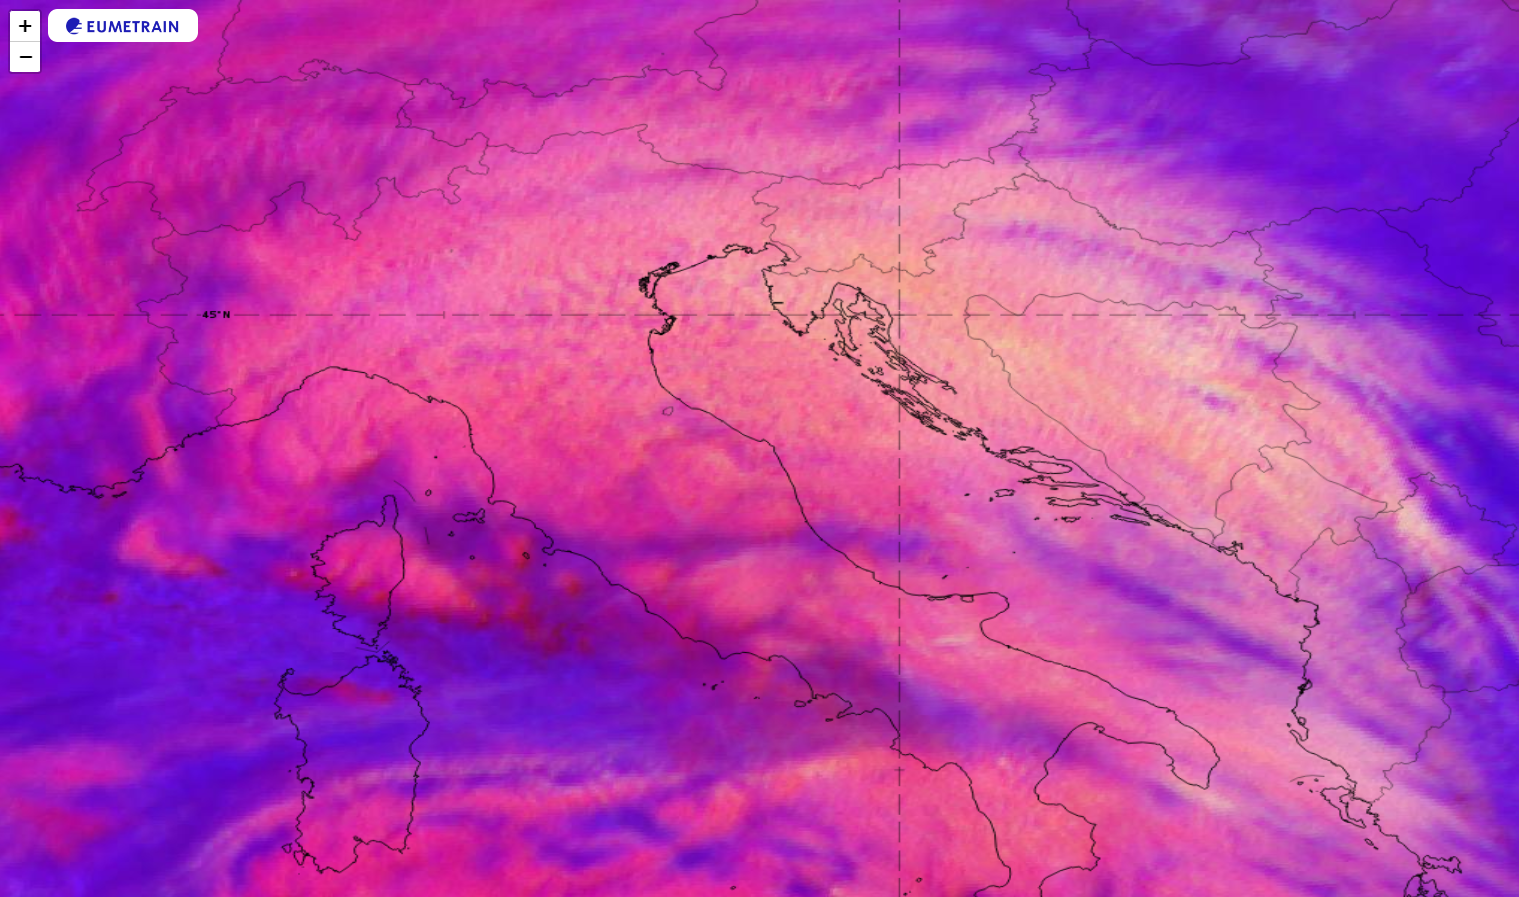
Figure 5: SEVIRI Severe Storms RGB from 30 March 2022 at 06:00 UTC.
Meteorological Physical Background
Dust-infused baroclinic systems are large mid-latitude cyclones that ingest large amounts of mineral dust from desert surfaces and transport them over long distances. Strong ascending motions inside the system lift the mineral dust particles up to the tropopause where they can be involved in the formation of small ice crystals to form so-called dusty cirrus clouds.
Figure 1: Formation of DIBS over northern Africa. Strong magenta colors indicate the rising dust plumes. SEVIRI Dust RGB from 19 - 22 March 2023 (00:00 - 05:45 UTC).
Transport mechanism
For Europe, most DIBS events originate over North Africa, where developing dust plumes can be detected in the Dust RGB. Some of these dust plumes are transported by southerly airstreams towards Europe. A large number of cases occur over Europe from January to March; this is consistent with the general circulation pattern at this time of year, favouring the formation and propagation of mid-latitude cyclones further south than during the rest of the year.
Figure 2: Mineral dust transport (magenta color) over the Mediterranean Sea. SEVIRI Dust RGB from 19 - 20 June 2023 (05:15 - 05:15 UTC).
The part of the cyclone involved in the upward motion of the dust particles is the warm conveyor belt, a stream (relative to the motion of the cyclone) of prefrontal warm and humid air that follows an ascending motion towards the warm front and, at later stages, towards the occlusion cloud band. Consequently, most dusty cirrus events are observed on top of the warm front of a mid-latitude cyclone.
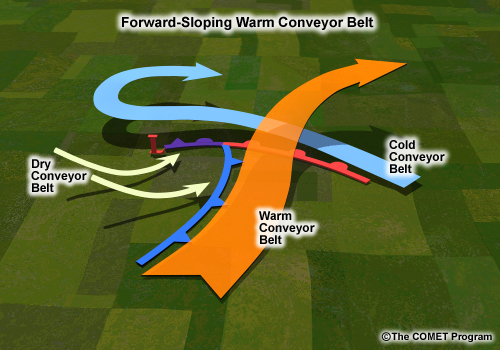
Figure 3: The main relative streams (conveyor belts) involved in a mid-latitude cyclone. The rising orange stream is the so-called Warm Conveyor Belt.
Dusty cirrus formation
The mineral dust particles act as cloud condensation nuclei and at higher levels as ice deposition nuclei. Due to their abundance and the limited availability of water vapour at higher atmospheric levels, these cloud top ice crystals are extremely small. Dusty cirrus clouds are synoptic-scale opaque ice clouds with reduced visible reflectance and a cellular cloud top texture.
The characteristic cellular structure of dust-infused cirrus clouds is a strong indication of ongoing shallow convection at the cloud top layers. Later in the day, the pockmarked structure of the cirrus cloud deck usually vanishes. The influence of desert mineral dust on cloud formation processes is still a critical yet poorly understood element of atmospheric cloud physics. Currently, two partially overlapping explanations can be found in the literature:
Night-time radiative cooling (Nagy and Kollath)
- Mineral dust is transported with the warm conveyor belt up to the tropopause.
- The dust-loaded air mass of the warm conveyor belt has high humidity.
- With mineral dust in the atmosphere, outgoing longwave radiation during the night is stronger for dusty cirrus than for classical (i.e., clean air) cirrus clouds.
- Strong radiative cooling leads to a destabilization of the topmost cloud layers under night-time conditions.
- Shortwave absorption processes in daylight conditions lead again to a stabilization of the dusty cirrus layer and the cellular pattern disappears.
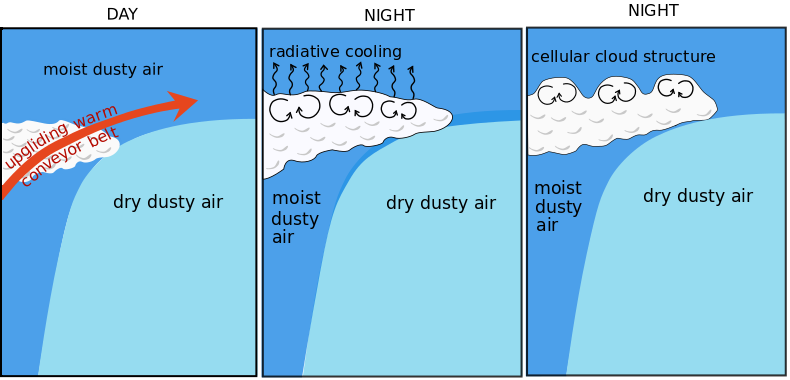
Figure 4: Schematic showing the physical processes that lead to the formation of dusty cirrus with a cellular cloud top pattern according to the night-time cooling theory.
Mixing instability theory (Seifert et al.)
Based on the observation that not all DIBS produce a dusty cirrus cloud deck with a cellular pattern, Seifert et al. (2023) formulated the mixing instability theory.
- As a precondition, the air near the cloud tops must be stratified: moist clean air above and a drier air mass containing the mineral dust particles below.
- Initially, small amounts of mineral dust are mixed into the moist air above (heterogeneous ice nucleation). This is usually achieved through continuous, large scale lifting of the air layers as typically happens with the warm conveyor belt.
- Destabilization by increased radiative cooling during the night, followed by turbulent mixing, reinforces ice nucleation (homogeneous ice nucleation).
- Shortwave absorption processes in daylight conditions lead again to a stabilization of the dusty cirrus layer and the cellular pattern disappears.
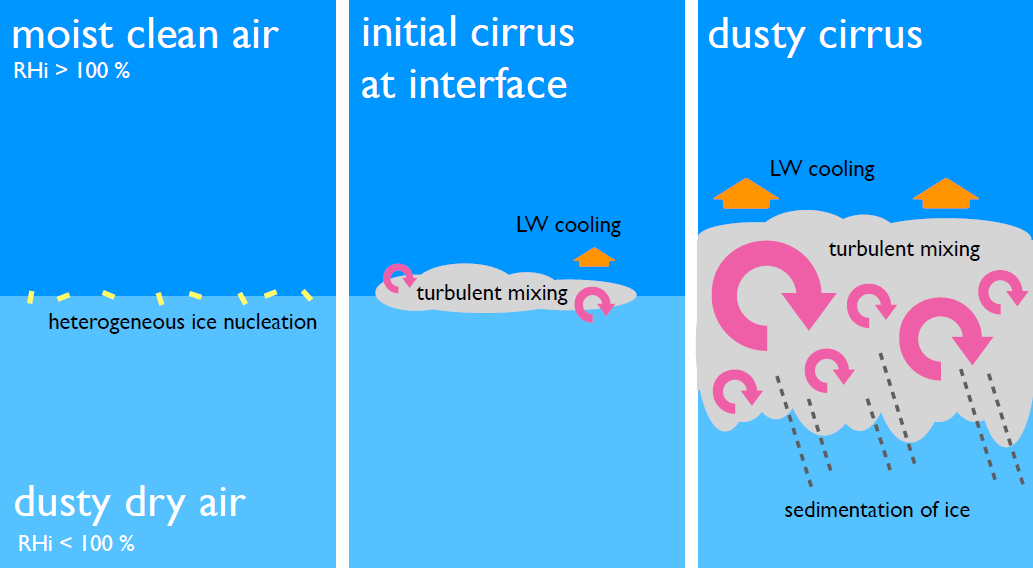
Figure 5: Schematic summarizing the physical processes that lead to the formation of dusty cirrus at the interface between a dry Saharan dust layer below and a moist atmospheric layer above. The conceptual model assumes cold environmental conditions typical for the upper troposphere and near-neutral to weakly-stable stratification (from Seifert et al. 2023).
Key Parameters
For Europe, the major source of mineral dust in the atmosphere is the Sahara desert in northern Africa. Under favorable meteorological conditions, dust particles are transported northwards until they reach the European continent.
The phases leading to dusty cirrus can be described as follows:
- Dust lifting process
- A baroclinic system over the desert with winds strong enough to raise mineral dust particles from the surface up into the air.
- Dust transport
- A meridional dust transport towards Europe, typically in connection with the east side of a deeper trough.
- A lifting mechanism (e.g. a warm conveyor belt) so that dust particles can reach higher atmospheric levels.
- Dust cloud formation
- According to the Mixing Instability Theory, a layered air mass with a dusty dry air mass and a clean moist layer on top is necessary to form the dusty cirrus cloud.
Key parameters related to the dust lifting process:
Surface winds
Strong surface winds are needed to lift the dust particles up into the air. These strong winds are most commonly associated with low-pressure systems over Africa.
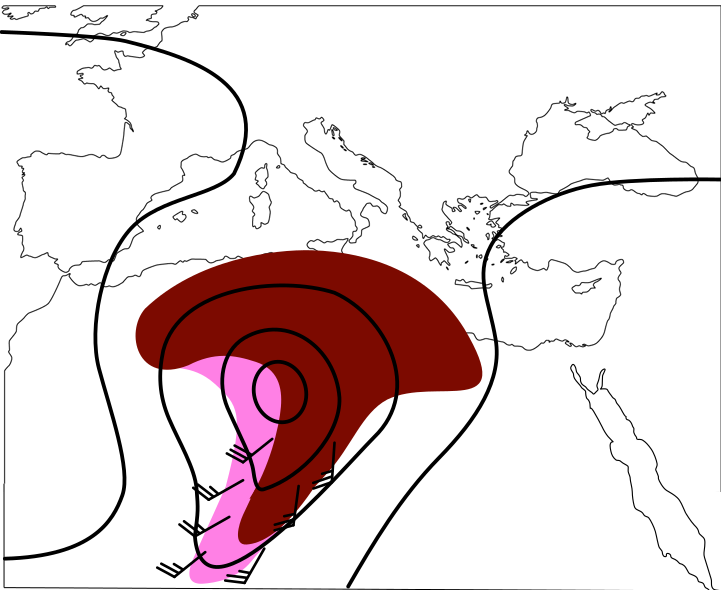
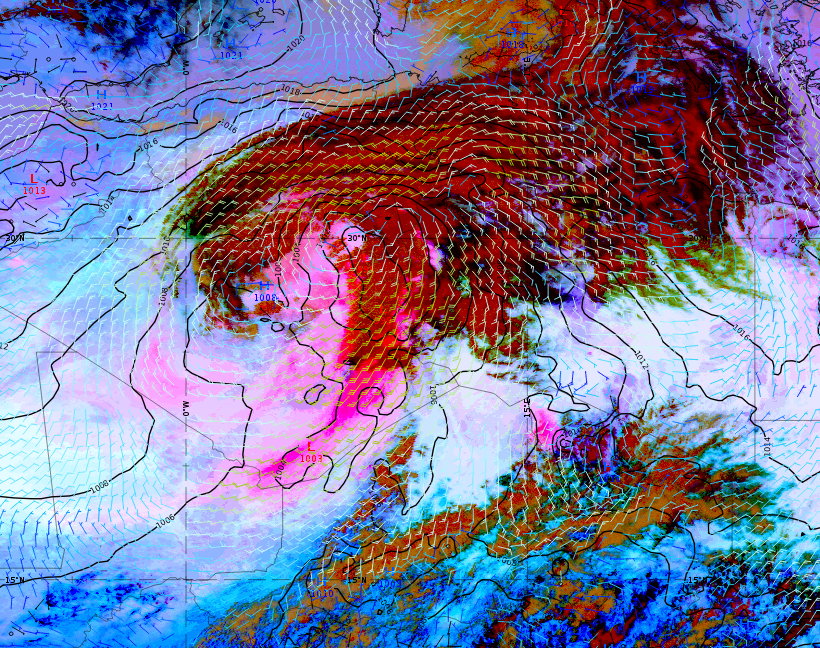
Figure 1: 20 March 2023 at 15:00 UTC. Left: Schematic of strong surface winds. Right: Meteosat 9 (IODC) Dust RGB image showing dust-loaded air (magenta). Mean sea-level pressure (black) and wind barbs at 10 m height.
Key parameters related to the dust transport:
Geopotential height at 500 hPa and mean sea-level pressure
Meridional dust transport over the Mediterranean Sea takes place when an upper-level trough reaches far south. Geostrophic winds at the east side of the trough bring the dust particles to Europe.
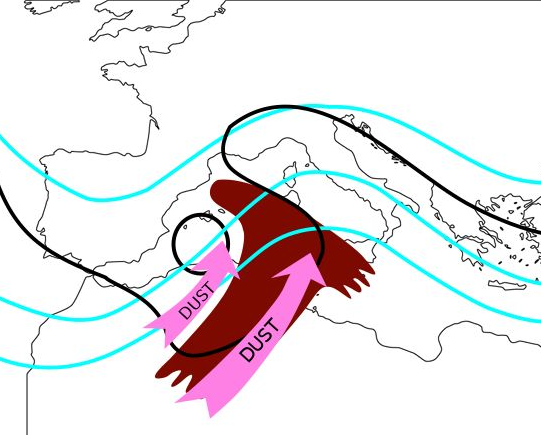
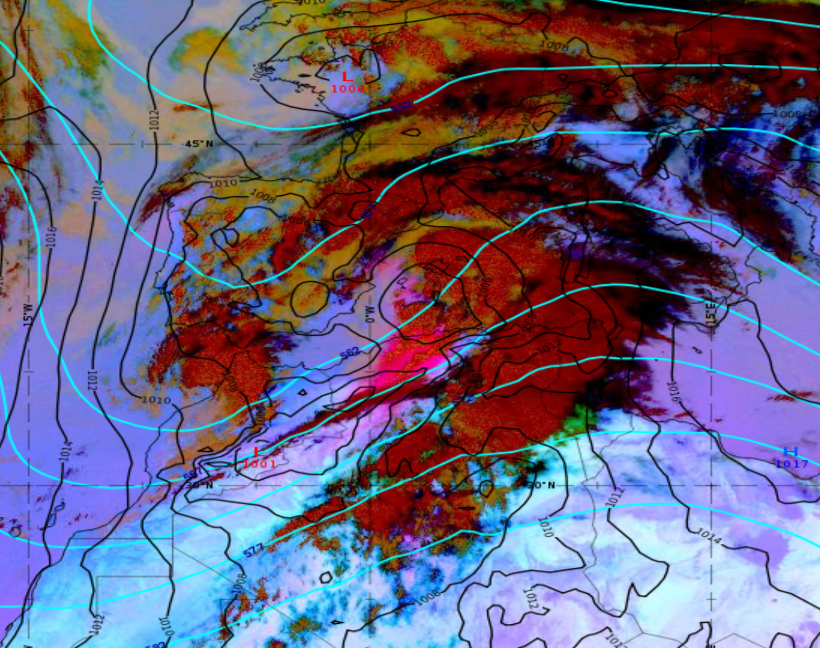
Figure 2: 29 March 2022 at 15:00 UTC. Left: Schematic of meridional dust transport. Right: Meteosat 11 Dust RGB image showing dust-loaded air (magenta). Geopotential height at 500 hPa (cyan) and mean sea-level pressure (black).
Geopotential height at 500 hPa and wind barbs at 850 hPa
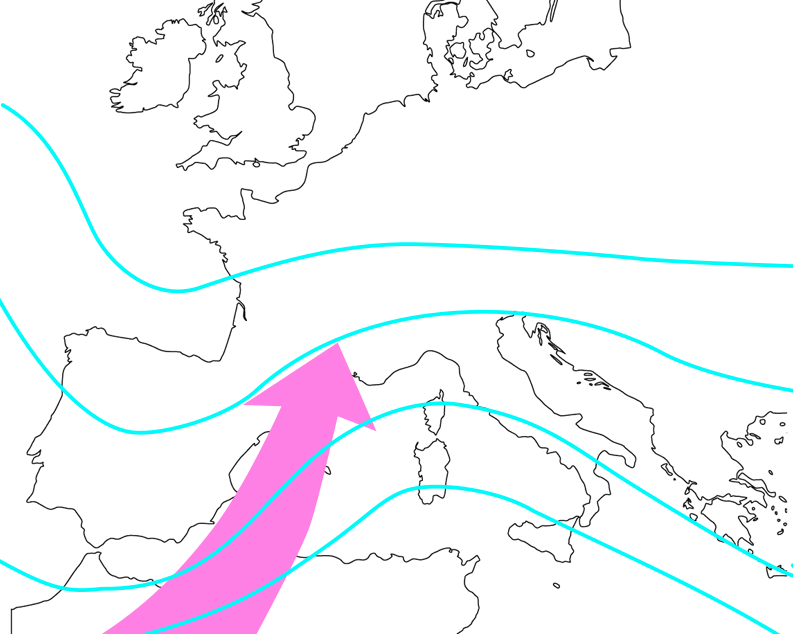
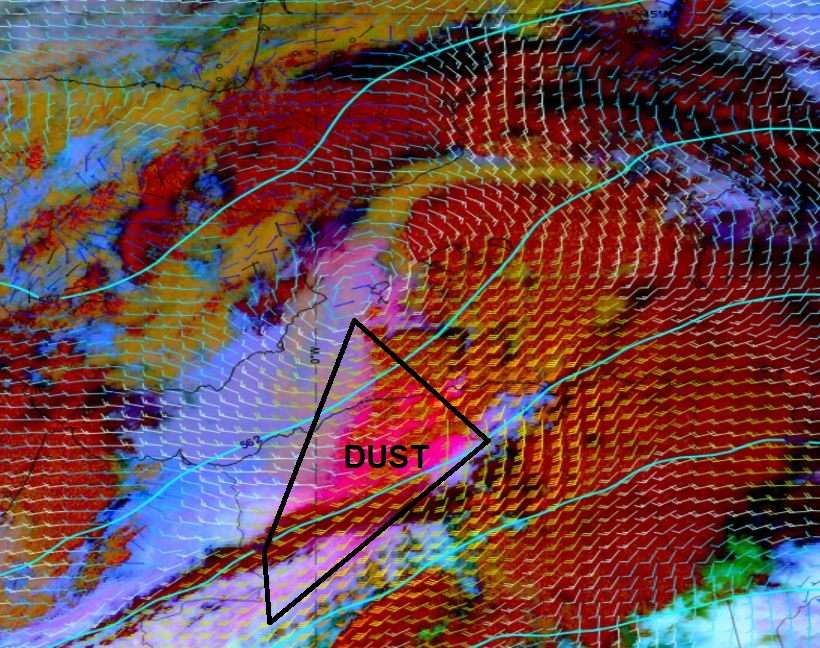
Figure 3: 29 March 2022 at 15:00 UTC. Left: Schematic of meridional dust transport. Right: Meteosat 11 Dust RGB image showing dust-loaded air (magenta). Geopotential height at 500 hPa (cyan) and wind barbs at 850 hPa.
Key parameters related to the dust cloud formation process:
Relative humidity
High-level humidity is required for the formation of the cirrus cloud layer. The vertical distribution of relative humidity shows higher values at cloud level and lower values below. See also the chapter Typical Appearance In Vertical Cross Sections.
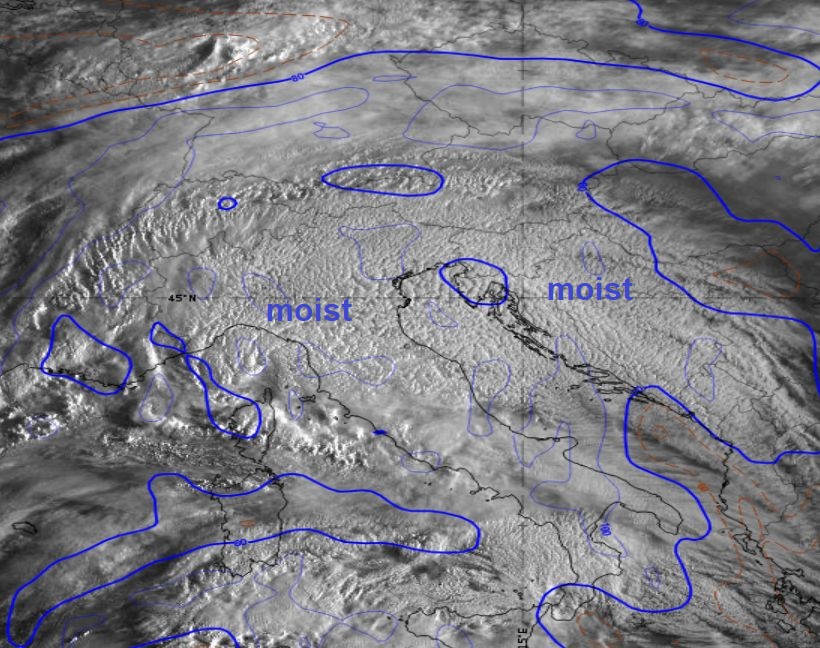
Figure 4: 30 March 2022 at 06:00 UTC. Meteosat 11 HRV image. Relative humidity at 300 hPa (blue).
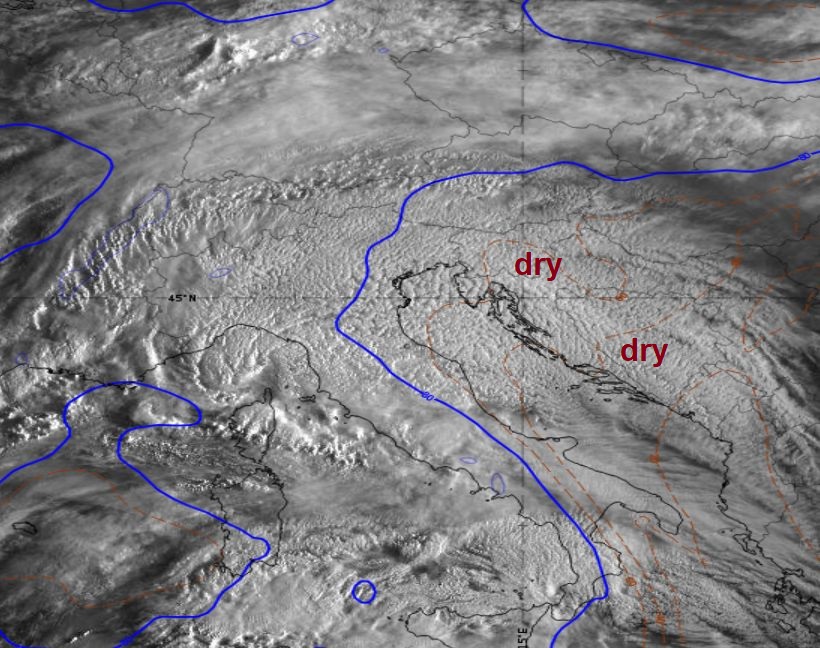
Figure 5: 30 March 2022 at 06:00 UTC. Meteosat 11 HRV image. Relative humidity at 700 hPa (blue).
Typical Appearance In Vertical Cross Sections
Current numerical weather prediction models do not contain any information about dust size, distribution or concentration, nor do they include cloud microphysical parameterisations to handle the interaction of mineral dust particles with moisture. Furthermore, it is unclear whether models correctly simulate the increased cooling effect during night-time from the presence of mineral dust in the upper troposphere.
Vertical cross sections show:
- A stratified air mass in the upper troposphere with a moist layer on top of a dry layer before ice nucleation starts
- An inclined frontal zone with up-gliding moist air (typically a warm front, but also seen in occlusions with warm front characteristics).
- The moist layer expands vertically with time. This is not necessarily connected to the vertical mixing process, but to the progressing warm front.
The pockmarked pattern of the dusty cirrus cloud deck can be observed all over the cloud shield after the radiative cooling process has occurred during the night.
Case: 30 March 2022; 00:00 - 06:00 UTC
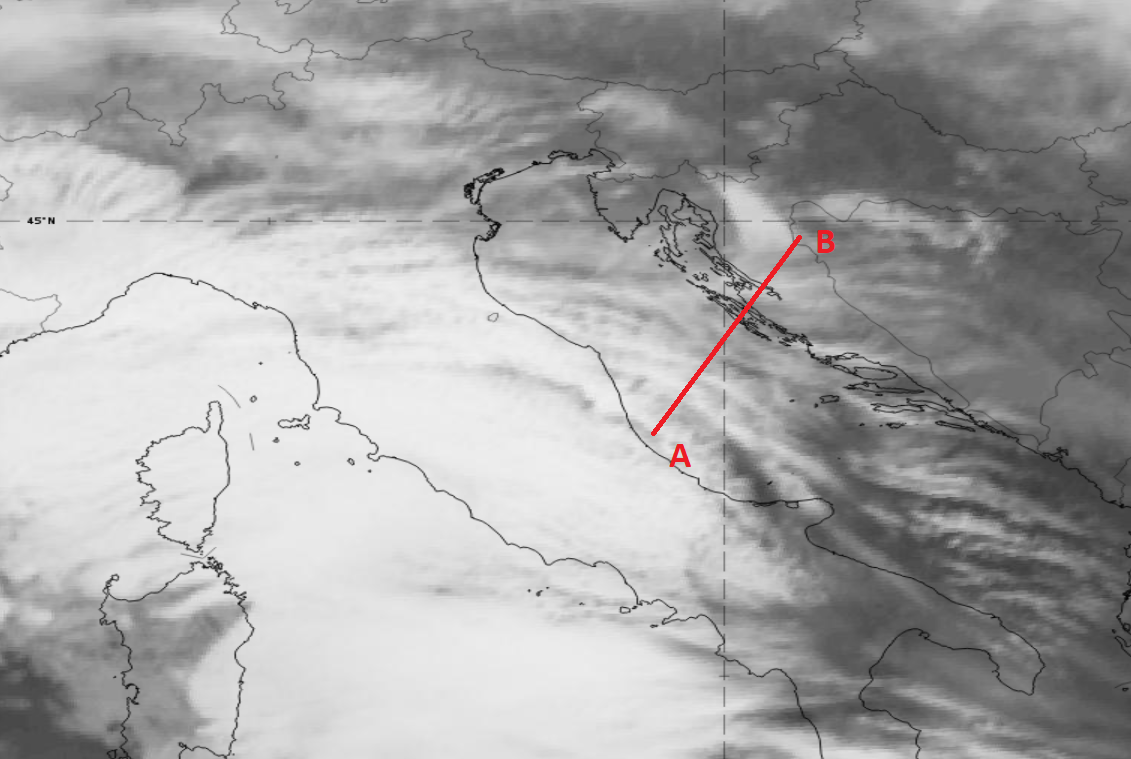
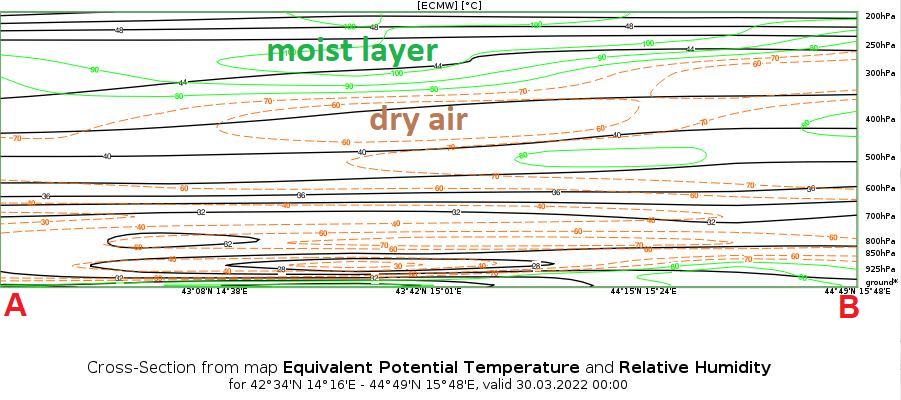
Figure 1: SEVIRI IR 10.8 µm image from 30 March 2022 at 00:00 UTC (left) and corresponding vertical cross section (right) showing the equivalent potential temperature (black) and relative humidity isolines (green/brown) from ECMWF data.
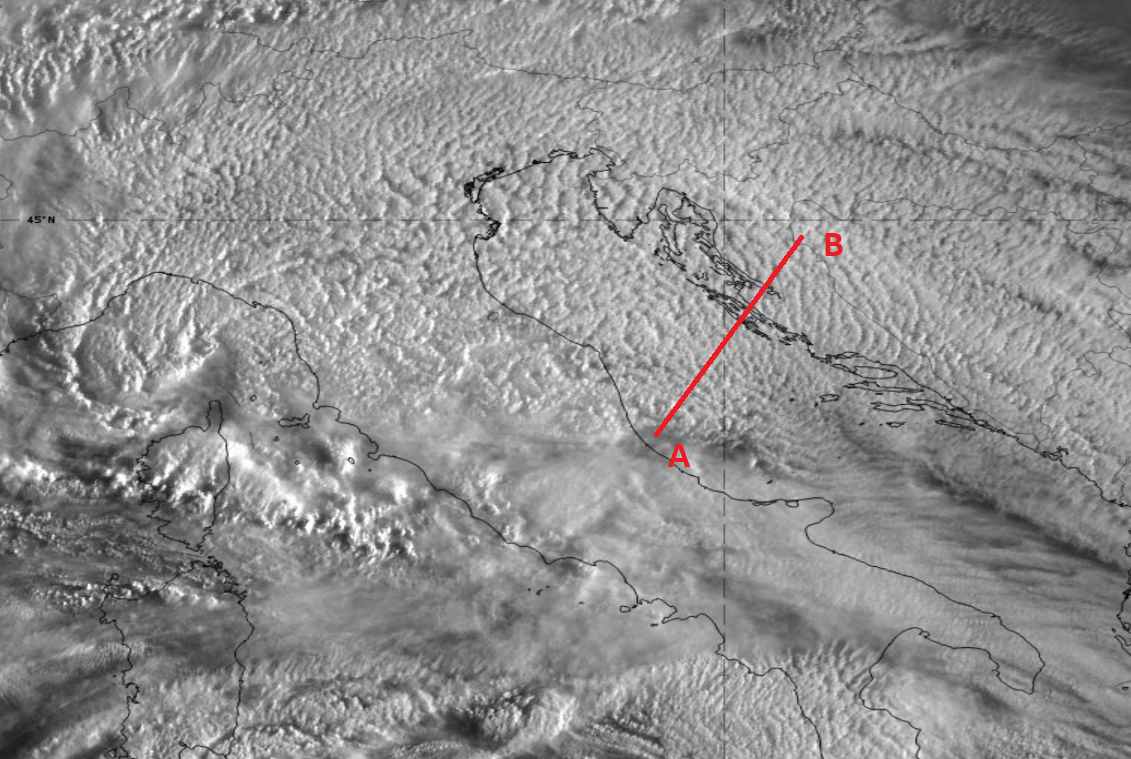
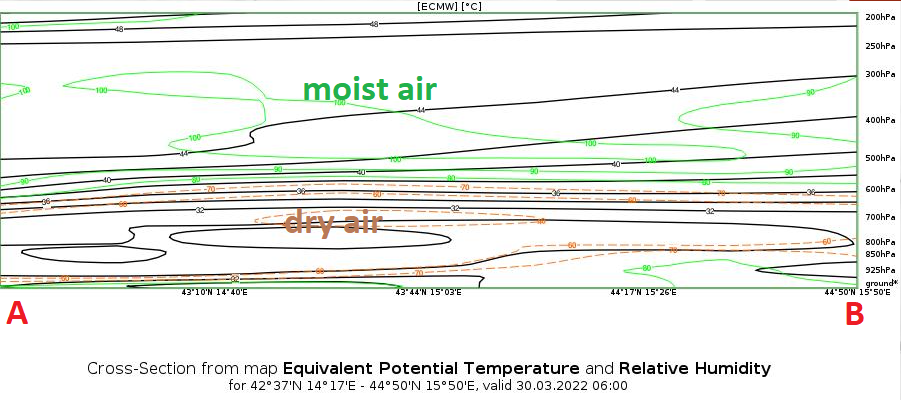
Figure 2: SEVIRI HRVIS image from 30 March 2022 at 06:00 UTC (left) and corresponding vertical cross section (right) showing the equivalent potential temperature (black) and relative humidity isolines (green/brown) from ECMWF data.
The 00 UTC radiosonde profile from Zadar (Figure 3) is in agreement with the model VCS (Figure 1).
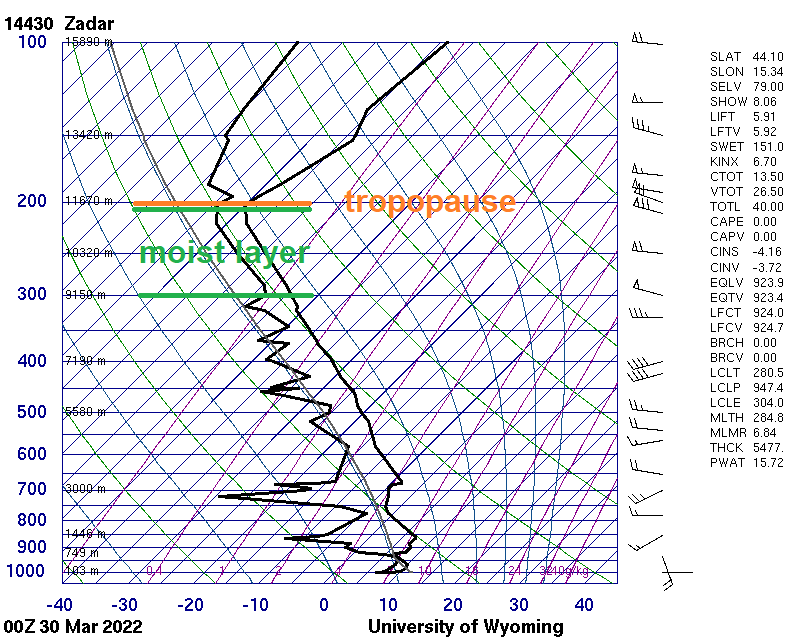
Figure 3: Radiosonde profile of temperature and dew point for Zadar (14430) on 30 March 2022 at 00:00 UTC.
Weather Events
The strongest influence of DIBS, and especially of dusty cirrus, on surface weather is mainly the reduced solar radiation reaching the ground as dust particles act as condensation nuclei and form clouds where otherwise no clouds would have been present. As current numerical weather prediction models do not accurately account for microphysical cloud formation processes caused by the additional dust at higher atmospheric levels, predicted maximum temperatures often have a considerable bias towards higher values.
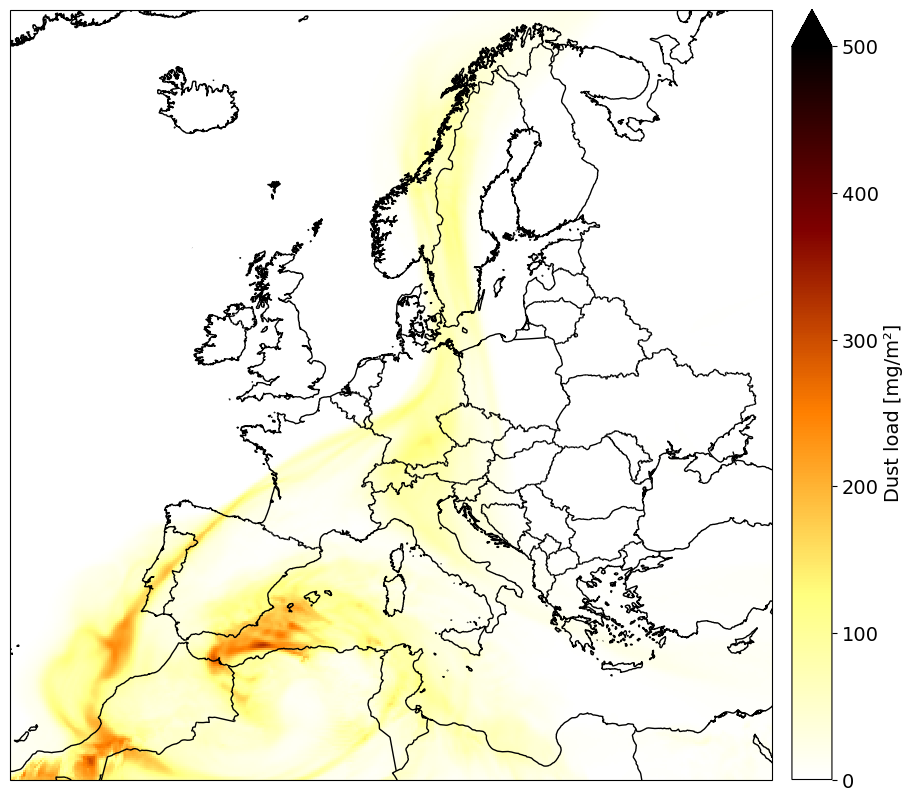
Figure 1: Total dust column for 17 March 2020 at 06:00 UTC (in mg/m2).
|
|
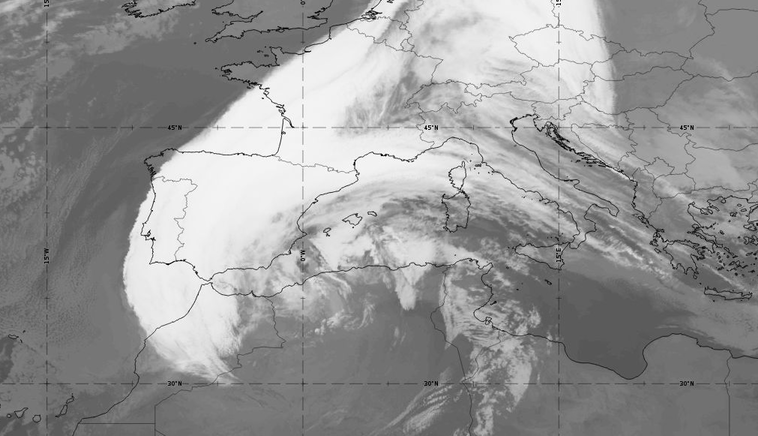
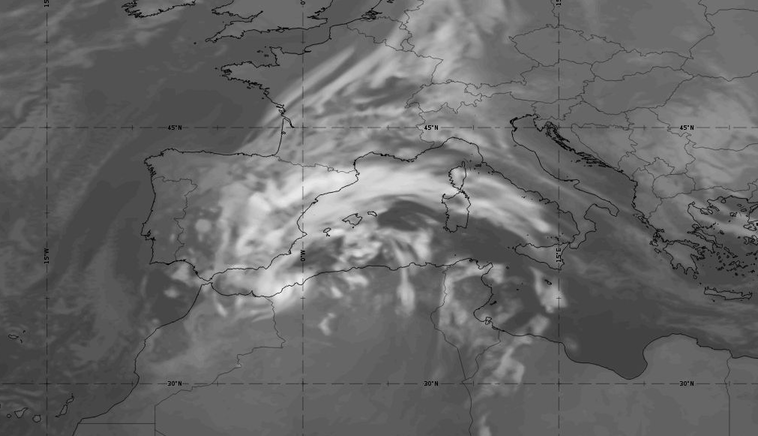
Figure 2: Comparison of a simulated IR 10.8 µm image (ECMWF 6-hour forecast) with a SEVIRI 10.8 µm IR image, for 17 March 2022 at 06:00 UTC (move the slider to compare the two images).
Table 1: Description of the effect of dusty cirrus on surface weather.
| Parameter | Description |
|---|---|
| Solar radiation | Surface solar radiation is considerably reduced when dusty cirrus clouds are present. |
| Temperature | Daytime surface temperature maxima are lower than predicted when dusty cirrus is present. This is mainly due to the reduced intensity of incoming short-wave solar radiation at the ground. Depending on the season, the temperature bias can be up to 5°C.
Vice versa, night-time temperature minima are higher than predicted when cirrus cloud is present because outgoing longwave radiation is backscattered. Overall, the temperature range is smaller than predicted. |
| Precipitation | There is little or no precipitation under a dusty cirrus cloud deck. |
| Visibility and optical phenomena | Reduced visibility due to mineral dust suspended in the air. Diffuse light conditions at the ground below dusty cirrus clouds.
High dust concentration in the atmosphere produces reddish and yellowish skies during sunset hours. |
| Other relevant information | When dusty cirrus is present, the forecasted development of convective precipitation can be inhibited or at least delayed in the convective season.
Dust deposition may occur, which becomes visible on shiny surfaces or snow. When mineral dust is washed out from the atmosphere, rain drops can take on a reddish or brownish colour. |
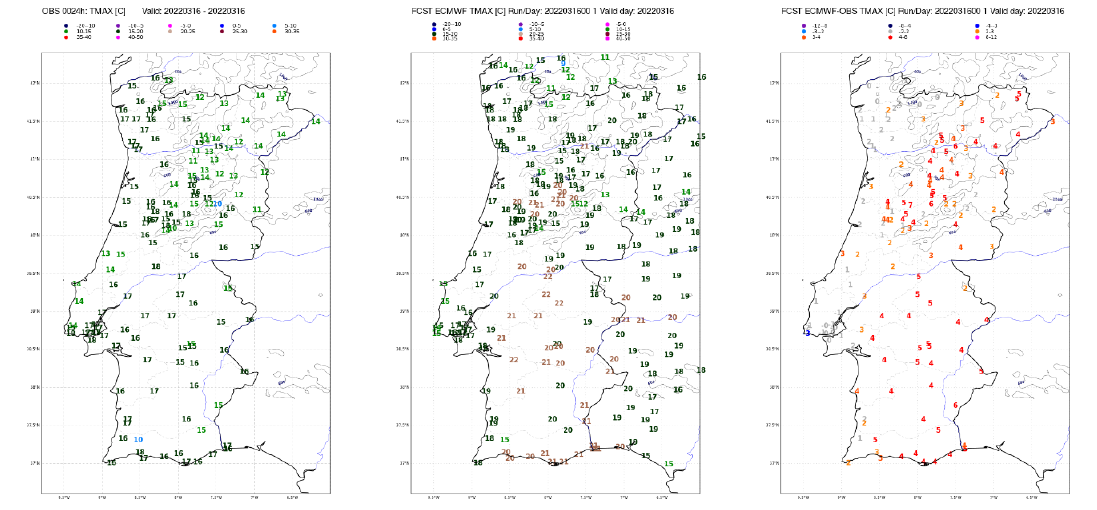
Figure 3: 2-m maximum temperature on 16 March 2022: observations (left), ECMWF forecast from run at 00 UTC (middle) and difference between forecast and observation (right).
The HRV Clouds RGB shows widespread dusty cirrus over the Adriatic Sea, Slovenia, Croatia and Bosnia-Herzegovina, while the model forecasts almost no cloud cover. However, synoptic reports confirm a cloud-covered sky in this area, with no precipitation reported.
|
|
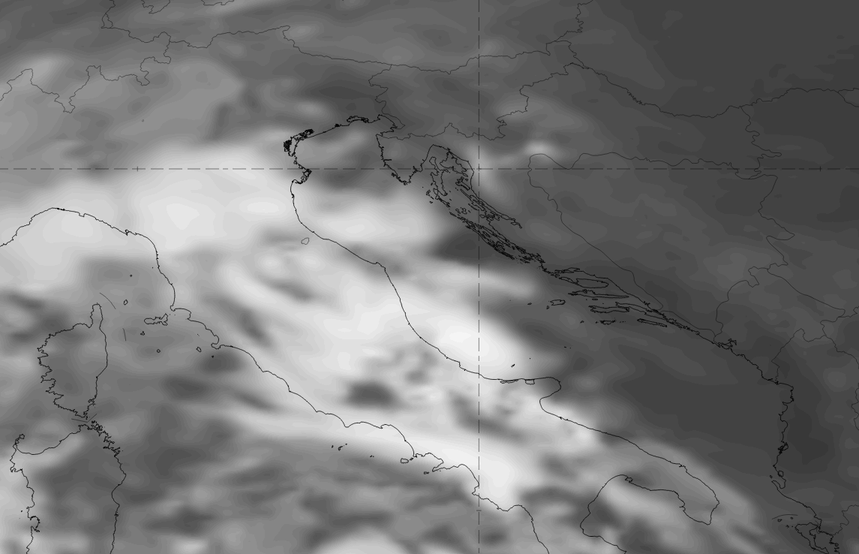
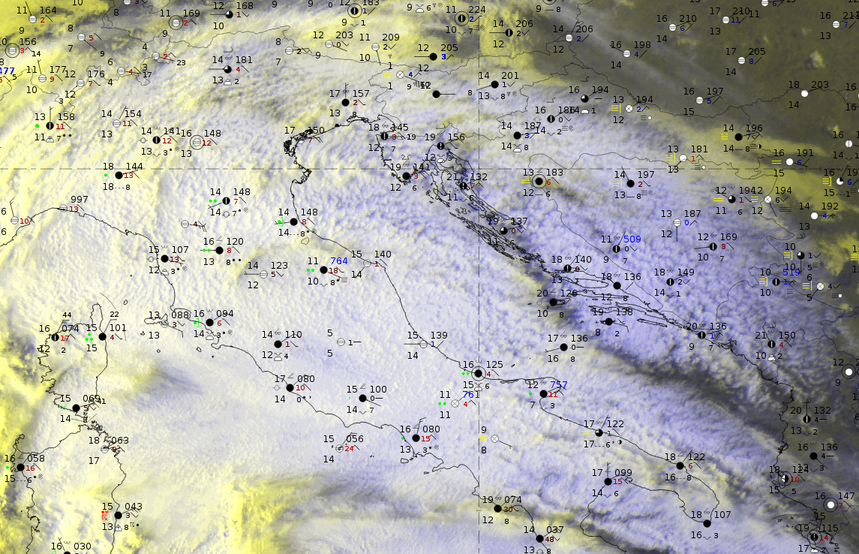
Figure 4: Comparison of a simulated IR 10.8 µm image (ECMWF 6-hour forecast) with a SEVIRI HRV Clouds RGB and SYNOP data for 20 May 2023 at 06:00 UTC (move the slider to compare the two images).
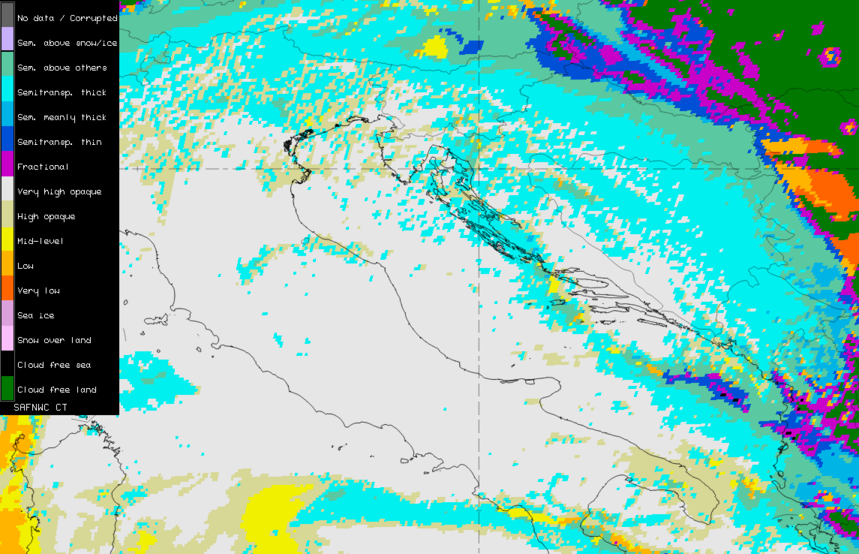
The NWC SAF Cloud Type product shows that the dusty cirrus cloud deck consists mainly of semi-transparent cirrus clouds. Over the Adriatic Sea and Italy, this layer is superimposed on thick opaque clouds from a front.
|
|
Figure 5: Comparison of the HRV Clouds RGB with the NWC SAF Cloud Type product for 20 May 2023 at 06:00 UTC (move the slider to compare the two images).
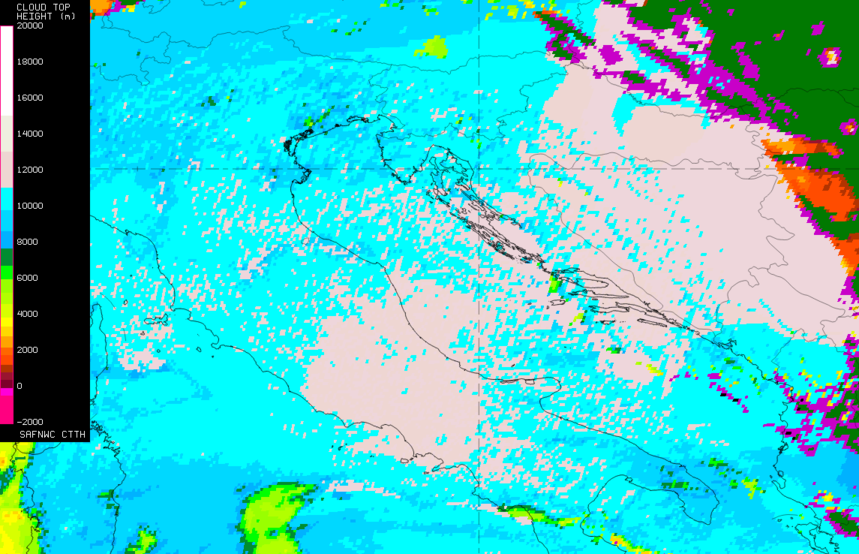
The dusty cirrus clouds are located above the frontal cloud shield at heights between 10 and 12 km.
|
|

Figure 6: Comparison of the HRV Clouds RGB with the NWC SAF Cloud Top Height product for 20 May 2023 at 06:00 UTC (move the slider to compare the two images).
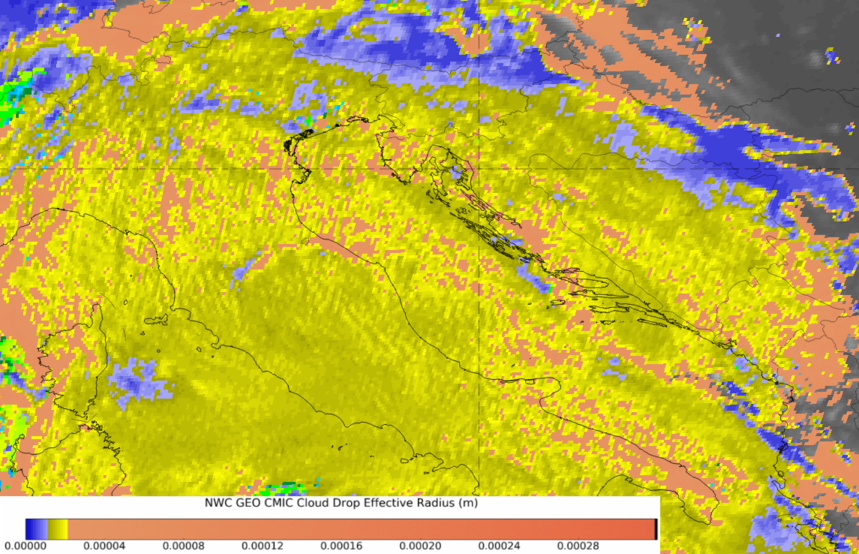
Ice crystals in the dusty cirrus layer have sizes of 10-20 µm according to the Cloud Effective Radius product of NWC SAF.
|
|
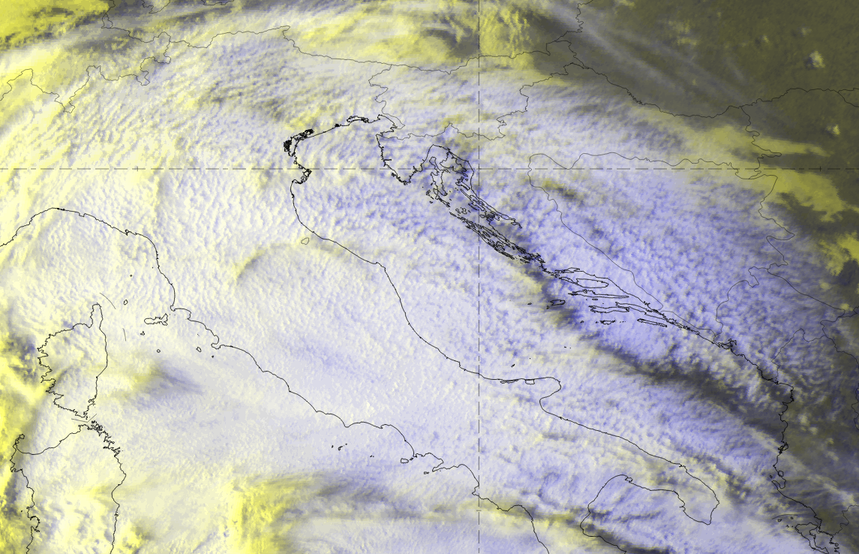
Figure 7: Comparison of the HRV Clouds RGB with the NWC SAF Cloud Effective Radius product for 20 May 2023 at 06:00 UTC (move the slider to compare the two images).

Note: to enter a gallery with the Figures 4 − 7 click here.
References
Caffrey, P. F., Fromm, M. D., and Kablick III, G. P.: WRF-Chem simulation of an East Asian dust-infused baroclinic storm (DIBS), J. Geophys. Res., 123, 6880-6895, https://doi.org/10.1029/2017JD027848, 2018.
Dayan, U., Heffter, J., Miller, J. and Gutman, G.: Dust Intrusion Events into the Mediterranean Basin, J.A.M., August 1991, pp. 1185, 1199.
Fromm, M., Kablick III, G., and Caffrey, P.: Dust-infused baroclinic cyclone storm clouds: The evidence, meteorology, and some implications, Geophys. Res. Lett., 43, 12,643-12,650, https://doi.org/10.1002/2016GL071801, 2016.
Kollath, K.: Cellular convection in cirrus clouds as a possible effect of dust aerosols, EUMETSAT, Cellular convection in cirrus clouds | EUMETSAT, last access: 26 July 2023, see also report available at https://www.eumetsat.int/media/46886, 2010.
Moreira, N., Rio, J., Lopes, M. J.,, Lopes, N., Leitão, P., Sousa, P. and Narciso, P.: Dust episode 15-17th March 2022, Brief analysis of the impact on NWP weather forecasts for Portugal, Report DivMV/2023/01, 22 February 2023
Nagy, A.: Investigating weather situations which bring Saharan dust over Hungary based on MSG satellite images, Master's thesis, ELTE University, Budapest (in Hungarian), 2009.
Saharastaub im März 2022, press release DWD, 18 March 2022, Wetter und Klima - Deutscher Wetterdienst - Presse - Saharastaub im März 2022 (dwd.de), last access: 9 August 2023.
Seifert, A., Bachmann, V., Filipitsch, F., Förstner, J., Grams, C. M., Hoshyaripour, G. A., Quinting, J., Rohde, A., Vogel, H., Wagner, A., and Vogel, B.: Aerosol-cloud-radiation interaction during Saharan dust episodes: the dusty cirrus puzzle, Atmos. Chem. Phys., 23, 6409-6430, https://doi.org/10.5194/acp-23-6409-2023, 2023.
EUMETSAT Case Studies:
Dusty Dry Conveyor Belt by Ivan Smiljanic, 2020; Dusty Dry Conveyor Belt | EUMETSAT
Dusty Cirrus over Romania, 2011, Dusty cirrus over Romania | EUMETSAT
Saharan Dust causes Temperature Drop, 2016, by Jochen Kerkmann, HansPeter Roesli, Mike Fromm and Klaus Sievers; Saharan dust causes temperature drop | EUMETSAT
Widespread Dust Intrusion over Europe, 2022, by Federico Fierli, Miguel-Angel Martinez, Jörg Asmus and Hans Peter Roesli; Widespread dust intrusion across Europe | EUMETSAT
Extensive DIBS in the Deformation Zone, 2020, by HansPeter Roesli (Switzerland), Mária Putsay and Ivan Smiljanic; Extensive DIBS in the Deformation Zone | EUMETSAT
Springtime Dust Outbreaks, 2022, by Djordje Gencic and Ivan Smiljanic, Federico Fierli and Miguel-Angel Martinez; Springtime dust outbreaks | EUMETSAT