Meteorological Physical Background
Baroclinicity, in general, is defined as the state of the atmosphere in which surfaces of constant pressure are intersected by surfaces of constant temperature or constant density. The number, per unit area, of isobaric - isosteric solenoids intersecting a given surface is then a measure of the baroclinicity. High baroclinicity shows up as a high gradient of density or temperature which usually accompanies a change of air mass. Consequently a Baroclinic Boundary is - like a front - in principal a boundary between two different air masses. High gradients of ThetaE and equivalent thickness are parameters which indicate baroclinicity. Baroclinic Boundaries show no significant propagation and their position within the synoptic system is different from a classic front.
From the classic front theory a flow from the warm side associated with a ridge of height contours and a cold flow from the rear side of a trough result in significant confluence within the area of the Baroclinic Boundary. Both are indicated by the wind fields and the relative streams.
The dominating physical process from the colder side - the trough side - will be a relative stream at low and middle levels (see schematic below). At upper levels the Warm Conveyor Belt is dominating, which originates within the ridge (or warm side). Elongation and deformation are also well reflected in the wind fields.
In general, a sinking motion at low levels and rising at middle and upper levels can be observed. The advection of cold, dry air at low levels causes superadiabatic stratification above relatively warmer surfaces. Anyway, the vertical expansion of the cold air mass is less than within a CF. Both characteristics can often be seen in the vertical cross sections (see Typical appearance in vertical cross section). The difference in the vertical extension of the cold air may be connected with the difference in propagation between Cold Fronts and Baroclinic Boundaries.
The typical distribution of relative streams for a frontal system is described here. The schematic below shows the typical distribution of the relative streams of a Baroclinic Boundary. The pattern is valid for all three types of the Baroclinic Boundary.
The distribution of vertical streams is similar to a CF in CA. But the sinking of cold air at low levels seems to be contradictory considering the formation of low and middle level cloudiness within the Baroclinic Boundary. One possible explanation may be that the cloudiness forms mainly through condensation at the Boundary between warm and cold air masses, indicated by the slantwise crowding of the isentropes. The sinking at low levels and the rising at upper levels is then compensated by a distinct confluence from different height levels, which is also reflected in the wind fields and the relative streams.
The Baroclinic Boundary to the rear of a synoptic scale trough is the most frequent type and will be therefore be considered as an example in this chapter:
|
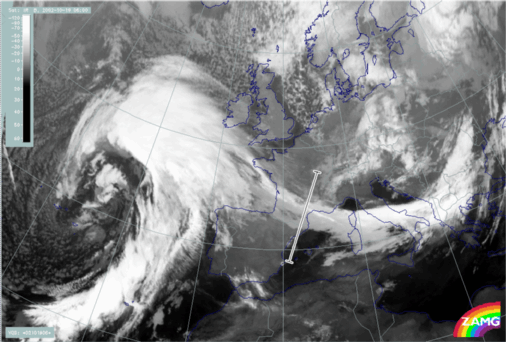
19 October 2002/06.00 UTC - Meteosat IR image; position of vertical cross section indicated
|
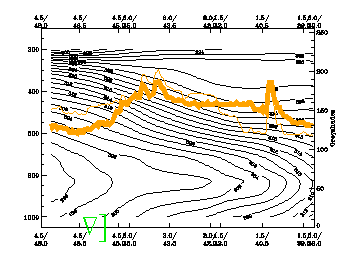
19 October 2002/06.00 UTC - Vertical cross section; black: isentropes (ThetaE), orange thin: IR pixel values, orange thick: WV pixel values
|
The left IR image above shows the first type of a Baroclinic Boundary to the rear of an upper level trough. It reaches from the Bay of Biscay to the Tyrrhenian Sea. The image displays a homogenous grey cloud band with high bright fibre clouds at the rear side, indicating a significant jet streak at the rear of the trough. The white line indicates the orientation of the vertical cross section seen in the image above right. In the cross section the superadiabatic stratification at low levels clearly appears more shallow than in a CF. The high gradient of equivalent potential temperature at mid levels indicates the baroclinic zone of the boundary between both air masses.
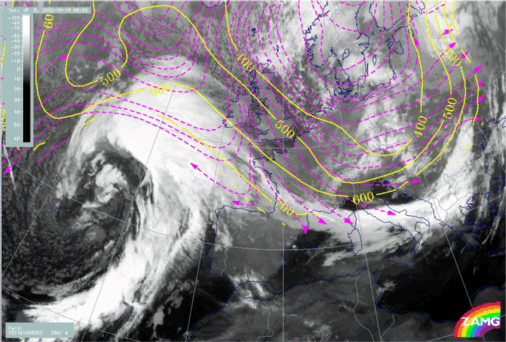
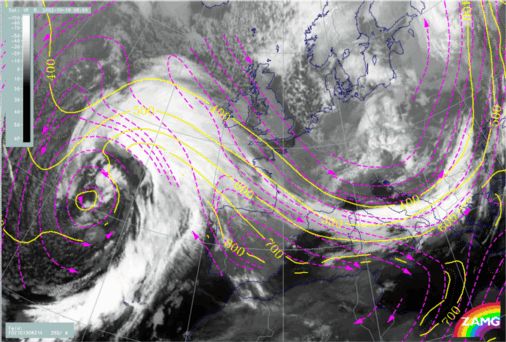
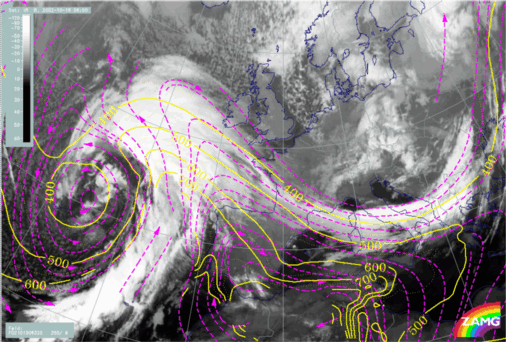
The set of images below shows the relative streams at 302K, 314K and 320K. The low levels are dominated by sinking diffluent streamlines, showing an intrusion of cold air from the trough, which leads to rather low (warm) cloud tops. At 314K the upper relative streams and the Warm Conveyor Belt result in the limiting streamline in the centre of the cloud band. Both streams are rising weakly. At 320K a rising Warm Conveyor Belt, originating from the ridge dominates the boundary.
|
19 October 2002/06.00 UTC - Meteosat IR image; magenta: relative streams 302K - system velocity: 250° 9 m/s, yellow: isobars
|
19 October 2002/06.00 UTC - Meteosat IR image; magenta: relative streams 314K - system velocity: 250° 9 m/s, yellow: isobars
|
|
19 October 2002/06.00 UTC - Meteosat IR image; magenta: relative streams 320K - system velocity: 250° 9 m/s, yellow: isobars
|
In all types of Baroclinic Boundaries the relative streams are, in general, similar to those within Cold Fronts. The most striking difference is the location of the Baroclinic Boundary, which results in an inverted orientation of the relative streams, when compared to a CF.
The crowding of isentropes is an indication of high baroclinicity, both in fronts and in the Baroclinic Boundary. Because of frontal propagation the decline of the isentropes is steep within fronts. In contrast, Baroclinic Boundaries show a more flat decline, which can also be a result of their stationarity.
