Typical Appearance In Vertical Cross Sections
Wind, relative humidity and equivalent potential temperature show a characteristic pattern in an AR's vertical cross section.
- The relative humidity is high from the ground up to around 700 hPa, sometimes a little higher, when the AR is within the warm sector and separated from the polar front.
- The equivalent potential temperature (Theta-e) shows strong gradients on both sides and above the AR. These gradients are due to the AR's high water vapor content and not because of a temperature gradient.
- The wind speeds in an AR are typically higher than in its surroundings, and local maxima are often found in them.
Two different scenarios are discussed in more detail below:
- The moisture band of the AR is separated from the polar front.
- The AR undergoes a merging process with the moisture band of the polar front.
Case 1: The moisture band of the AR is separated from the polar front
- The vertical humidity profile shows a bulge of wet air up to 700 hPa with dry air above.
- The strong horizontal Theta-e gradients are due to the abundance of water vapor inside the AR.
|
|
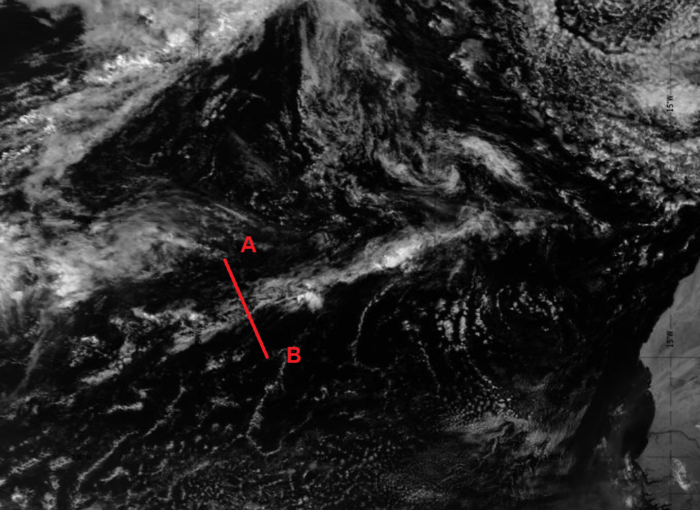
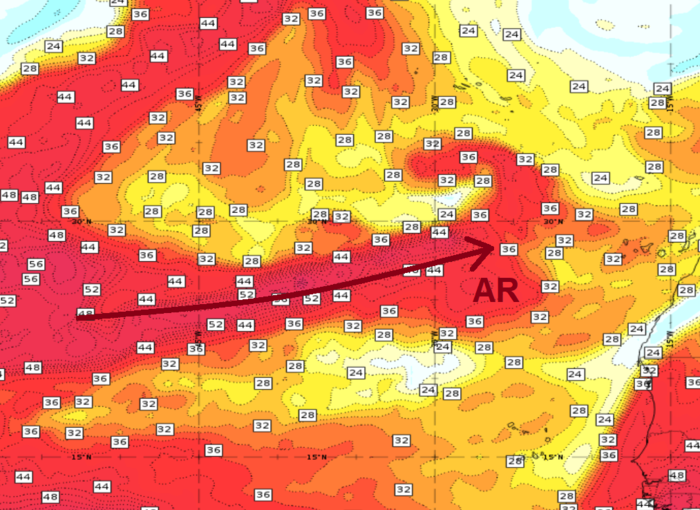
Figure 26: Total Column Water (ECMWF) and SEVIRI VIS 0.8 µm image from 9 June 2024 at 12:00 UTC. The red line idnicates the position of the vertical cross section and brown arrow indicates the AR. Use the slider to compare both images.
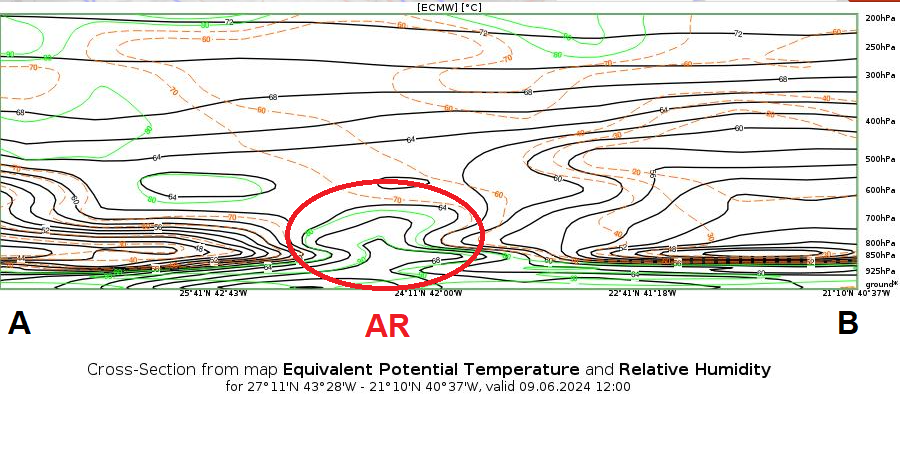
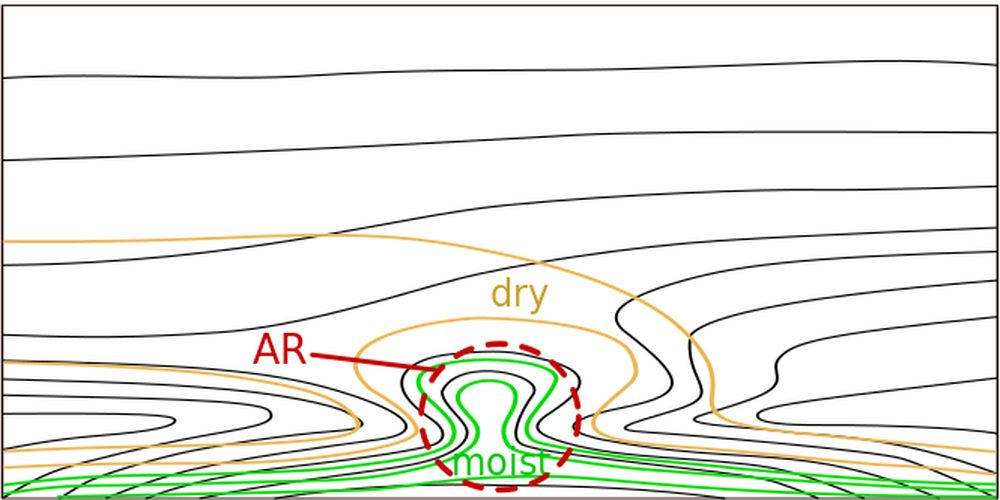
Figure 27: Vertical cross section through an isolated AR. Equivalent potential temperature [K] (black) and relative humidity [%] (green and brown) from 9 June 2024 at 12:00 UTC (left) and as a schematic (right).
- The vertical cross section below shows a local wind speed maximum in the area of the AR.
|
|
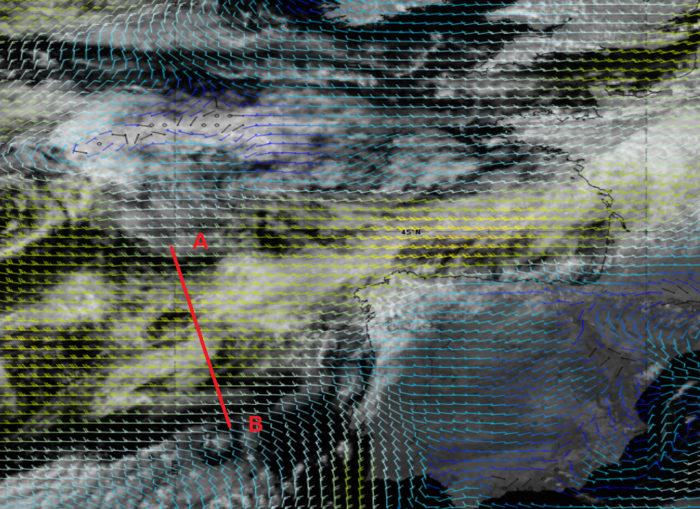
Figure 28: Total Column Water (ECMWF) and SEVIRI VIS 0.8 µm images with wind barbs at 950 hPa on 16 June 2024 at 12:00 UTC. The red line indicates the position of the vertical cross section and brown arrow indicates the AR. Use the slider to compare both images.
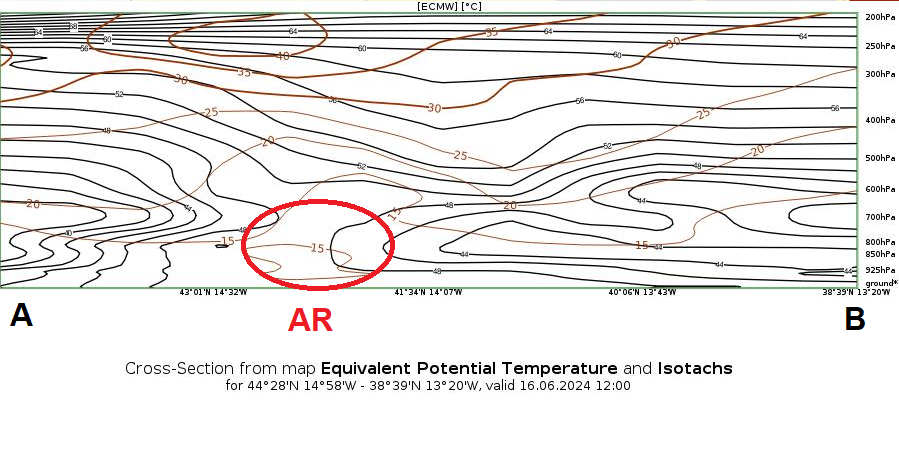
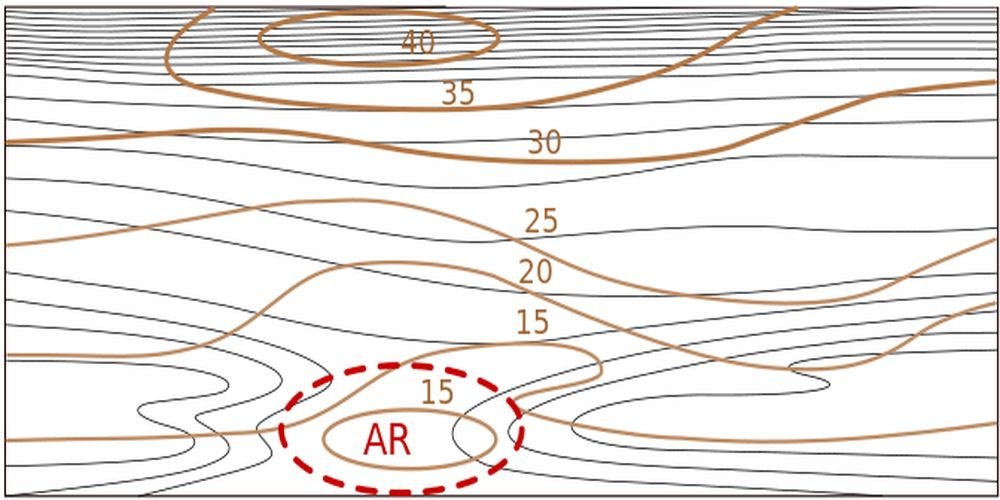
Figure 29: Vertical cross section through an isolated AR. Equivalent potential temperature [K] (black) and isotachs [m/s] (brown) from 16 June 2024 at 12:00 UTC (left) and as a schematic (right).
Case 2: The AR undergoes a merging process with the moisture band of the polar front
The case below shows an AR in the process of merging with the moisture band of a cold front. During this process, the AR continuously approaches the cold front from the warm side until both moisture bands merge. To illustrate this process, it is subdivided into two steps.
In the first step, the vertical cross section (i) shows the AR south of the merging point, still separated from the cold front. In the second step the VCS (ii) is positioned more to the north and shows the AR already merged with the pre-frontal moisture band of the katabatic cold front.
i. VCS located south of the merging point
- The low-level moisture field of the AR is separated from the moisture field of the cold front.
- The air above the AR is dry.
- A secondary low-level wind speed maximum can be observed as well.
|
|
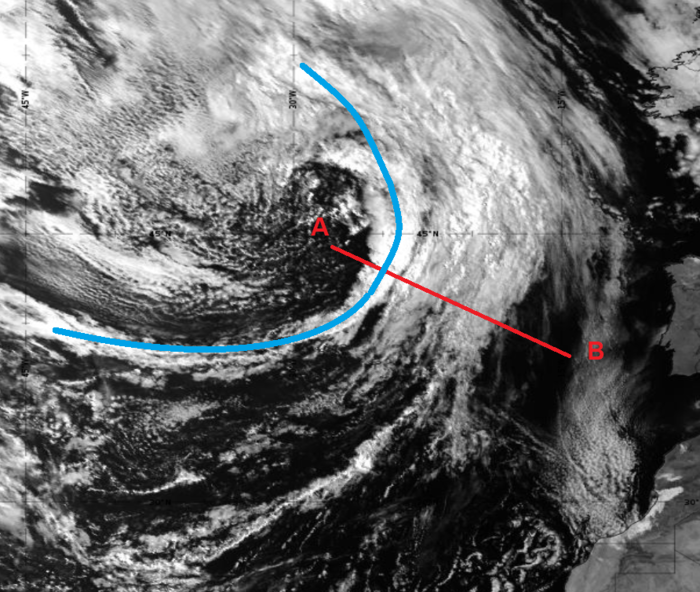
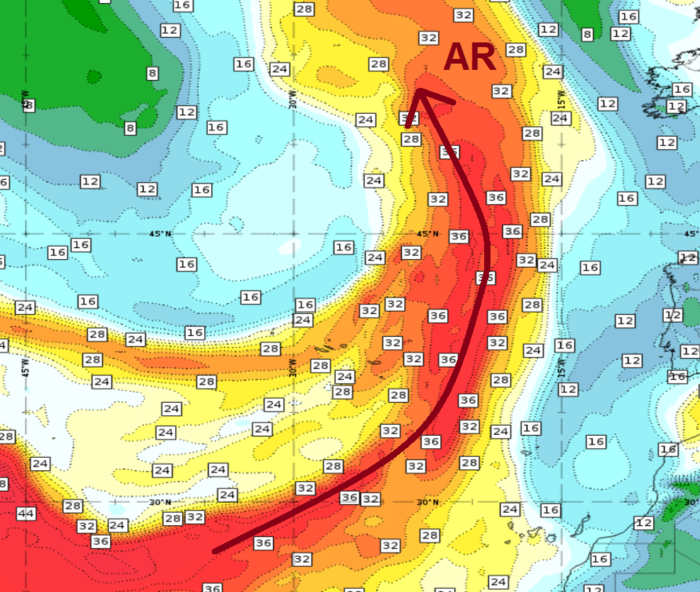
Figure 30: SEVIRI VIS 0.8 µm and Total Column Water (ECMWF) images from 24 May 2024 at 09:00 UTC. The red line is the vertical cross section, the blue line marks the cold front and the brown arrow indicates the AR. Use the slider to compare both images.
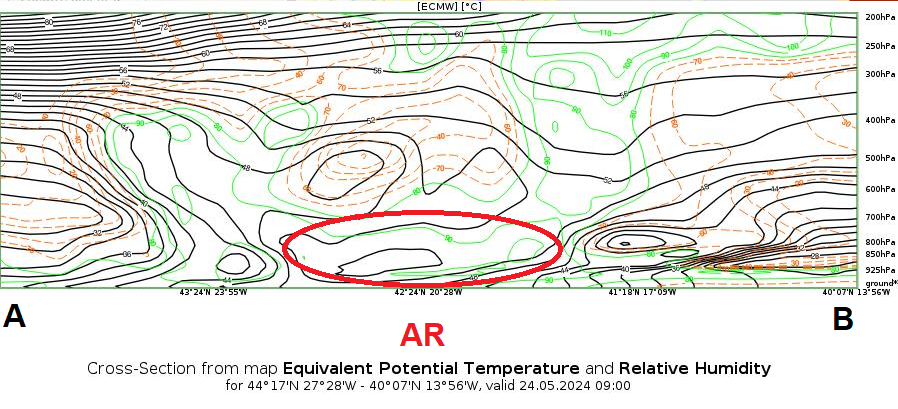
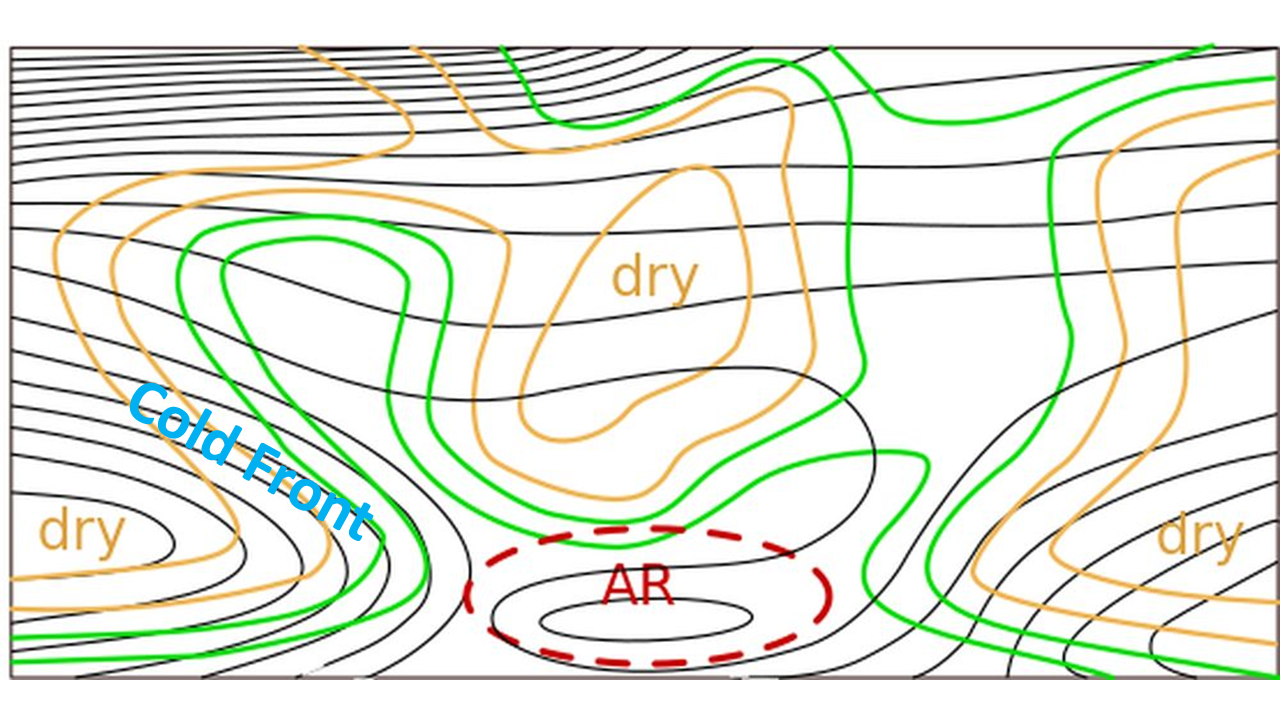
Figure 31: Vertical cross section through an isolated AR. Equivalent potential temperature [K] (black) and relative humidity [%] (green and brown) from 24 May 2024 at 09:00 UTC (left) and as a schematic (right).
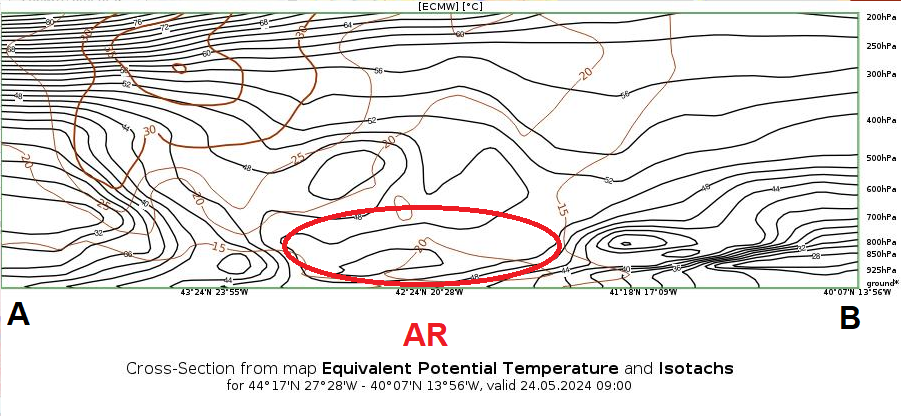
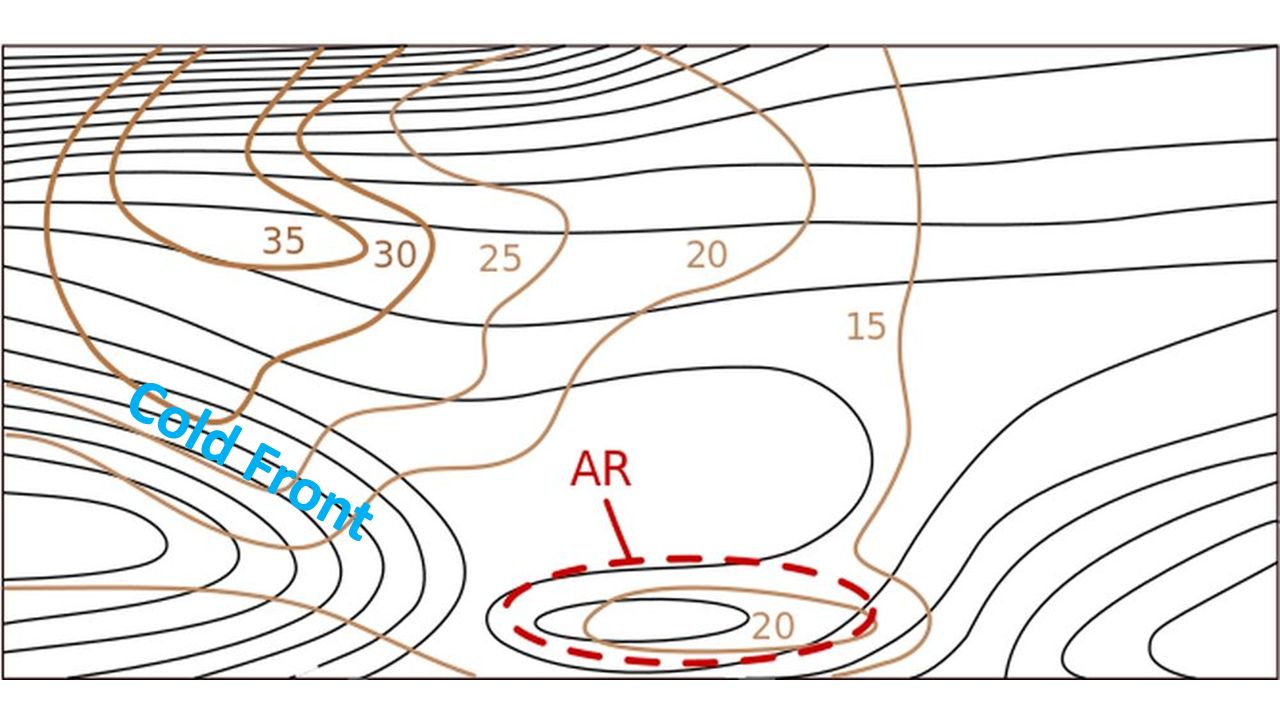
Figure 32: Vertical cross section through an isolated AR. Equivalent potential temperature [K] (black) and isotachs [m/s] (brown) from 24 May 2024 at 09:00 UTC (left) and as a schematic (right).
ii. VSC located north of the merging point
- After merging with the polar front, pre-frontal humidity reaches from the surface up to the vertical limit of the cold front.
- The low-level jet associated with the AR is still prominent.
|
|
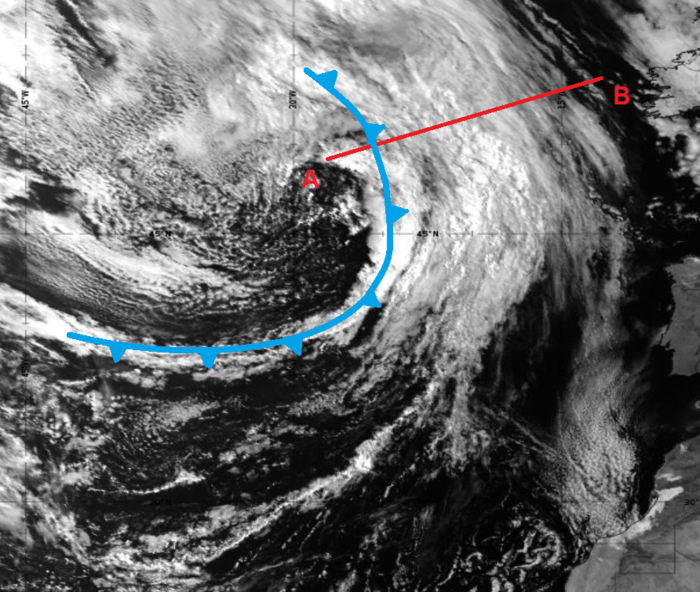
Figure 33: SEVIRI VIS 0.8 µm and Total Column Water (ECMWF) images from 24 May 2024 at 09:00 UTC. The red line is the vertical cross section, the blue line marks the cold front and the brown arrow indicates the AR. Use the slider to compare both images.
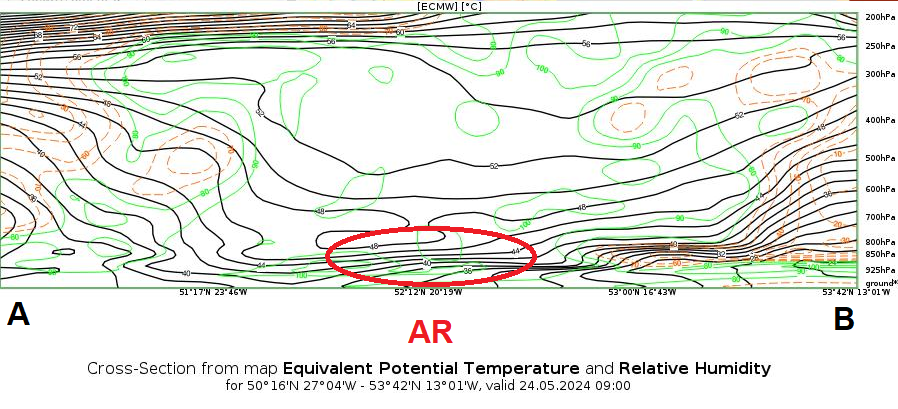
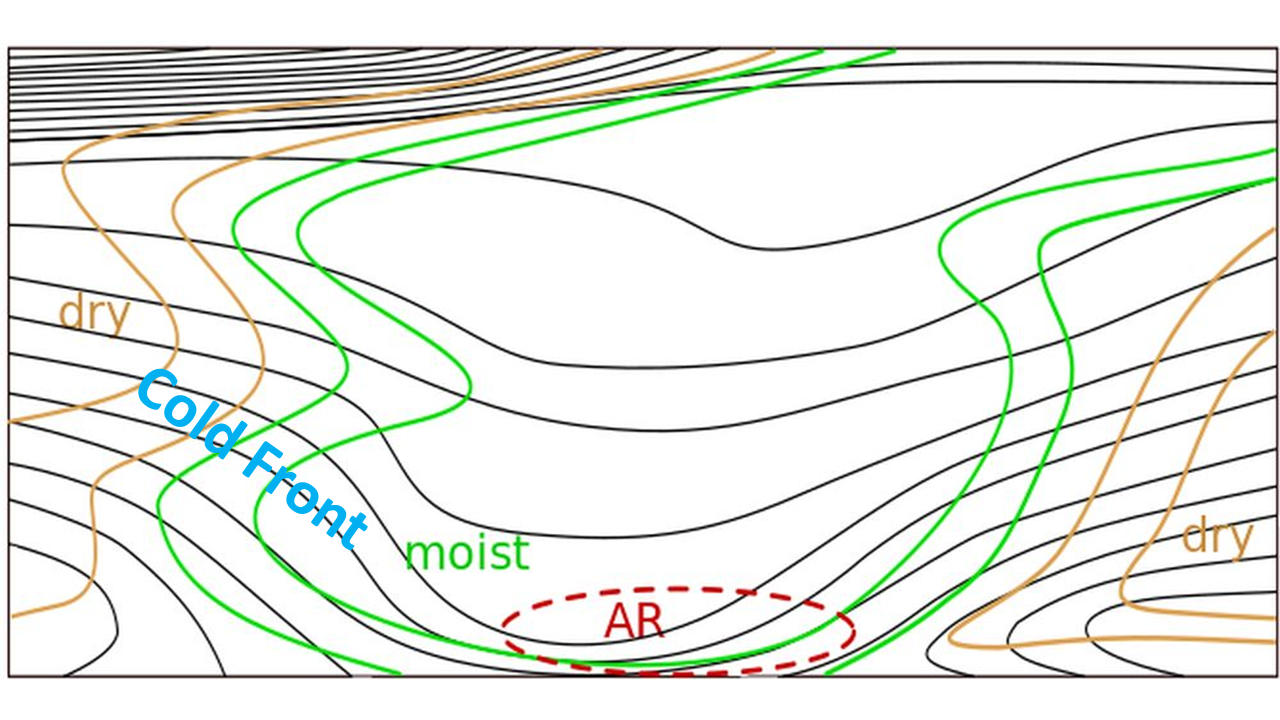
Figure 34: Vertical cross section through an isolated AR. Equivalent potential temperature [K] (black) and relative humidity [%] (green and brown) from 24 May 2024 at 09:00 UTC (left) and as a schematic (right).
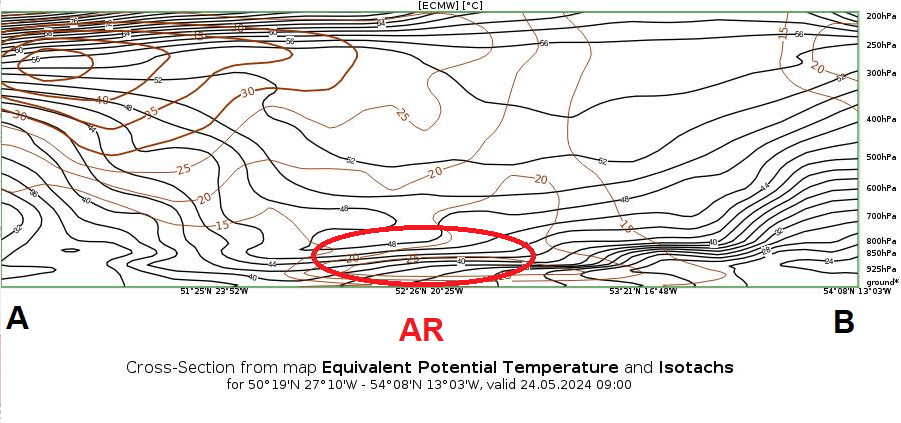
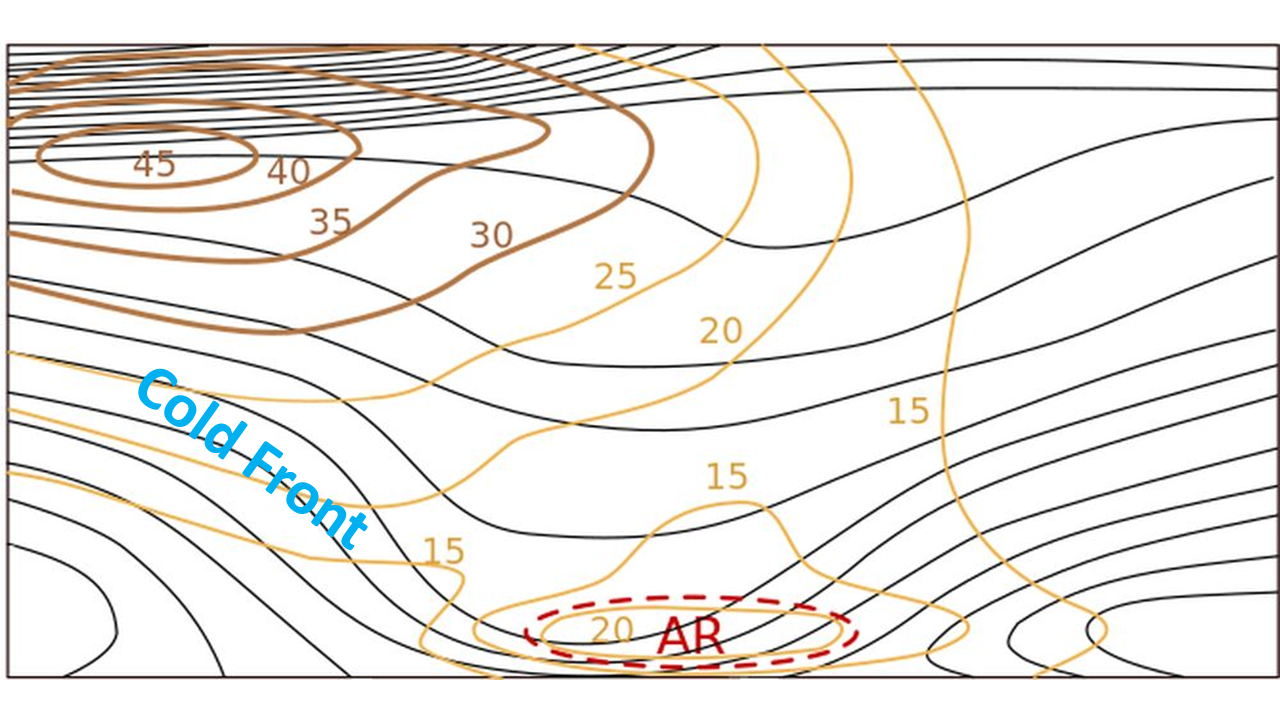
Figure 335: Vertical cross section through an isolated AR. Equivalent potential temperature [K] (black) and isotachs [m/s] (brown) from 24 May 2024 at 09:00 UTC (left) and as a schematic (right).