Key Parameters
The key parameters of an Atmospheric River (AR) refer are:
A. The position relative to fronts
B. The moisture content
C. The associated wind field
A. The position of Atmospheric Rivers relative to fronts
Equivalent Potential Temperature
- ARs occur in warm and moist air masses, typically in the warm sector of a frontal system but also in the warm air south of the polar front.
|
|
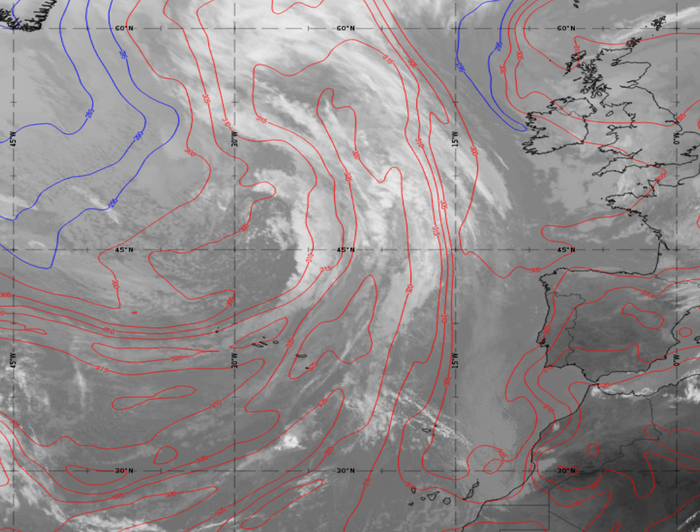
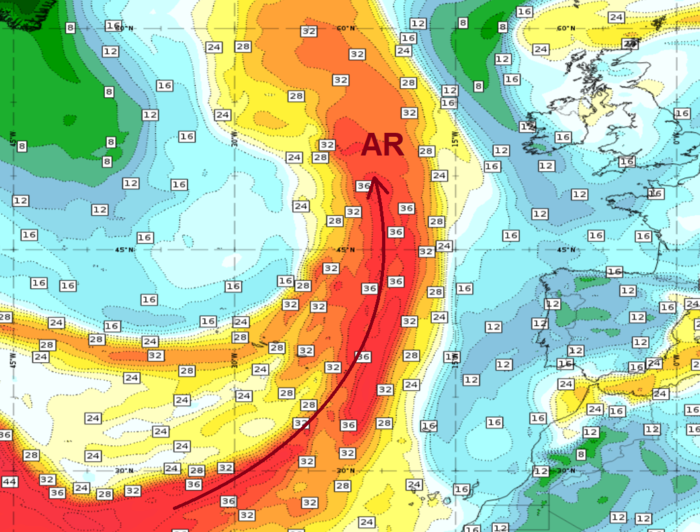
Figure 15: SEVIRI IR
10.8 µm image with Theta-e at 850 hPa and Total Column Water (ECMWF) from
24 May 2024 at 09:00 UTC.
Use the slider to
compare both images.
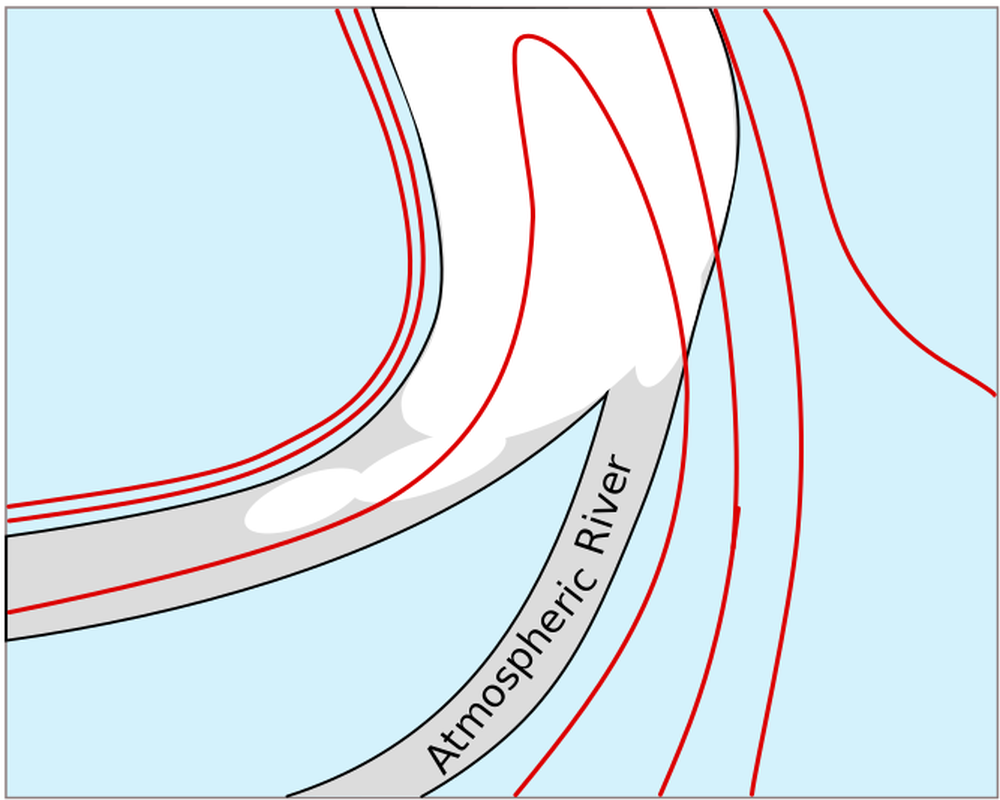
Figure 16: Schematic of the Equivalent Potential Temperature at 950 hPa in respect to the position of the AR.
Atmospheric Thickness 500 - 1000 hPa
- The ARs are located in the ridge of the atmospheric thickness parameter.
- When the AR converges with the polar front, they are found near the gradient zone of the thickness parameter – still on the warm side.
|
|
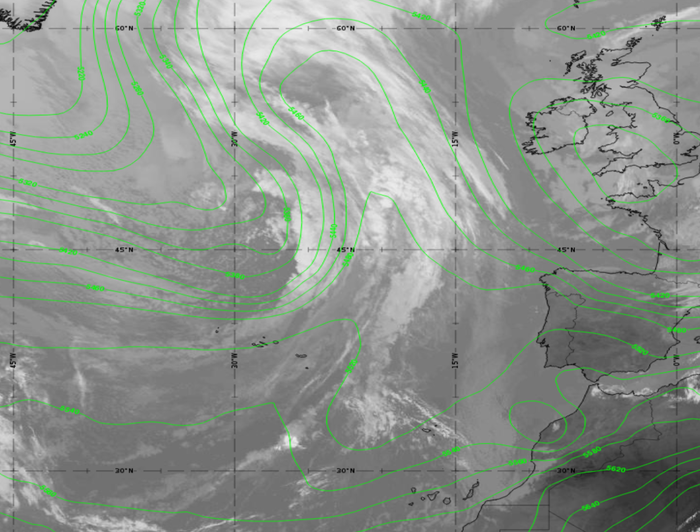
Figure 17: SEVIRI IR
10.8µm image with thickness 500-1000 hPa and Total Column Water (ECMWF)
from 24 May 2024 at 09:00 UTC.
Use the
slider to compare both images.
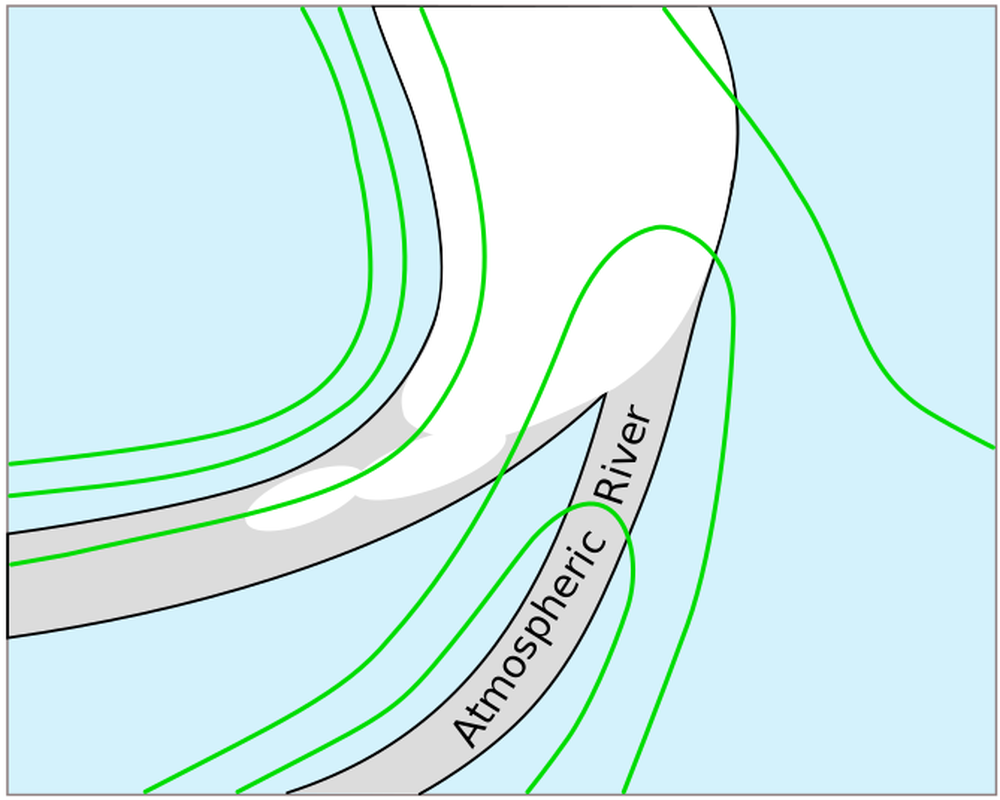
Figure 18: Schematic of the Atmospheric Thickness parameter (500-1000hPa) in respect to the position of the AR.
B. Moisture content in Atmospheric Rivers
Relative humidity and Total Column Water
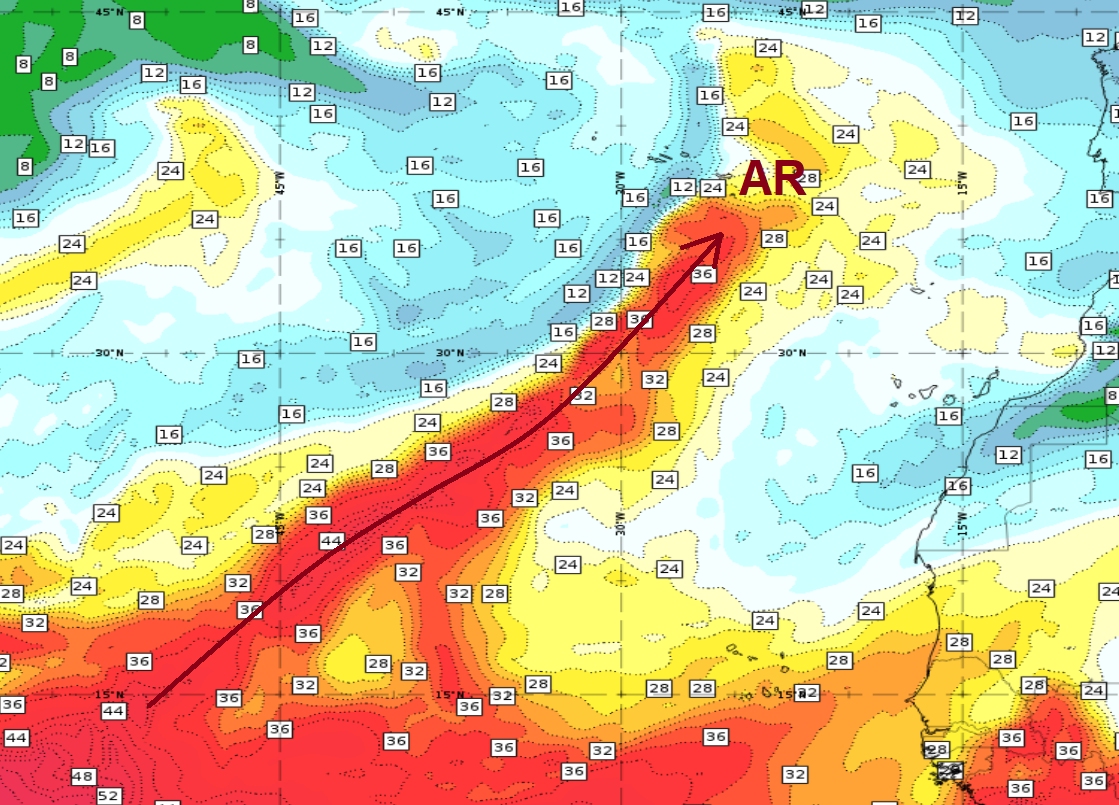
Figure 19: Total Column Water (ECMWF) on 1 April 2024 at 12:00 UTC.
- ARs are characterized by high relative humidity values in the lower troposphere, typically up to around 700 hPa and by total column water values of more than 20 mm.
- Their initial moisture supply comes from a maritime tropical air mass.
- The atmosphere above the AR (typically higher than 700 hPa) is dry.
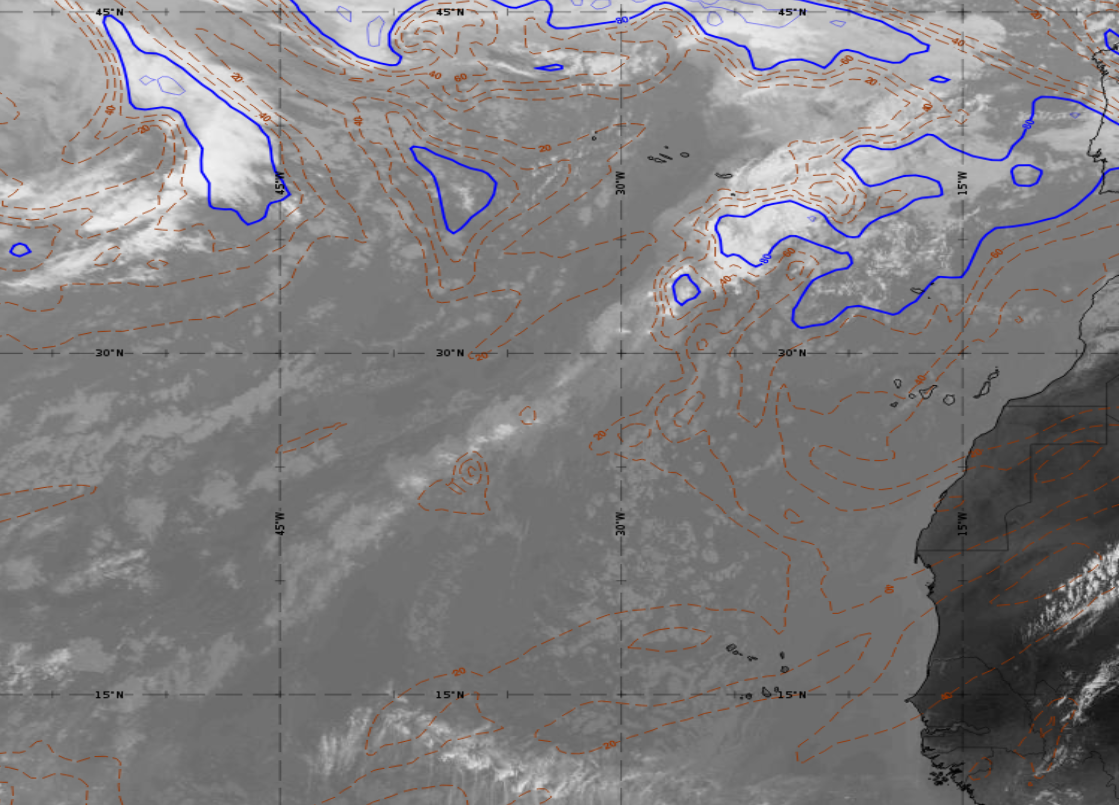


Figure 20: Relative humidity (ECMWF) at 500 (top), 700
(middle) and 850 hPa (bottom) superimposed on SEVIRI
IR10.8 µm image from 1 April 2024 at 12:00 UTC.
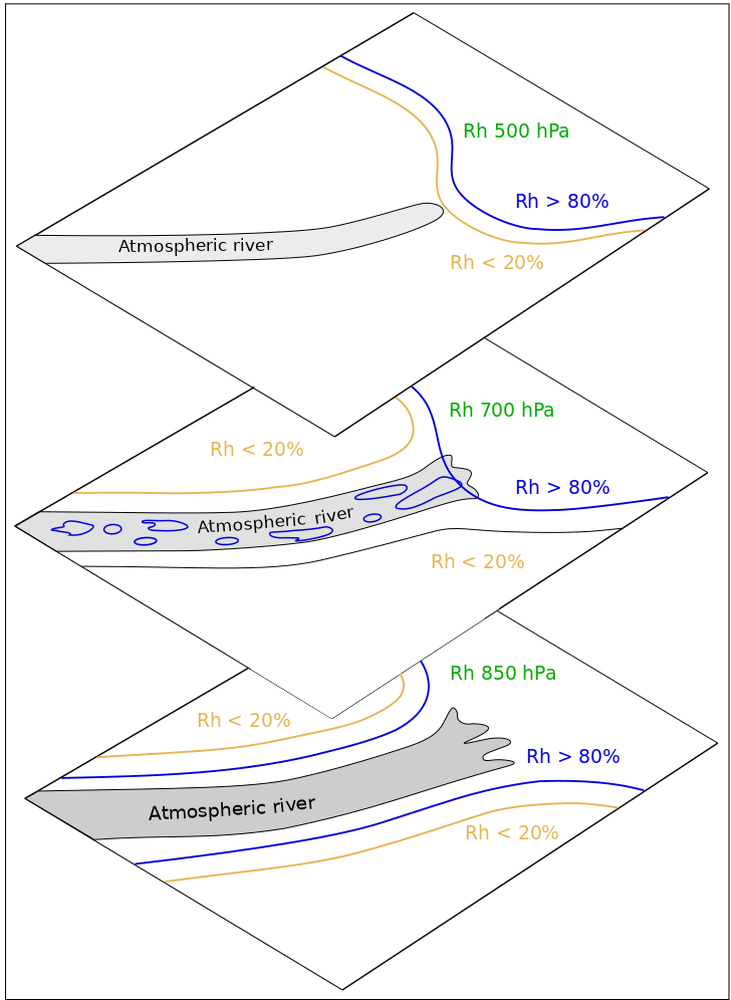
Figure 21: Schematic of relative humidity (Rh) at corresponding levels.
C. The wind field
- ARs are usually associated with stronger winds in the lower levels, the so-called low-level jets. The low-level wind field often shows a convergence along the humid belt.
|
|
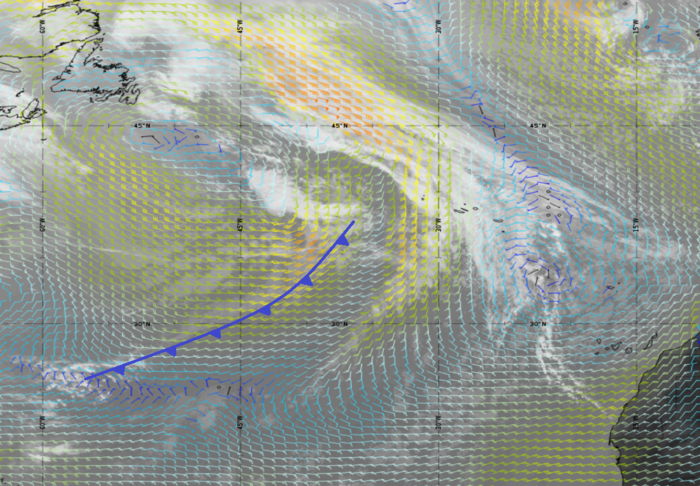
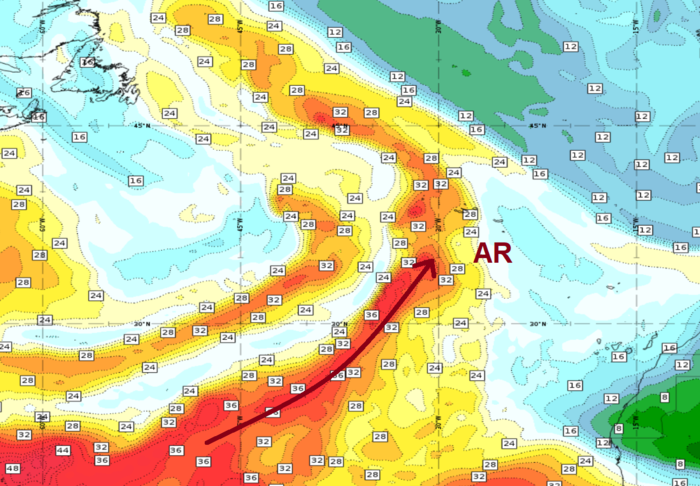
Figure 22: SEVIRI
IR 10.8 µm image with wind barbs at 950
hPa and Total Column Water (ECMWF) from 1 May 2024 at 18:00 UTC.
The
blue line indicates the cold front and brown arrow indicates the AR. Use the slider to
compare both images.
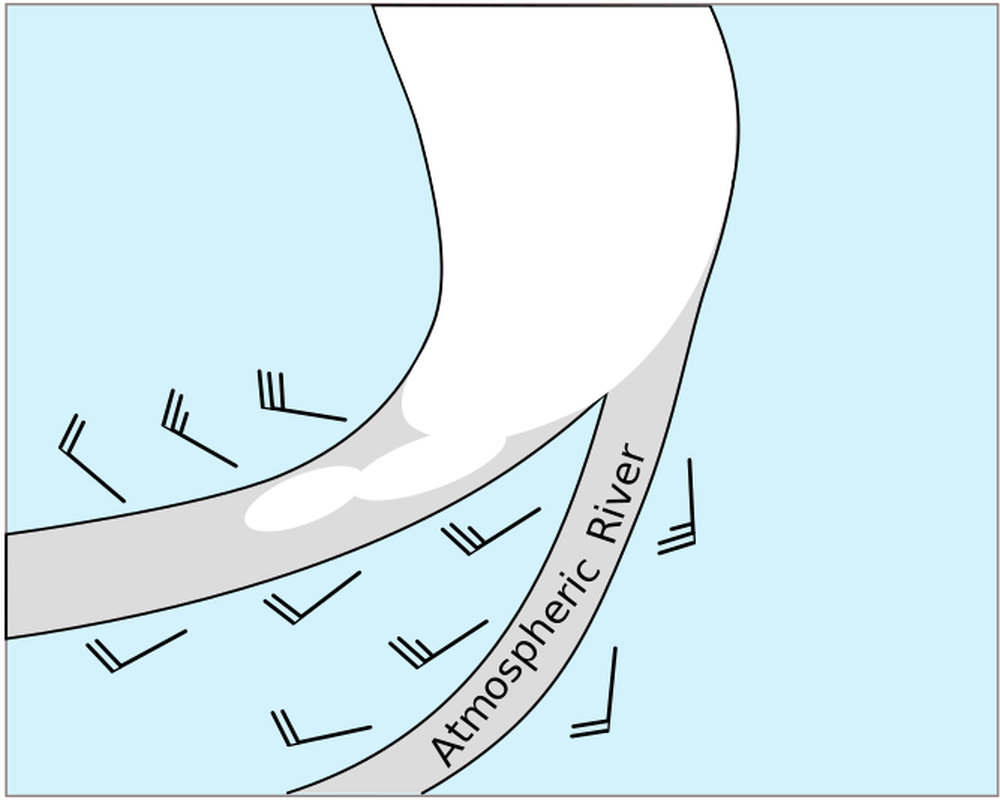
Figure 23: Schematic of surface wind convergence in the vicinity of an AR.
|
|
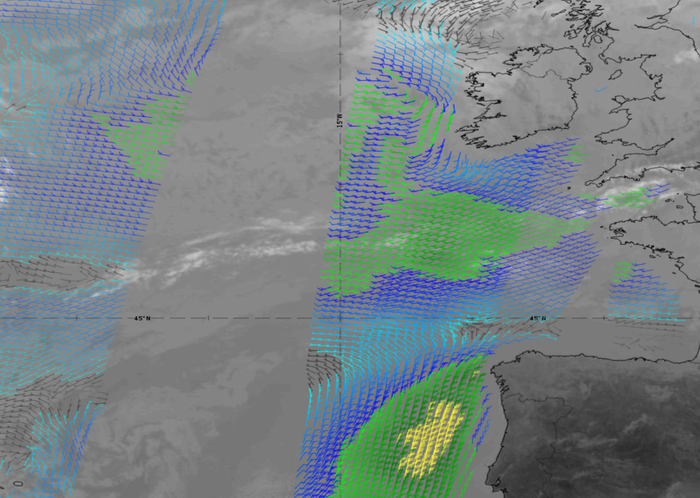
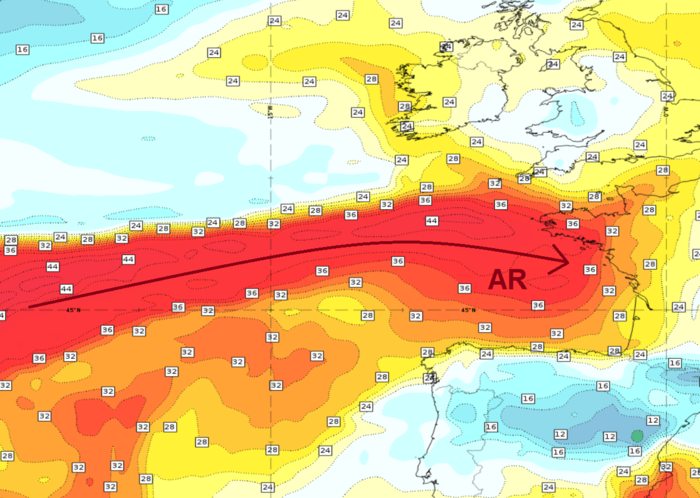
Figure 24: SEVIRI IR
10.8 µm image with ASCAT-B and ASCAT-C 10m
wind barbs and Total Column Water (ECMWF) from 22 July 2024 at 12:00 UTC.
The
brown arrow indicates the AR. Use the slider to
compare both images.
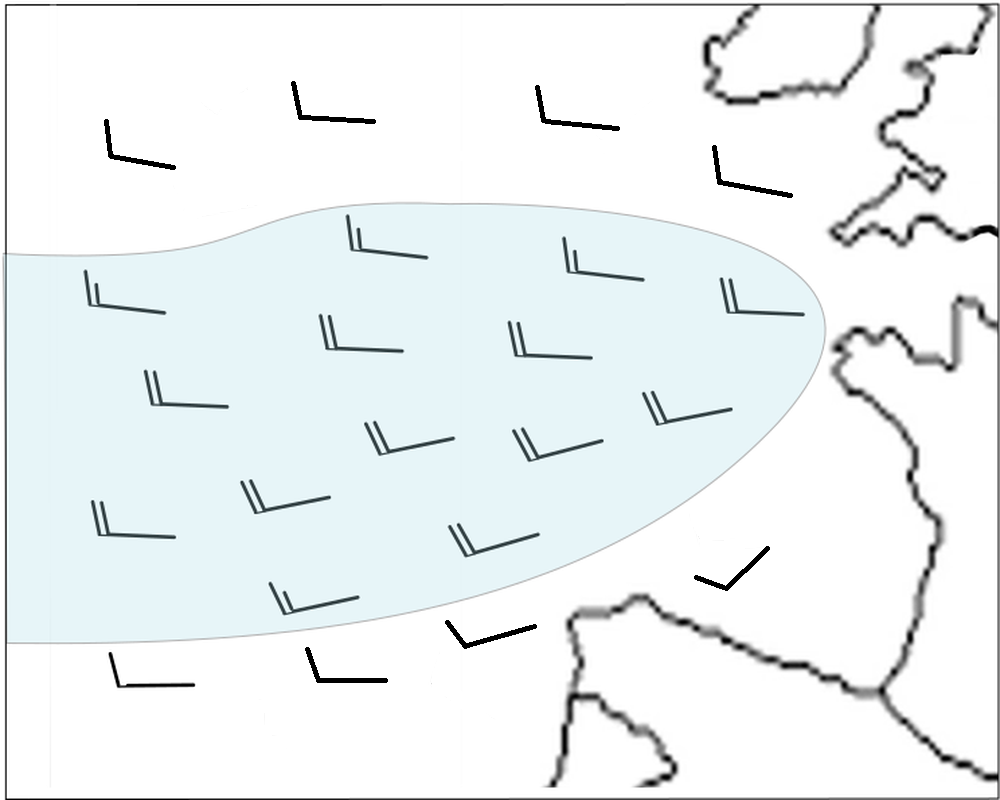
Figure 25: Schematic of 10m wind barbs over the ocean, inside (blue) and outside an AR.