Cloud Structure In Satellite Images
The best method for detecting Atmospheric Rivers (AR) over the oceans is to identify narrow stripes of high total column water vapor in the microwave spectral bands of polar-orbiting (LEO) satellite sensors. Satellite products showing the latest overpasses of LEO microwave sensors, such as the NDE blended Total Precipitable Water product, are the first choice when looking for ARs. Once ARs pass over land, their band-like structure rapidly dissolves due to surface friction and/or lifting.
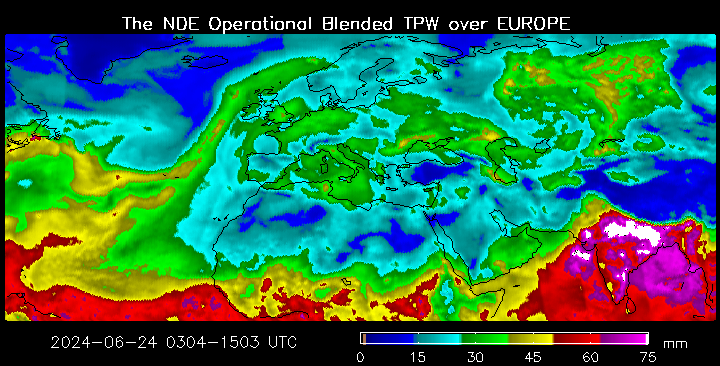
Figure 1: The NDE blended Total Precipitable Water (TPW) product is derived from polar-orbiting and geostationary satellite sensors including AMSU/MHS, SSMIS, ATMS and GPS Met. © NOAA NESDIS.
ARs are often accompanied by low clouds. For GEO satellites, ARs are best seen in visible imagery due to the higher contrast between low clouds and water compared to thermal imagery. Water vapor absorption channels from current geostationary satellites do not show these low-level moisture bands as the humidity is located at altitudes not covered by the SEVIRI instrument – typically below 700 hPa. Convective activity is rarely observed as the ARs are stably stratified.
|
|
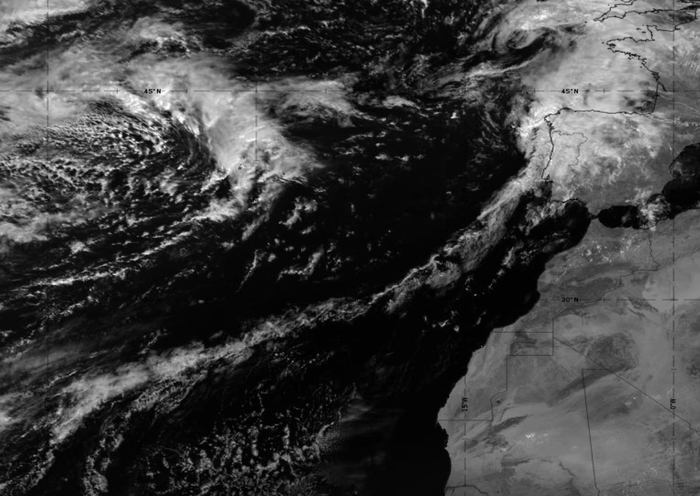
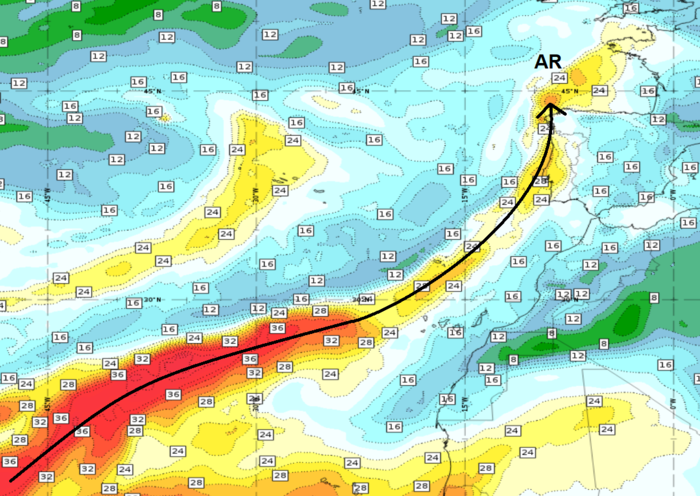
Figure 2: SEVIRI 0.8 µm VIS image from 2 April 2024 at 12:00 UTC. A narrow cloud band indicates the position of the AR over the Atlantic. Compare with the Total Column Water (TCW) product from ECMWF by using the slider.
|
|
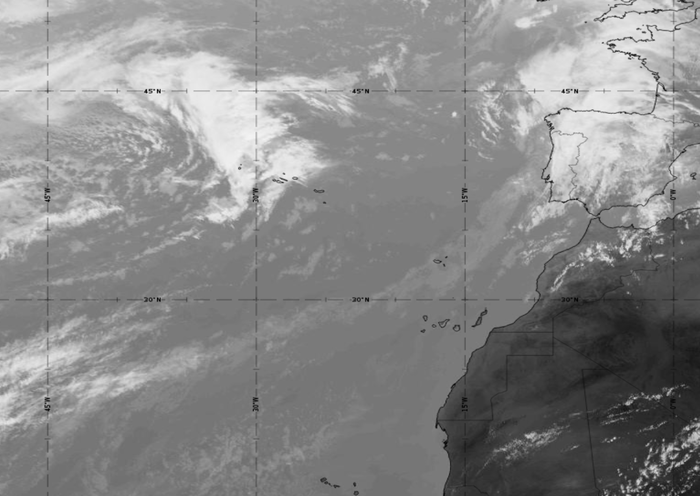
Figure 3: SEVIRI 10.8 µm IR image from 2 April 2024 at 12:00 UTC. A band of low clouds marks the AR located over the Atlantic. Compare with the TCW product from ECMWF by using the slider.
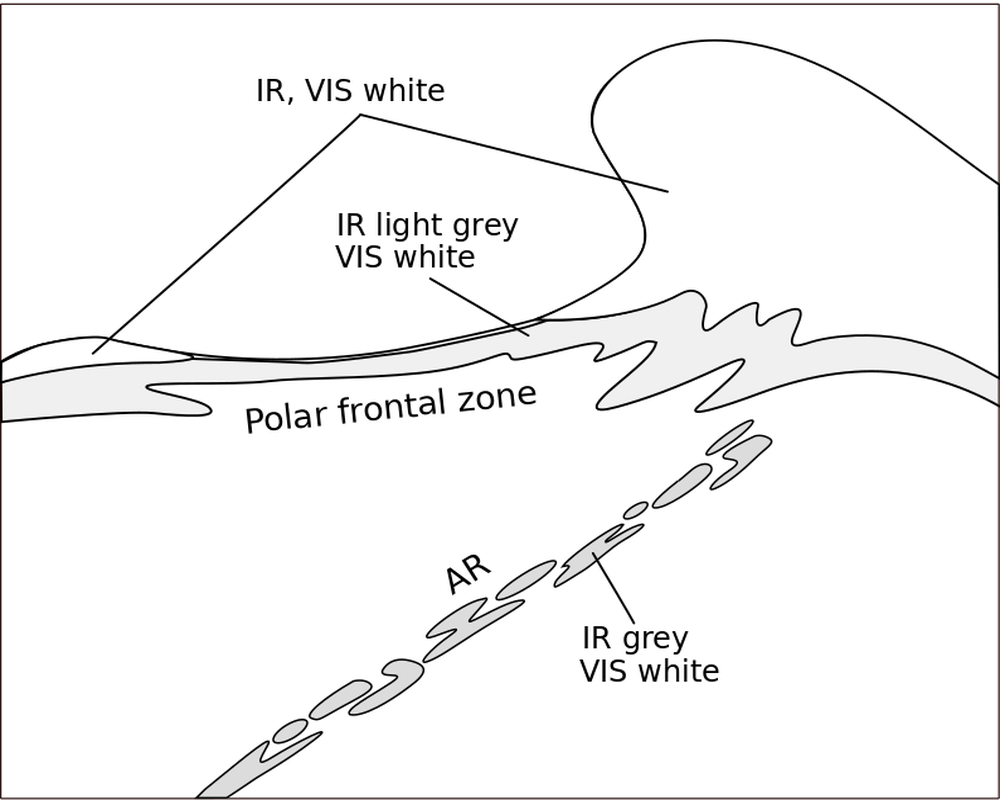
Figure 4: Schematic representing a frontal system and an AR in the grey shades used in VIS and IR.
The 24 hours Microphysics RGB is able to discern areas of higher and lower moisture in the lower troposphere using thermal infrared channels. High moisture values, which are found in ARs, are depicted in darker blue colors, while regions with less humidity tend toward a more pinkish color.
|
|
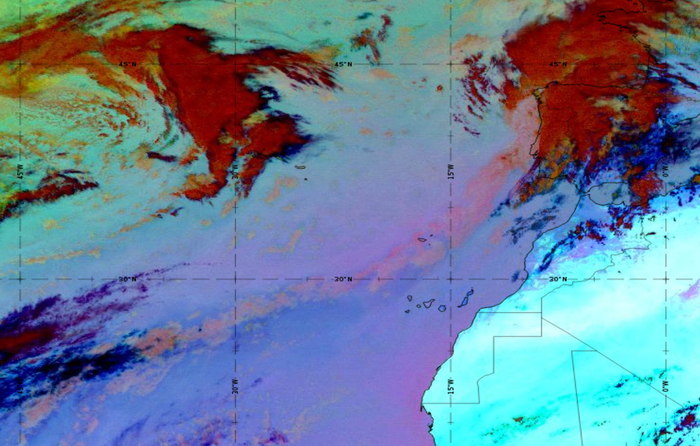

Figure 5: The 24 hour Microphysics RGB from 2 April 2024 at 12:00 UTC. Black lines indicate the low-level moisture boundaries. Use the slider to compare both images.
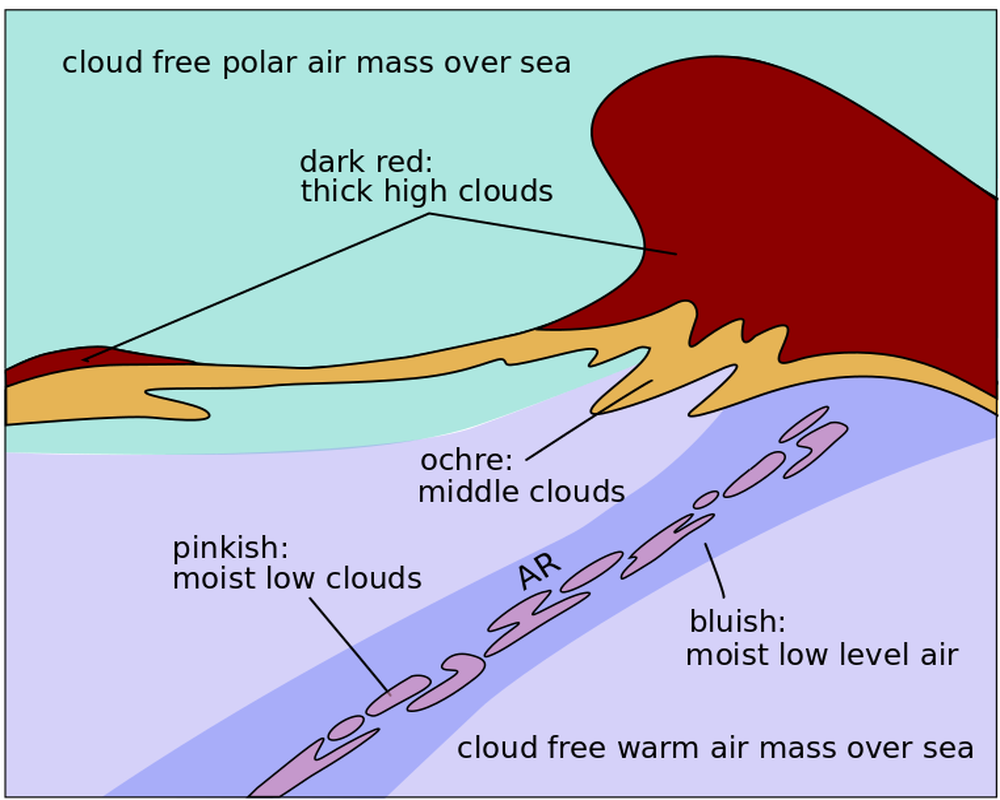
Figure 6: Schematic representing the color shades of an AR next to a frontal system in the 24 hour Microphysics RGB