Key Parameters
Mean Sea Level Pressure
| This variable is important for identifying and tracking the cyclones. During the pre-cyclogenesis stage, there is an elongated, relatively low mean sea-level pressure area over Paraguay, southern Brazil and Uruguay. However, the actual genesis of the cyclone normally occurs over Uruguay or over the ocean (near the eastern coast of South America). During its development, the cyclone moves southeastwards and reaches maturity (occlusion phase). The decay occurs near 55°S and 35°W. |
300 hPa Geopotential Height
| A trough or a cut-off low which is displaced from the Pacific to the Atlantic Ocean contributes to the genesis of the cyclone near the eastern coast of South America. This cyclogenesis occurs downstream of the trough axis, either over a pre-existing baroclinic zone or due to the orographic effect (lee cyclogenesis) when a low level jet is present. |
850 hPa Temperature
| This parameter allows us to monitor the horizontal temperature gradients around the cyclone, during its evolution. During the pre-cyclogenesis and cyclogenesis stages, there is a steep horizontal temperature gradient within the cyclone region. In the cyclogenesis stage, the isotherms show a concavity similar to that in Bjerknes and Solberg's model. However, once the cyclone has matured, these isotherms begin to differ from those described by these authors: our examples show a pool of warm air in the western part of the temperature gradients. Although these thermal characteristics are even more clearly visible at 925 hPa, this level is underground in some regions, which is why we recommend using 850 hPa. |
850 hPa Temperature Advection
| Sometimes the Andes Mountains can block the cold front and intensify the 850 hPa warm air advection (WA) from the Amazon region to the eastern side of the Andes. This is an important precondition for creating a lee cyclone, although an upper-level trough crossing the Andes is also required. The temperature advection field shows a very distinct wave situation: a maximum of WA within the cloud head and the relevant parts up front, and cold air advection (CA) behind. This pronounced WA/CA dipole is a sign of cyclogenesis in progress. |
300 hPa Relative Vorticity Advection
| At higher levels, maximum vorticity advection (NVA minimum) can be observed downstream of the trough axis, mostly situated within the cloud head. This advection of cyclonic vorticity at higher levels enhances ascent in the column. Maximum vorticity advection can also be found at the righthand exit of the jet streak within the main jet stream. This region shows a divergent upper pattern, which is also associated with ascent in the column. |
Potential Vorticity (PV) at 300 hPa
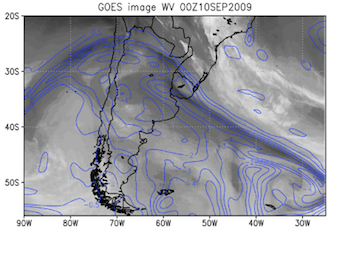
| The PV is negative in the Southern Hemisphere. Values between -1.5 and -2 PV Units in the Southern Hemisphere are considered to be a sign of the dynamic tropopause. The PV fields show minimum negatives values along the rear cloud edge of the cold front. Large PV gradients are often associated with large brightness (temperature) gradients in water vapor imagery. |
300 hPa winds
| At higher levels, we can see a jet stream, associated with the cyclone and with cold and warm fronts. During the initial stage of the cyclone development, the jet stream can normally be seen along the rear edge of the frontal cloud band. However, if the low-level temperature gradient is not so intense, the upper-level winds will not be so intense either, and the jet stream will not be present. During the development phase, the jet stream can be observed over the point at which the cold and the warm fronts meet. Later, during the occlusion phase, the jet stream is located on the equatorial side of the cyclone and crosses the triple point, i.e., the point at which the cold, warm and occluded fronts meet.
It is important to mention that, in many cases when the upper-level jet stream is over the continent, it may join the low-level jet. These coupled jets can then potentiate the convection, causing a mesoscale convective complex (MCC) to develop. |
Mean Sea Level Pressure and 300 hPa Geopotential Height
|
07-10 September 2009. GOES-10 IR channel 4 image. Mean sea level pressure (red contours) and geopotential height at 300 hPa (blue contours).
|
|
|
Pre-cyclogenesis
|
Cyclogenesis
|
|
Maturity
|
Decay
|
850 hPa Temperature
|
07-10 September 2009. GOES-10 IR channel 4 image and 850 hPa temperature (contours).
|
|
|
Pre-cyclogenesis
|
Cyclogenesis
|
|
Maturity
|
Decay
|
850 hPa Horizontal Temperature Advection
|
07-10 September 2009.GOES-10 IR channel 4 and horizontal air temperature advection at 850 hPa. Warm advection (red contours); cold advection (blue contours).
|
|
|
Pre-cyclogenesis
|
Cyclogenesis
|
|
Maturity
|
Decay
|
Horizontal relative vorticity advection at 300 hPa
|
07-10 September 2009. GOES-10 IR channel 4 and horizontal relative vorticity advection at 300 hPa. Positive (anticyclonic) advection (red contours) ; negative (cyclonic) advection (blue contours). The circle indicates the region where the NVA contributes to upward motion.
|
|
|
Pre-cyclogenesis
|
Cyclogenesis
|
|
Maturity
|
Decay
|
Potential Vorticity at 300 hPa
|
07-10 September 2009. GOES-10 WV channel 3 and potential vorticity at 300 hPa (blue contours).
|
|
|
Pre-cyclogenesis
|
Cyclogenesis
|
|
Maturity
|
Decay
|
Mean sea level pressure, 500/1000 thickness and wind intensity at 300 hPa
|
07-10 September 2009. Mean sea level pressure (black contours), 500/1000 hPa thickness (blue contours) and 300 hPa wind isotachs above 50 m/s (orange and red shading).
|
|
|
Pre-cyclogenesis
|
Cyclogenesis
|
|
Maturity
|
Decay
|


