Table of Contents
Appearance in Satellite Data
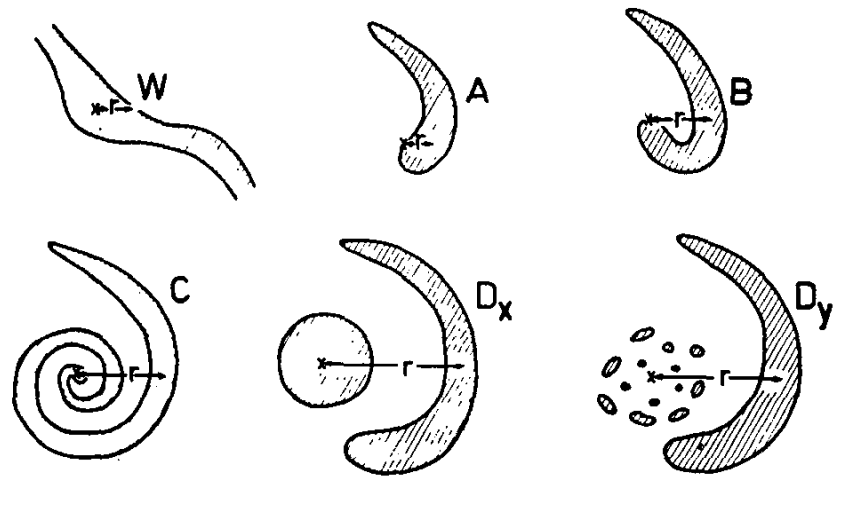
In 1972, Troup and Streten presented a conceptual model about cloud patterns in extratropical cyclones over the Southern Hemisphere. In this model, the clouds associated with the cyclones develop through five stages, as shown in the figure below. In this illustration, W stands for the wave stage, A for formation stage, B for late formation stage, C for mature stage, and Dx / Dy for the dissipation stage.
In South America, the cloud pattern formation in cyclones which develop near the eastern coast of the continent differs slightly from that in the Troup and Streten (1972) model and also from that proposed by the Norwegian school (Bjerkness and Solberg, 1922). Most cyclogenesis occurs when a trough or a cut-off low crosses the Andes Cordillera. In this case, a cloud band develops downstream of the trough axis or over the eastern sector of the cut-off low. Cloud formation stage W is therefore rare near the eastern coast of South America. In other words, the Andes Cordillera causes cloud systems to begin with pattern A.
However, once the trough has crossed the Andes, we can observe dry downslope winds that descend on the lee side of the mountains. This air is warmed by adiabatic compression (Foehn wind), although this increase in temperature does not reduce the surface pressure enough to form a cyclone. Warm air advection is more important for cyclogenesis.
|
Schematic cloud patterns associated with defined vortex types. Cloud areas are shaded. X indicates point taken as vortex center and r distance taken as radius. In non-frontal vortices r is the distance to the edge of the cloud mass. Source: Troup and Streten (1972).
|
|
To further illustrate the cloud patterns shown in the figure above, let us look at a cyclone which started on 07 September, 2009. We will use GOES10 infrared channel 4 (microns) and water vapor channel 3 (6.7 microns) images to show the various cloud development stages during the life cycle of the cyclone.
|
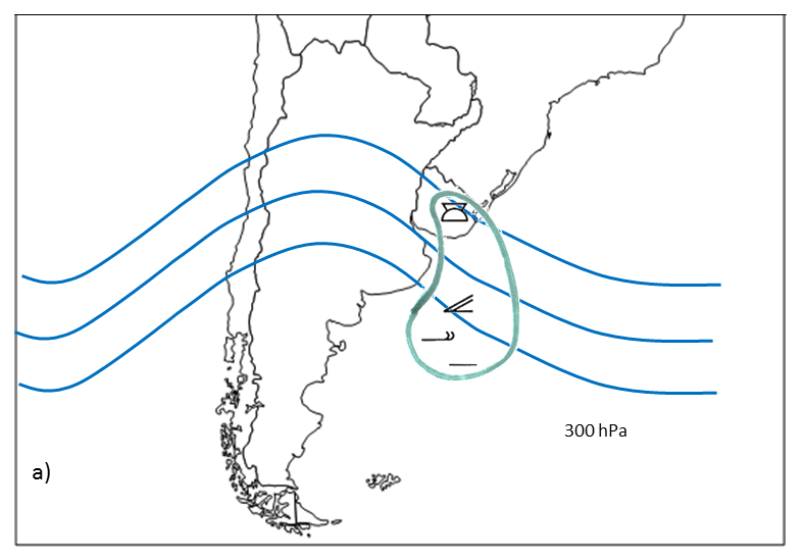
Diagram of a cyclone which developed near the eastern coast of South America, in association with an upper-level trough. The blue lines represent the geopotential height at 300 hPa (left figure) and the gray color shows the clouds (right figure ). A real case is shown with an infrared satellite image from GOES10. The red arrow indicates the inverted comma-like cloud.
|
|
|

|
In the water vapor figures below, the moisture shows an upper-level cut-off low located over Argentina at around 41oS and 67oW. However, we are interested in the feature located in the northeastern sector of the mentioned system, which is an upper-level trough (seen at 300 hPa high analysis), and its associated cloud patterns. During the initial stage of the cyclone (first two rows in the figure below), both satellite channels show convective clouds with a slightly cyclonic curvature, similar to pattern A in the Troup and Streten model (1972). At this stage, the clouds near Uruguay and Argentina are not as bright in the IR channel, because their tops are less high. Again, it is interesting to mention that pattern W from the Troup and Streten model (1972) is uncommon near the eastern coast of South America.
During the maturity phase of the cyclone, the upper-level trough propagates to the east (figure not shown) and the cloud band associated with cold and warm fronts takes the form of a large, inverted comma with a spiral. This is due to the development from pattern B to pattern C (third row of the figure below) as described in the Troup and Streten model. Cirrus clouds over the north of Argentina and Uruguay indicate the presence of the jet stream.
During the decay stage (fourth row of the figure below), the cloud pattern resembles the Dx case in the Troup and Streten model (1972).
|
Summary: the cyclones near the eastern coast of South America show similar cloud patterns to those in the Troup and Streten model, with the exception of phase W, which is not present in these systems.
|
||
|
|

|

|

|

|

|

|

|

|

|

|

|
Meteorological Physical Background
The first realistic conceptual model of extratropical cyclones was presented by Bjerknes in 1919, followed by Bjerknes and Solberg in 1922. They put forward the theory that cyclogenesis is associated with the existence of a surface temperature gradient and cyclone intensification occurs when the cold front rotates around the low-pressure center, until it cuts off the warm air and meets the warm front. The importance and influence of upper air phenomena was emphasized by Bjerknes and Solberg in their 1922 theory (figure below).
Cyclones developing near the coasts of Uruguay and southern Brazil are associated at middle/upper levels with a trough or a cut-off low (cold core), which moves from the Pacific to the Atlantic Ocean (as shown in the figure below). These cyclones do not appear immediately after the Andes Mountains. Instead, cyclogenesis occurs approximately 1000 km from the Andes (Vera et al., 2002.).
Factors which create favorable conditions for this development include: a horizontal gradient in the air temperature with warm air temperature over the continent and cold sea-surface temperature (due to Brazilian and Malvinas currents, as shown in the figure below) and moist air on the eastern side of cyclone, with dry air on the western side, combined with the trough or a cut-off low in upper levels.
Sometimes, a surface cyclone can develop when there is warm air advection from the Amazon region in northern Argentina (low level jet) and there is a trough or a cut-off low crossing the Andes (lee cyclogenesis) at upper levels. In both cases the cyclone will then develop and propagate eastwards or southeastwards (figures b and c below). The occlusion phase is generally reached over the South Atlantic Ocean (figure D below).
The cyclones which develop near Uruguay and southern Brazil are slightly different to those described in the conceptual model by Bjerknes and Solberg (1922):
- a) In contrast to the model from these authors, cyclones forming near Uruguay and southern Brazil do not show a surface wave pattern during their initial phase, due to the effects from the mountainous region and from baroclinic instability. Their creation is favored more by the horizontal advection of relative vorticity from a trough or a cut-off low at upper-levels crossing the Andes.
- b) In another contrast to Bjerknes and Solberg's model, cyclones near Uruguay and southern Brazil do not initially display an asymmetric center (cold air in the western sector of the cyclone and warm in the eastern), which then becomes a cold core cyclone during the occlusion stage. Instead, the cyclone center remains warm from its genesis until its decay phase.
|
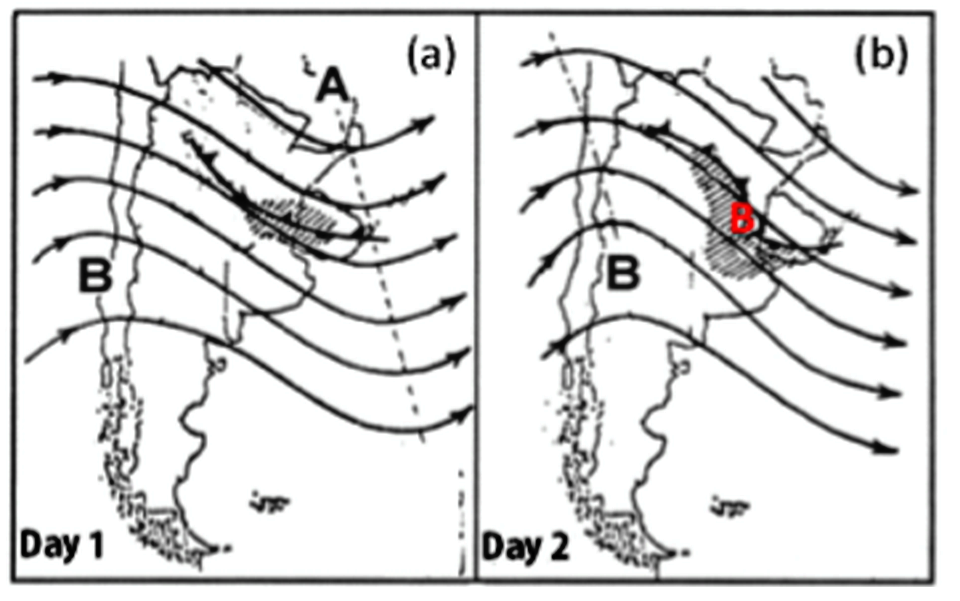
Conceptual model for the development of an extratropical cyclone over South America. The black lines with arrows represent the 500-hPa geopotential high; the black with triangles (semicircles) represent the cold fronts (warm fronts). The bold black letters A and B indicate the position of the high and low-pressure centers, respectively at 500 hPa and the red letter B indicates the surface cyclone position. The shaded areas show the cloudiness associated with the fronts and the cyclone. Source: Adapted from Celemín (1984).
|
|

|
|
Monthly mean sea-surface temperature (°C) over the South Atlantic Ocean from 1982 to 2002. It is possible to identify the Brazil-Malvinas current confluence near the coasts of Uruguay and southern Brazil. Source: Reboita (2008)
|

|
Geographical Location and Seasonal Variety
Extratropical cyclogenesis occurs over two main areas of South America (Gan and Rao, 1992), one of these being Uruguay and the other the San Matias Gulf, Argentina (figure below). During wintertime, the frequency of cyclogenesis is higher over Uruguay than over the San Matias Gulf. In summertime, the opposite is the case. This seasonality is associated with the displacement of the baroclinicity caused by the SST gradients.
Reboita et al. (2010) observed that, during the summertime, there is another region of maximum cyclogenesis frequency beyond these two areas. This third area is located over the coast of São Paulo state (figure below).
Normally, the cyclones form close to the coast (associated with the east coast effect) and propagate eastwards, reaching their maximum intensity over the South Atlantic Ocean. During the period from May to September, many cyclones which form over Uruguay, northeastern Argentina and southern Brazil experience high intensification when they propagate from the continent to the ocean, due to the seawaters being warmer than the surface of the continent. The surface heat flux (latent and sensible) warms the air associated with the cyclone and then often contributes towards intensification of these cyclones.
|
Annual distribution of isolines showing frequency of cyclogenesis. Source: Gan and Rao (1992)
|
Cyclogenesis density from 1990-1999. This density is the number of systems, divided by an area of 5° x 5° of latitude-longitude and multiplied by 104. Source: Reboita et al. (2010)
|
|

|

|
Key Parameters
Mean Sea Level Pressure
| This variable is important for identifying and tracking the cyclones. During the pre-cyclogenesis stage, there is an elongated, relatively low mean sea-level pressure area over Paraguay, southern Brazil and Uruguay. However, the actual genesis of the cyclone normally occurs over Uruguay or over the ocean (near the eastern coast of South America). During its development, the cyclone moves southeastwards and reaches maturity (occlusion phase). The decay occurs near 55°S and 35°W. |
300 hPa Geopotential Height
| A trough or a cut-off low which is displaced from the Pacific to the Atlantic Ocean contributes to the genesis of the cyclone near the eastern coast of South America. This cyclogenesis occurs downstream of the trough axis, either over a pre-existing baroclinic zone or due to the orographic effect (lee cyclogenesis) when a low level jet is present. |

|
850 hPa Temperature
| This parameter allows us to monitor the horizontal temperature gradients around the cyclone, during its evolution. During the pre-cyclogenesis and cyclogenesis stages, there is a steep horizontal temperature gradient within the cyclone region. In the cyclogenesis stage, the isotherms show a concavity similar to that in Bjerknes and Solberg's model. However, once the cyclone has matured, these isotherms begin to differ from those described by these authors: our examples show a pool of warm air in the western part of the temperature gradients. Although these thermal characteristics are even more clearly visible at 925 hPa, this level is underground in some regions, which is why we recommend using 850 hPa. |

|
850 hPa Temperature Advection
| Sometimes the Andes Mountains can block the cold front and intensify the 850 hPa warm air advection (WA) from the Amazon region to the eastern side of the Andes. This is an important precondition for creating a lee cyclone, although an upper-level trough crossing the Andes is also required. The temperature advection field shows a very distinct wave situation: a maximum of WA within the cloud head and the relevant parts up front, and cold air advection (CA) behind. This pronounced WA/CA dipole is a sign of cyclogenesis in progress. |

|
300 hPa Relative Vorticity Advection
| At higher levels, maximum vorticity advection (NVA minimum) can be observed downstream of the trough axis, mostly situated within the cloud head. This advection of cyclonic vorticity at higher levels enhances ascent in the column. Maximum vorticity advection can also be found at the righthand exit of the jet streak within the main jet stream. This region shows a divergent upper pattern, which is also associated with ascent in the column. |

|
Potential Vorticity (PV) at 300 hPa
| The PV is negative in the Southern Hemisphere. Values between -1.5 and -2 PV Units in the Southern Hemisphere are considered to be a sign of the dynamic tropopause. The PV fields show minimum negatives values along the rear cloud edge of the cold front. Large PV gradients are often associated with large brightness (temperature) gradients in water vapor imagery. |
300 hPa winds
| At higher levels, we can see a jet stream, associated with the cyclone and with cold and warm fronts. During the initial stage of the cyclone development, the jet stream can normally be seen along the rear edge of the frontal cloud band. However, if the low-level temperature gradient is not so intense, the upper-level winds will not be so intense either, and the jet stream will not be present. During the development phase, the jet stream can be observed over the point at which the cold and the warm fronts meet. Later, during the occlusion phase, the jet stream is located on the equatorial side of the cyclone and crosses the triple point, i.e., the point at which the cold, warm and occluded fronts meet.
It is important to mention that, in many cases when the upper-level jet stream is over the continent, it may join the low-level jet. These coupled jets can then potentiate the convection, causing a mesoscale convective complex (MCC) to develop. |
Mean Sea Level Pressure and 300 hPa Geopotential Height
|
07-10 September 2009. GOES-10 IR channel 4 image. Mean sea level pressure (red contours) and geopotential height at 300 hPa (blue contours).
|
|
|
Pre-cyclogenesis
|
Cyclogenesis
|

|

|
|
Maturity
|
Decay
|

|

|
850 hPa Temperature
|
07-10 September 2009. GOES-10 IR channel 4 image and 850 hPa temperature (contours).
|
|
|
Pre-cyclogenesis
|
Cyclogenesis
|

|

|
|
Maturity
|
Decay
|

|

|
850 hPa Horizontal Temperature Advection
|
07-10 September 2009.GOES-10 IR channel 4 and horizontal air temperature advection at 850 hPa. Warm advection (red contours); cold advection (blue contours).
|
|
|
Pre-cyclogenesis
|
Cyclogenesis
|

|

|
|
Maturity
|
Decay
|

|

|
Horizontal relative vorticity advection at 300 hPa
|
07-10 September 2009. GOES-10 IR channel 4 and horizontal relative vorticity advection at 300 hPa. Positive (anticyclonic) advection (red contours) ; negative (cyclonic) advection (blue contours). The circle indicates the region where the NVA contributes to upward motion.
|
|
|
Pre-cyclogenesis
|
Cyclogenesis
|

|

|
|
Maturity
|
Decay
|

|

|
Potential Vorticity at 300 hPa
|
07-10 September 2009. GOES-10 WV channel 3 and potential vorticity at 300 hPa (blue contours).
|
|
|
Pre-cyclogenesis
|
Cyclogenesis
|

|

|
|
Maturity
|
Decay
|

|

|
Mean sea level pressure, 500/1000 thickness and wind intensity at 300 hPa
|
07-10 September 2009. Mean sea level pressure (black contours), 500/1000 hPa thickness (blue contours) and 300 hPa wind isotachs above 50 m/s (orange and red shading).
|
|
|
Pre-cyclogenesis
|
Cyclogenesis
|

|

|
|
Maturity
|
Decay
|

|

|
Typical Appearance In Vertical Cross Sections
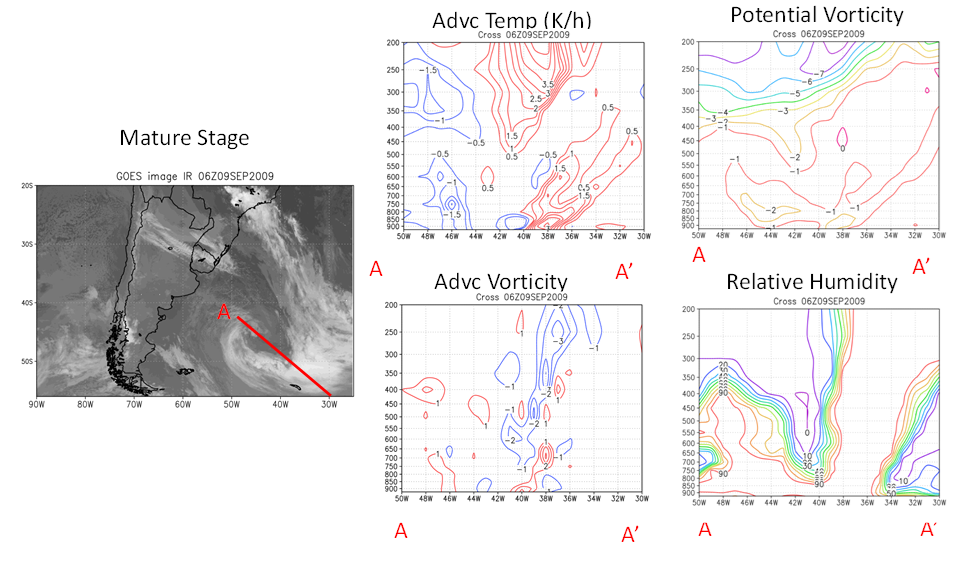
- Temperature Advection (TA): The asymmetry of the thermal structure intensifies due to negative temperature advection in the western sector of the cyclone and positive advection in the eastern sector (see image below), at low and upper levels during the cyclogenesis and mature stages.
- Vorticity Advection (NVA/PVA): Relative Upper-level NVA (PVA) can be seen in the eastern (western) sector of the cyclone.
- Potential Vorticity (PV): This variable shows an intrusion into the troposphere reaching as far as 330 hPa during the cyclogenesis stage at 00Z on 08 September, 2009, around 57°W and as far as 500 hPa during the mature stage at 06Z on 09 September, 2009 near 42°W.
- Relative Humidity (RH): In the cyclogenesis stage, the mid-level atmosphere is dry. During the mature stage, we see a dry tongue with low relative humidity values near 42°W.
|
8 September, 2009, 00 UTC. Cross section location on left. On right Vertical Cross Sections along the line A-A' (near the dry intrusion) of Temperature Advection, Potential Vorticity, Vorticity Advection and Relative Humidity.
|

|
|
9 September, 2009, 06 UTC. Cross section location on left. On right Vertical Cross Sections along the line A-A' (near the dry intrusion) of Temperature Advection, Potential Vorticity, Vorticity Advection and Relative Humidity.
|
|
Weather Events
| Parameter | Description |
|---|---|
| Precipitation |
|
| Significant Weather and Marine Hazards (waves) |
|
| Wind (incl. gust) |
|
Pre-Cyclogenesis Phase
|
08 September 2009 /00:00 UTC Wind at 10 m (GFS analysis) and 3-hourly accumulated precipitation using TRMM Multisatellite Precipitation Analysis (TMPA) product.
|
08 September 2009 /00:00 UTC GOES-10 WV 6.2 8 composite image.
|

|

|
|
08 September 2009 /00:00 UTC QuickSCAT winds.
|
08 September 2009 /00:00 UTC Significant Weather (Source: Ogimet).
|

|

|
Cyclogenesis Phase
|
08 September 2009 /00:00 UTC Wind at 10 m (GFS analysis) and 3-hourly accumulated precipitation using the TRMM Multisatellite Precipitation Analysis (TMPA) product.
|
08 September 2009 /00:00 UTC GOES10 WV 6.2 composite image.
|

|

|
|
08 September 2009 /00:00 UTC QuickSCAT winds.
|
08 September 2009 /00:00 UTC Significant Weather (Source: Ogimet).
|

|

|
Mature (occlusion) Phase
|
09 September 2009 /06:00 UTC Wind at 10 m (GFS analysis) and 3-hourly accumulated precipitation using TRMM Multisatellite Precipitation Analysis (TMPA) product.
|
09 September 2009 /06:00 UTC GOES10 WV 6.2 composite image.
|

|

|
|
09 September 2009 /00:00 UTC QuickSCAT winds.
|
09 September 2009 /09:00 UTC Wave height (m).
|

|

|
References
General Meteorology and Basics
- AHRENS, D. Meteorology Today: An Introduction to Weather, Climate, and the Environment. 9th ed. Cenage Learning, 2008.
- BJERKNES, J. On the structure of moving cyclones. Geofys. Publ., v. 1, n. 2, p. 1-8, 1919.
- BJERKNES, J.; PALMÉN, E. Investigation of selected European cyclones by means of serial ascents. Geofys. Publ., vol. 12, n. 2, p. 1-62, 1937.
- BJERKNES, J.; SOLBERG, H. Life cycle of cyclones and the polar front theory of atmospheric circulation. Geofys. Publ., v. 3, p. 3-18, 1922.
- BJERKNES, J.; HOLMBOE, J. On the Theory of Cyclones. J. Meteor., v.1, p. 1-22, 1944.
- BUZZI, A.; TIBALDI, S. Cyclogenesis in the lee of the Alps: A case study. Q.J.R. Meteorol. Soc., v. 104, p. 271-287, 1978.
- BUZZI, A.; SPERANZA, A.; TIBALDI, S.; TOSI, E. A unified theory of orographic influences upon cyclogenesis. Meteorol. Atmos. Phys., v. 36, p. 91-107, 1987.
- CARLSON, T. Mid-Latitude Weather Systems. Harper Collins, New York, 512 pp, 1991.
- CELEMÍN, A. H. Meteorologia Prática. Edició;n del Autor, Mar del Plata, República Argentina, 313 pp, 1984.
- CHARNEY, J. G. The Dynamics of Long Waves in a Baroclinic Westerly Currents. Journal of Meteorology, p. 135-162, 1947.
- DIAS PINTO, J. R.; DA ROCHA, R. P. The energy cycle and structural evolution of cyclones over southeastern South America in three case studies. J. Geophys. Res., v. 116, D14112, 2011.
- DIAS PINTO, J. R.; REBOITA, M. S.; DA ROCHA, R. P. Synoptic and dynamical analysis of subtropical cyclone Anita (2010) and its potential for tropical transition over the South Atlantic Ocean. J. Geophys. Res. Atmos., v. 118, 10,870-10,883, 2013.
- DUTRA, L. M. M. Ciclones Subtropicais sobre o Atlântico Sul: análise da estrutura dinâmica de eventos. 2012. Dissertação (Mestrado em Meteorologia). Instituto de Astronomia, Geofísica e Ciências Atmosféricas (IAG), Universidade de São Paulo, São Paulo, 136f.
- EADY, E. T. Long Waves and Cyclones Waves. Tellus, v. 1, n. 3, p. 35-52, 1949.
- EVANS J. L.; BRAUN, A. A Climatology of Subtropical Cyclones in the South Atlantic. J. Climate, v. 25, p. 7328-7340, 2012.
- EVANS, J. L., GUISHARD, M. P. Atlantic Subtropical Storms. Part I: Diagnostic Criteria and Composite Analysis. Mon. Wea. Rev., v. 137, p. 2065-2080, 2009.
- GAN, M. A. Um Estudo Observacional Sobre as Baixas Frias da Alta Troposfera nas Latitudes Subtropicais do Atlântico Sul e Leste do Brasil. Dissertação de Mestrado em Meteorologia. INPE, 1982.
- GAN, M. A.; RAO, V. B. Surface Cyclogenesis over South America. Mon. Wea. Rev., v. 119, p. 1293-1302, 1991.
- GAN, M. A.; RAO, V. B. The Influence of the Andes Cordillera on Transient Disturbances. Mon. Wea. Rev., v. 122, n. 6, p. 1141-1157, 1994
- GAN, M. A.; RAO, V. B. Case Studies of Cyclogenesis over South America. Meteorological Applications, Inglaterra, v. 3, p. 359-368, 1996.
- GAN, M. A.; PIVA, E.; RAO, V. B. Catarina Cyclone: a hurricane-like cyclone over South Atlantic. In: Second Trorpex International Science Symposium - STISS, 2006, Landshut, Alemanha. World Meteorological Organization - WMO, v. 1355, 2006;
- GOZZO, L. F.; DA ROCHA, R. P. Air-sea interaction processes influencing the development of a Shapiro-Keyser type cyclone over the subtropical South Atlantic Ocean. Pure Appl. Geophys., v. 170, n. 5, p. 917-934, 2013.
- GOZZO, L. F.; DA ROCHA, R. P.; REBOITA, M. S.; SUGAHARA, S. Subtropical Cyclones over the Southwestern South Atlantic: Climatological Aspects and Case Study. J. Climate, v. 27, p. 8543-8562, 2014.
- GUISHARD, M. P.; EVANS, J. L.; HART, R. E. Atlantic Subtropical Storms. Part II: Climatology. J. Climate, v. 22, p. 3574-3594, 2009.
- GUISHARD, M. P. Atlantic subtropical storms: Climatology and characteristics. 158 pp., PhD thesis, Pa State Univ., University Park, 2006.
- HART, R. E. A cyclone phase space derived from thermal wind and thermal asymmetry. Mon. Wea. Rev., v. 131, p. 585-616, 2003.
- KOUSKY, V. E.; GAN, M. A. Upper tropospheric cyclonic vortices in the tropical South Atlantic. Tellus, v. 33, n. 6, p. 538-551, 1981.
- KOUSKY, V. E.; ELIAS, M. Meteorologia Sinótica: Parte I. São José dos Campos: INPE, 1982.
- MCTAGGART-COWAN, R.; BOSART, L. F.; DAVIS, C. A.; ATALLAH, E. H.; GYAKUM, J. R.; EMANUEL, K. A. Analysis of Hurricane Catarina (2004). Mon. Wea. Rev., v. 134, p. 3029-3053, 2006.
- ORLANSKI, I.; KATZFEY, J. The Life Cycle of a Cyclone Wave in the Southern Hemisphere. Part I: Eddy Energy Budget. Journal Atmospheric Sciences, v.48, n.17, p.1972-1998, 1991.
- PALMÉN, E.; NEWTON, C. W. Atmospheric Circulation Systems: Their Structure and Physical Interpretation. New York: Academic Press, 603 p, 1969.
- PETTERSSEN, S. Introduction to Meteorology. 1a ed., McGraw-Hill Book Company, New York, 1941.
- PETTERSSEN, S. Weather analysis and forecasting. New York: McGraw Hill, 1956.
- PIVA, E.; GAN, M. A.; MOSCATI, M. C. L. The Role of Latent and Sensible Heat Fluxes in an Explosive Cyclogenesis over the South American East Coast. Journal of the Meteorological Society of Japan, v. 86, p. 1-27, 2011.
- REBOITA, M. S.; IWABE, C.; DA ROCHA, R. P.; AMBRIZZI, T. Análise de um ciclone semi-estacionário na Costa Sul do Brasil associado a bloqueio atmosférico: o Evento de 02 a 06 Maio de 2008. Rev. Bras. Meteorol., v. 24, p. 407-422, 2009.
- REBOITA, M. S.; DA ROCHA, R. P.; AMBRIZZI, T; SUGAHARA, S. South Atlantic Ocean Cyclogenesis Climatology Simulated by Regional Climate Model (RegCM3). Climate Dynamics, v. 35, p. 1331-1347, 2010.
- REBOITA, M. S.; DA ROCHA, R. P.; AMBRIZZI, T. Dynamic and climatological features of cyclonic developments over southwestern South Atlantic Ocean. Horizons in Earth Science Research, 6, Nova Science Publishers, pp. 135-160, 2012.
- REBOITA, M. S.; DIAS PINTO, J. R.; DUTRA, L. M. M.; DA ROCHA, R. P. Synoptic Analysis of Subtropical Cyclones over the South Atlantic Ocean. In: PASI on Atmospheric Processes in Latin America and the Caribbean: Observations, Analysis, and Impacts. 27 de maio a 07 de junho de 2013, Cartagena, Colômbia.
- REBOITA, M. S.; DA ROCHA, R. P.; AMBRIZZI, T.; GOUVEIA, C. D. Trend and teleconnection patterns in the climatology of extratropical cyclones over the Southern Hemisphere. Climate Dynamics, DOI 10.1007/s00382-014-2447-3, 2014.
- SCHULTZ, D. M.; KEYSER, D.; BOSART, L. F. The effect of largescale flow on low-level frontal structure and evolution in midlatitude cyclones. Mon. Wea. Rev., v. 126, p. 1767-1791, 1998.
- SCHULTZ, D. M.; WERNLI, H. Determining Midlatitude Cyclone Structure and Evolution from the Upper-Level Flow. 2001. Acesso em 15/01/2015. Disponível em: http://www.cimms.ou.edu/~schultz/papers/marwealog.html.
- SELUCHI, M. E.; CALBETE, N. O.; ROZANTE, R. Análisis de un desarrollo ciclónico en la costa oriental de América del Sur. Revista Brasileira de Meteorologia, v. 16, p. 51-65, 2001.
- SELUCHI, M. E.; SAULO, C.; NICOLINI, M.; SATYAMURTY, P. The Northwestern Argentinean Low: A Study of Two Typical Events. Mon. Wea. Rev., v. 131, p. 2361-2378, 2003
- SHAPIRO, M. A.; KEYSER, D. Fronts, jet streams and the tropopause. Extratropical Cyclones, The Erik Palmén Memorial Volume, C. W. Newton and E. O. Holopainen, Eds., Amer. Meteor. Soc., p. 167-191, 1990.
- SUTCLIFFE, R. C. A contribution to the problem of development. Quart. J. Roy. Meteor. Soc., v. 73, p. 370- 383, 1947.