Appearance in Satellite Data
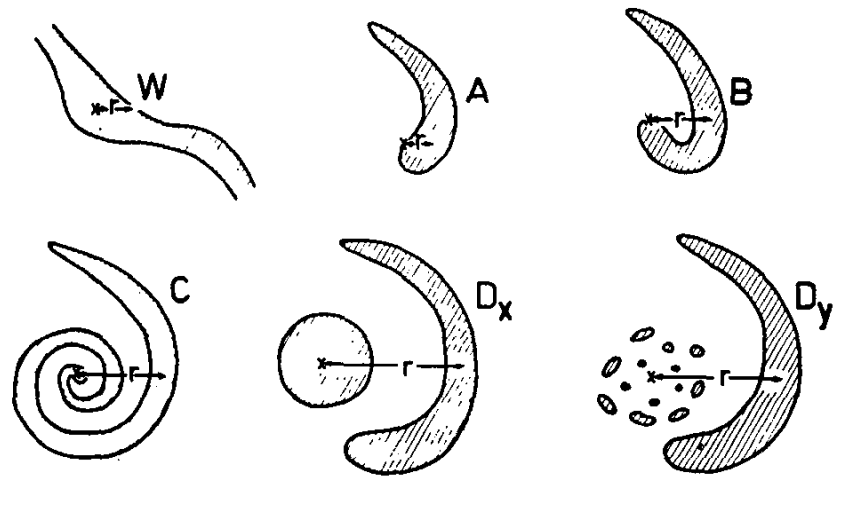
In 1972, Troup and Streten presented a conceptual model about cloud patterns in extratropical cyclones over the Southern Hemisphere. In this model, the clouds associated with the cyclones develop through five stages, as shown in the figure below. In this illustration, W stands for the wave stage, A for formation stage, B for late formation stage, C for mature stage, and Dx / Dy for the dissipation stage.
In South America, the cloud pattern formation in cyclones which develop near the eastern coast of the continent differs slightly from that in the Troup and Streten (1972) model and also from that proposed by the Norwegian school (Bjerkness and Solberg, 1922). Most cyclogenesis occurs when a trough or a cut-off low crosses the Andes Cordillera. In this case, a cloud band develops downstream of the trough axis or over the eastern sector of the cut-off low. Cloud formation stage W is therefore rare near the eastern coast of South America. In other words, the Andes Cordillera causes cloud systems to begin with pattern A.
However, once the trough has crossed the Andes, we can observe dry downslope winds that descend on the lee side of the mountains. This air is warmed by adiabatic compression (Foehn wind), although this increase in temperature does not reduce the surface pressure enough to form a cyclone. Warm air advection is more important for cyclogenesis.
|
Schematic cloud patterns associated with defined vortex types. Cloud areas are shaded. X indicates point taken as vortex center and r distance taken as radius. In non-frontal vortices r is the distance to the edge of the cloud mass. Source: Troup and Streten (1972).
|
|
To further illustrate the cloud patterns shown in the figure above, let us look at a cyclone which started on 07 September, 2009. We will use GOES10 infrared channel 4 (microns) and water vapor channel 3 (6.7 microns) images to show the various cloud development stages during the life cycle of the cyclone.
|
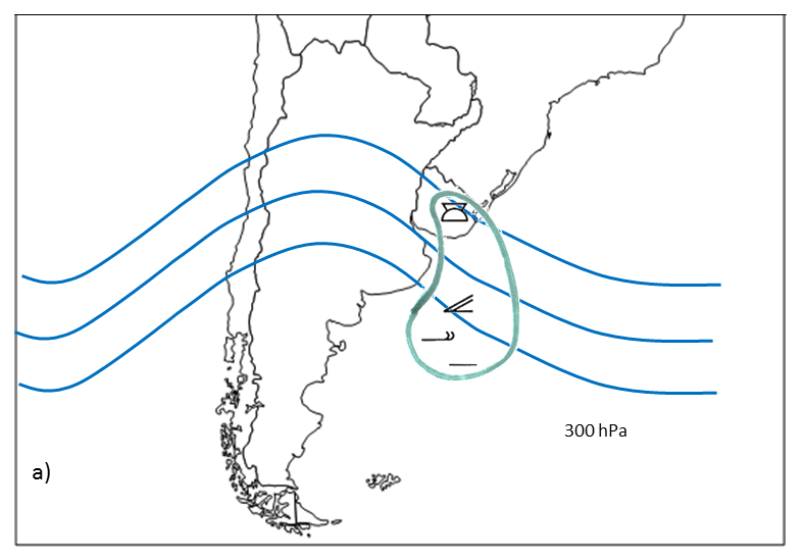
Diagram of a cyclone which developed near the eastern coast of South America, in association with an upper-level trough. The blue lines represent the geopotential height at 300 hPa (left figure) and the gray color shows the clouds (right figure ). A real case is shown with an infrared satellite image from GOES10. The red arrow indicates the inverted comma-like cloud.
|
|
|

|
In the water vapor figures below, the moisture shows an upper-level cut-off low located over Argentina at around 41oS and 67oW. However, we are interested in the feature located in the northeastern sector of the mentioned system, which is an upper-level trough (seen at 300 hPa high analysis), and its associated cloud patterns. During the initial stage of the cyclone (first two rows in the figure below), both satellite channels show convective clouds with a slightly cyclonic curvature, similar to pattern A in the Troup and Streten model (1972). At this stage, the clouds near Uruguay and Argentina are not as bright in the IR channel, because their tops are less high. Again, it is interesting to mention that pattern W from the Troup and Streten model (1972) is uncommon near the eastern coast of South America.
During the maturity phase of the cyclone, the upper-level trough propagates to the east (figure not shown) and the cloud band associated with cold and warm fronts takes the form of a large, inverted comma with a spiral. This is due to the development from pattern B to pattern C (third row of the figure below) as described in the Troup and Streten model. Cirrus clouds over the north of Argentina and Uruguay indicate the presence of the jet stream.
During the decay stage (fourth row of the figure below), the cloud pattern resembles the Dx case in the Troup and Streten model (1972).
|
Summary: the cyclones near the eastern coast of South America show similar cloud patterns to those in the Troup and Streten model, with the exception of phase W, which is not present in these systems.
|
||
|
|

|

|

|

|

|

|

|

|

|

|

|