Chapter II: Synoptic overview, satellite imagery, meteorological parameters
Table of Contents
- Chapter II: Synoptic overview, satellite imagery, meteorological parameters
- Overview
- Formation and development of tropical cyclone
- Hurricane phase
- Extratropical cyclone
Synoptic overview, satellite imagery, meteorological parameters
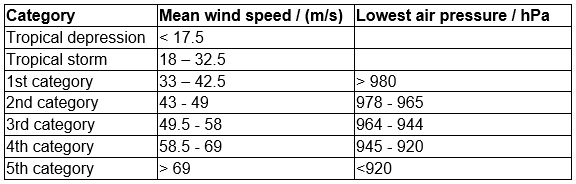
This overview will show the lifecycle (Table 1) of hurricane Ophelia. In Figure 3 Ophelia's path and development can be observed. After the cold front decay on 6th October, the low developed (tropical depression - green colour and subtropical depression - blue colour), the tropical storm then subsequently initiated (yellow colour) followed by the hurricane (orange colour, 11th October) reaching maximum strength of category 3 (red colour, 14th October). The last phase is a transformation to an extratropical storm (16th October - grey colour).
We will observe all the stages with the help of satellite imagery, different channels, different combinations of channels and different meteorological parameters.
* If you want to know more about RGBs used in this chapter look at EUMeTrain's "RGB Colour Interpretation Guide" or "Composite Image Quick Guides" (www.eumetrain.org).
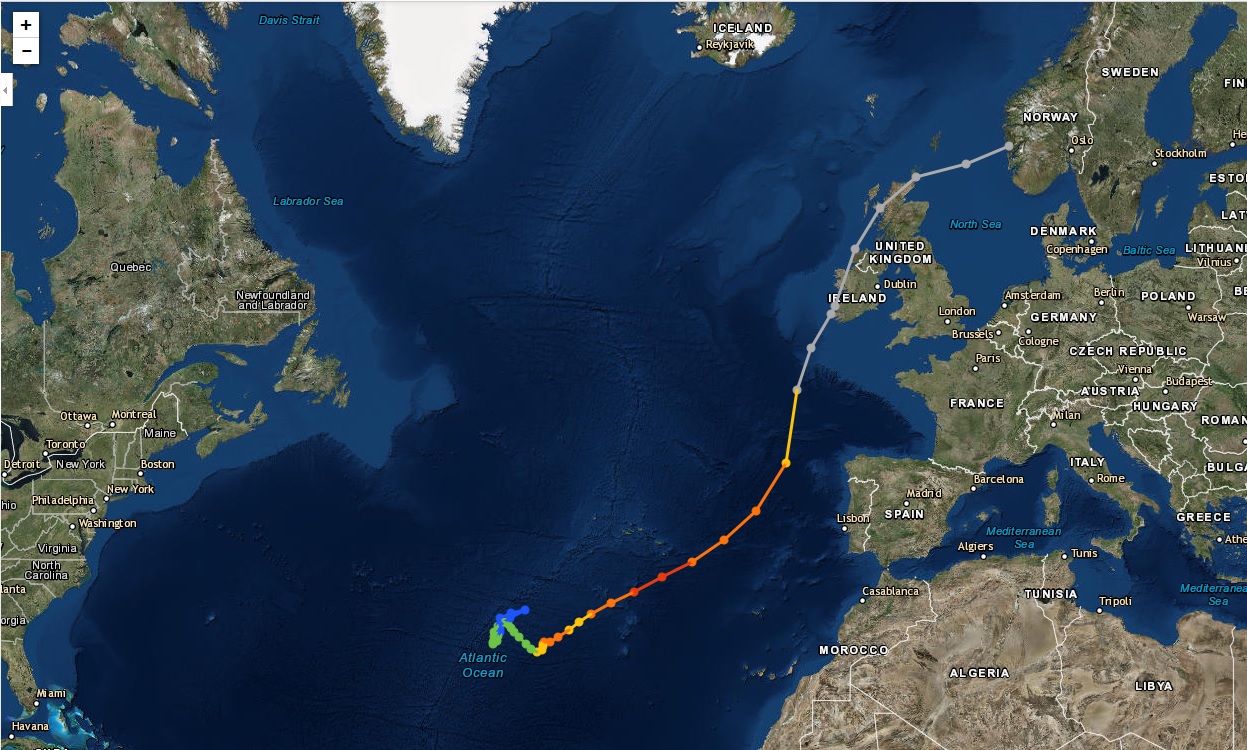
Figure 3: The path of hurricane Ophelia (in different stages of development from 6th to 17th October 2017), source: NOAA
Formation and development of tropical cyclone
Cyclogenesis over Atlantic
Loop 1 and 2: Meteosat 10 IR 10.8 and Airmass RGB animation from 6th October 2017, 12:00 UTC to 11th October 2017, 06:00 UTC (source: EUMeTrain, ePort)
Note: To go through individual images, click
Loop 1 or
Loop 2!
Cyclonic curvature of the cloud structure over the Atlantic can be followed by the animation of satellite images.
Looking at animations of RGB Airmass satellite images we notice that in the beginning, the frontal cloud band separates into two air masses - warmer over the west Atlantic and colder over the east. The jet axis is along the transition from blue to red colours at the rear side of the cloud band. Dry sinking air appears as red and indicates that cyclogenesis is ongoing. The dry air provides high potential vorticity and is the cause of further development and convection. South of the system, warm tropical air mass is greenish with lower clouds, appear less bright. Thick high-level clouds above the front are bright white.
Loop 3: Meteosat 10 WV 7.3 animation from 6th October 2017, 12:00 UTC to 11th October 2017, 06:00 UTC (source: EUMeTrain, ePort)
Note: To go through individual images, click
Loop 3!
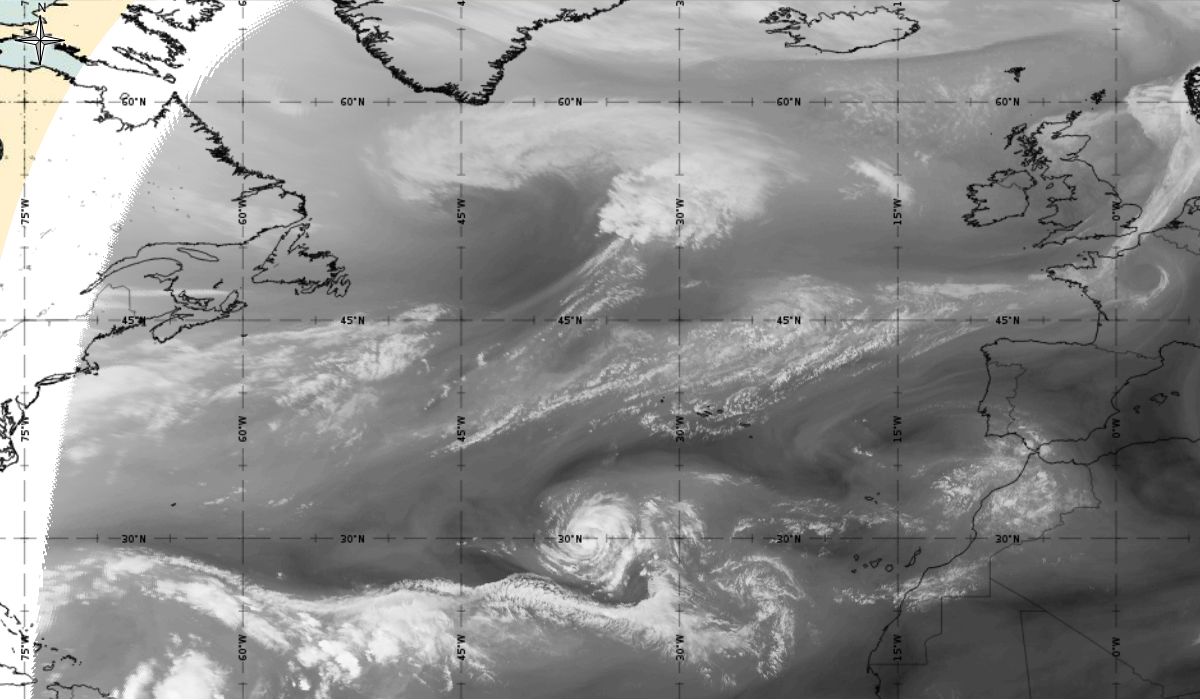
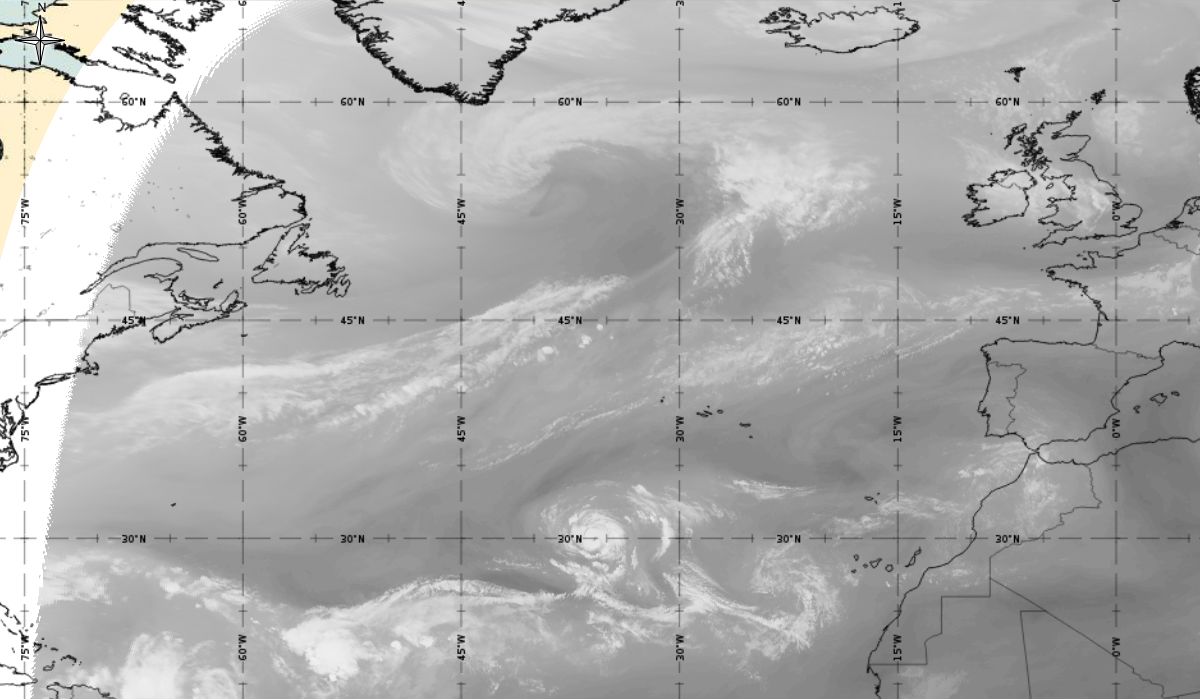
One of the key parameters for the development of tropical cyclone is water content in the atmosphere, which can be observed with WV 7.3. Grey shades in the images show the water vapour content in the lower layers of the troposphere (more brightness indicates more water vapour). The dark areas in Loop 3 is dry stratospheric air, which is engaged within the development of cyclone. Bright areas in the second part of the loop show convective development.
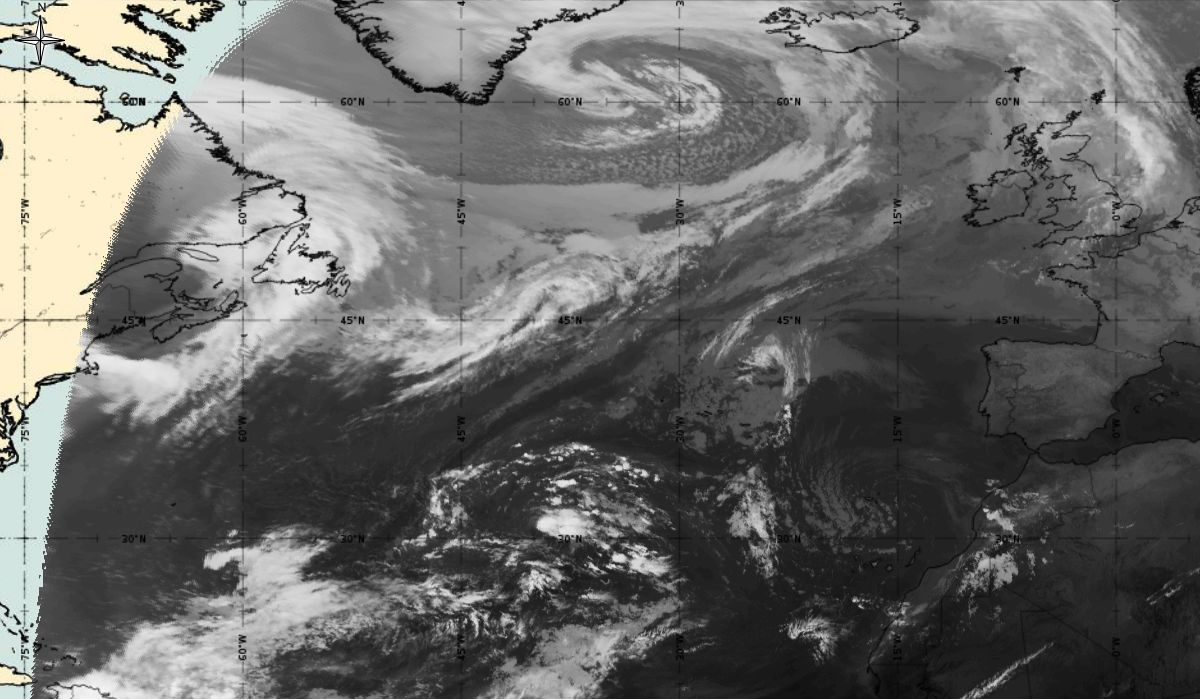
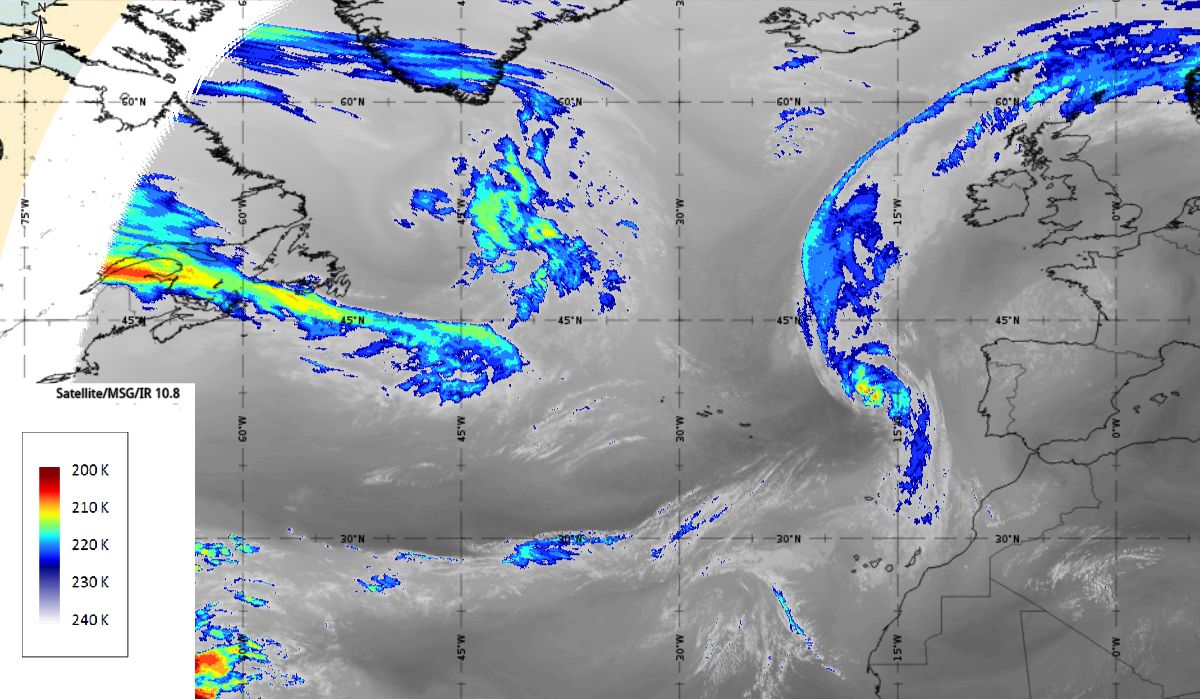
After the passage of the cold front on 6th October, the initial stage of cyclogenesis is seen on Figure 4 as cloud bulges at the rear edge of the aforementioned cold front (31.1 °N, 39.9 °W - in the middle of the Atlantic). While at the same time in the upper level (AT 500 hPa) a deep trough is stretching meridionally (45 °N to 15 °N) between two ridges - one over the West Atlantic and the other over the East Atlantic (west of the Pyrenees Peninsula).
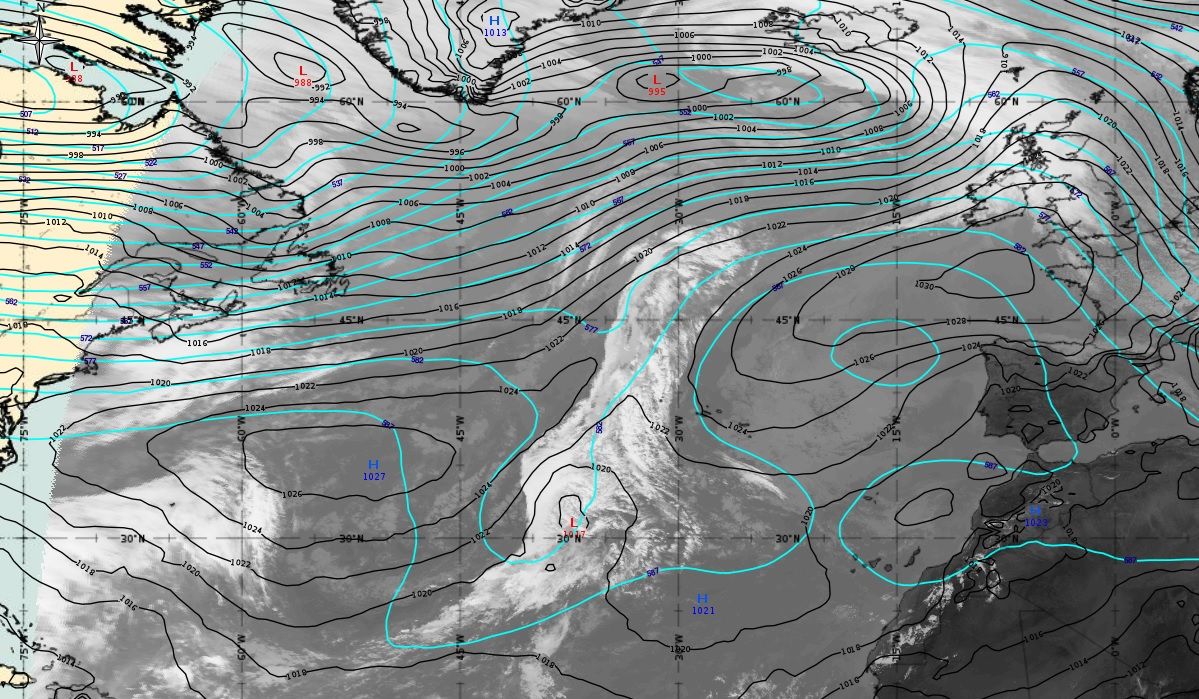
Figure 4: 6th October 2017 12:00 UTC - MSG IR10.8, mean sea level pressure (black line) and geopotential height at 500 hPa (blue line - both ECMWF), source: EUMeTrain, ePort
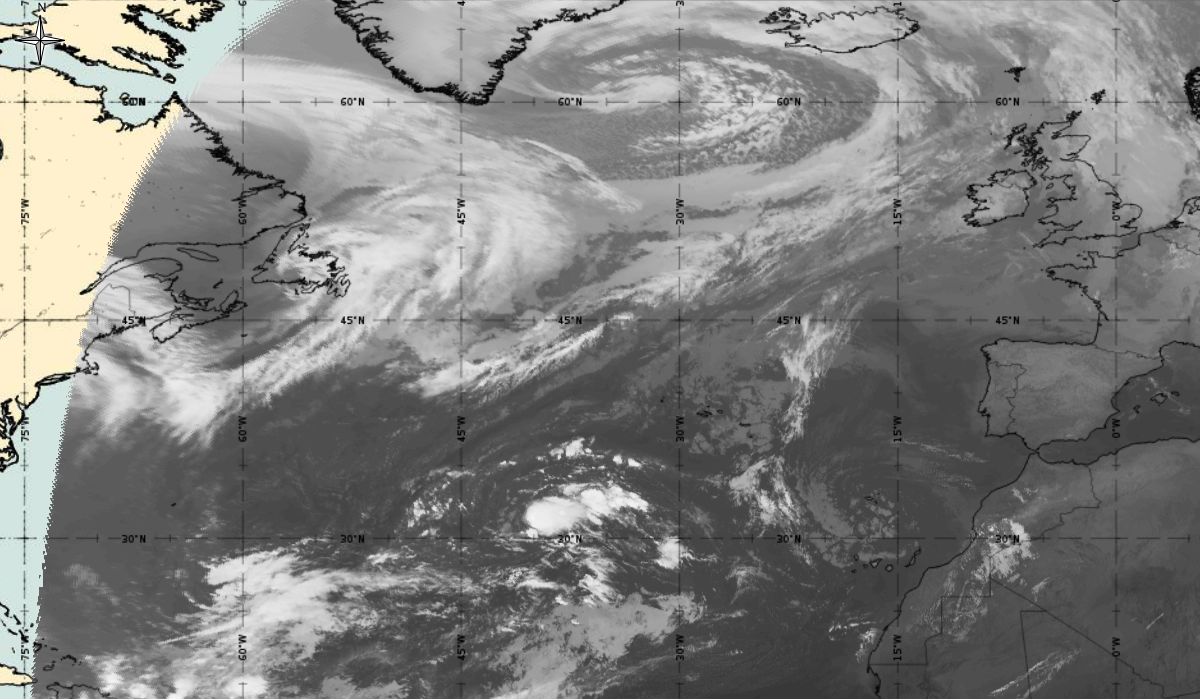
A low-pressure system above a very warm ocean (sea surface temperature SST was near 27°C - Figure 5) started to deepen. Over the next 2 days the system was almost stationary. An upper-level low formed above the cyclone (Figure 6 - 7th October, 12:00 UTC) and the spiral curvature of clouds is clearly seen.
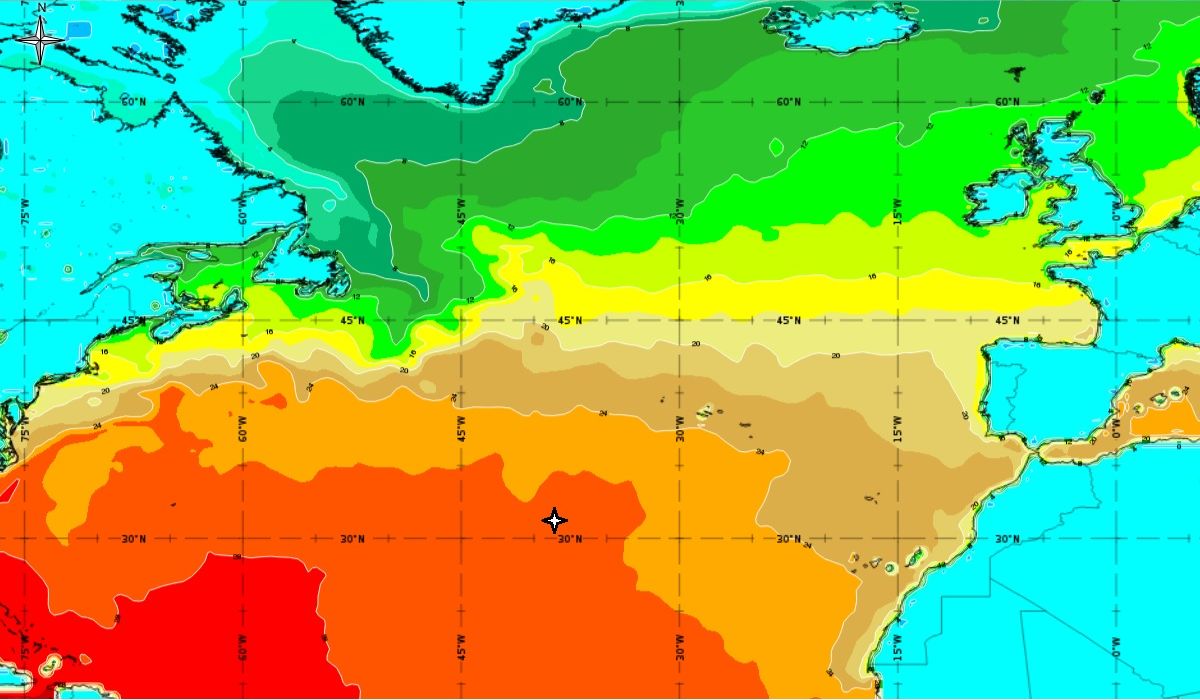
Figure 5: 6th October 2017, 12:00 UTC - SST; star - position of low, orange colour - temperature between 26 and 28 °C (ECMWF), source: EUMeTrain, ePort
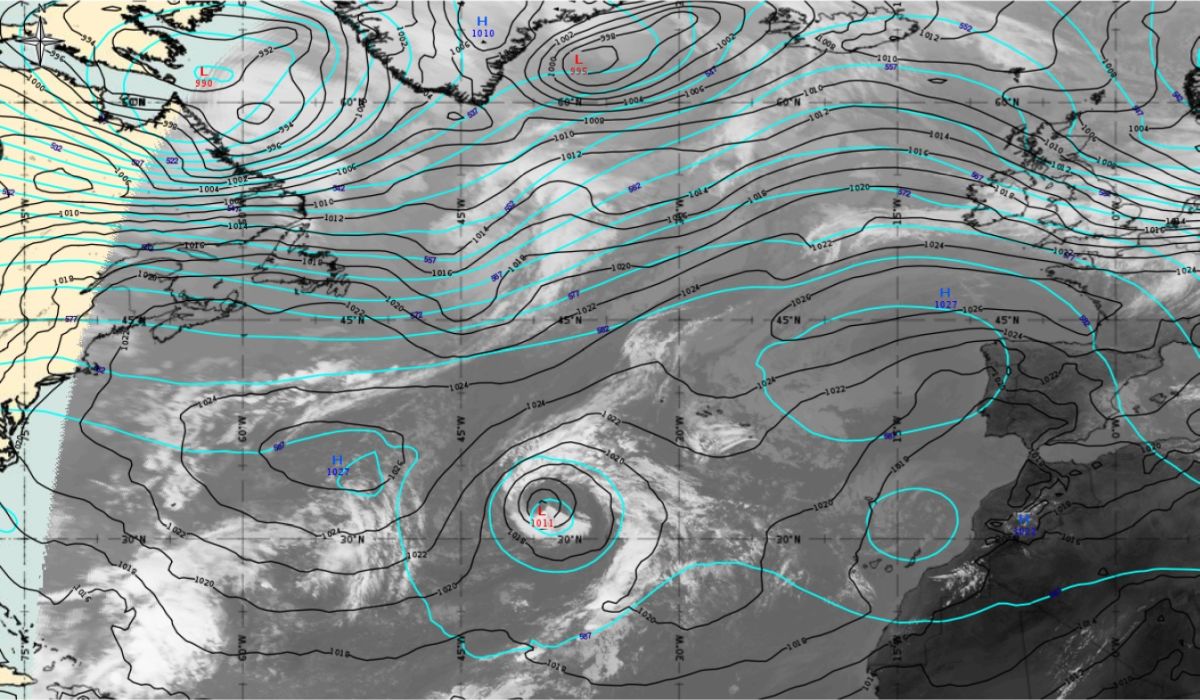
Figure 6: 7th October 2017 12:00 UTC - MSG IR10.8, mean sea level pressure (black line) and geopotential height at 500 hPa (blue line - both ECMWF), source: EUMeTrain, ePort
Over the next day the organized deep convection was unable to persist near the well-defined low-level centre due to intrusion of very dry upper level air. Conversely, a short-lived convective outbreak helped to intensified cyclonic curvature (Figure 7 - 8th October 00:00 UTC - Airmass RGB). The associated clouds are becoming more fragmented and brighter indicating convection which has become more pronounced.
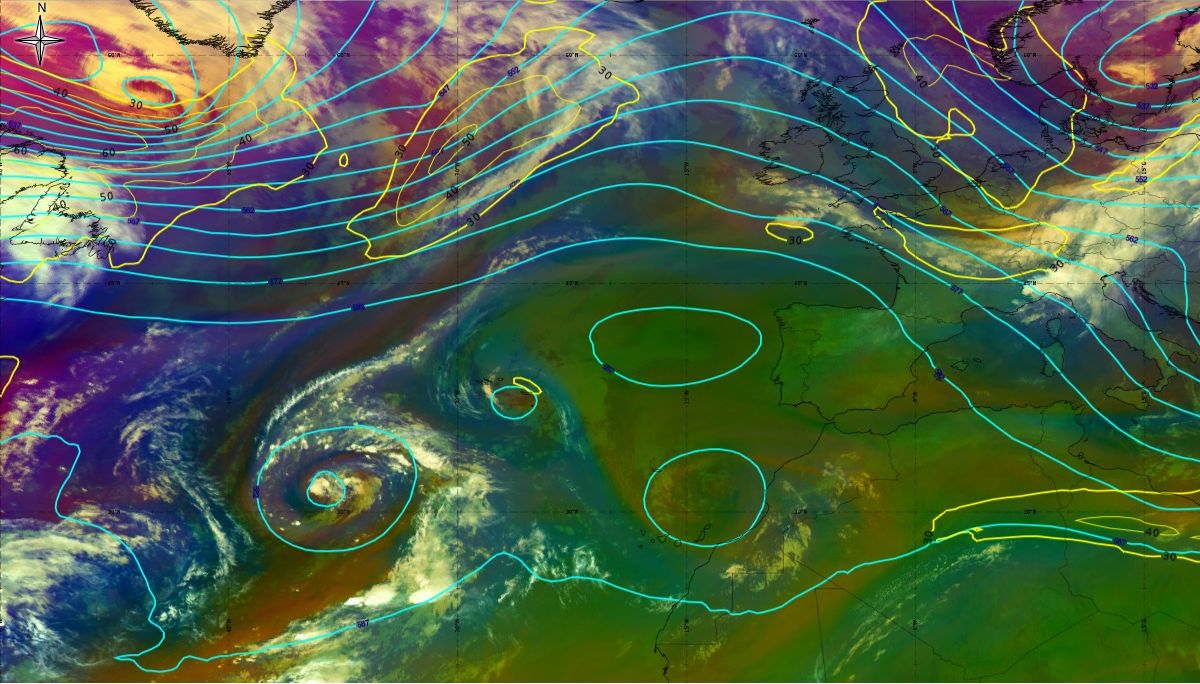
Figure 7: 8th October 2017 00:00 UTC - MSG Airmass RGB, geopotential height at 500 hPa (blue line), jet (yellow line - both ECMWF), source: EUMeTrain, ePort
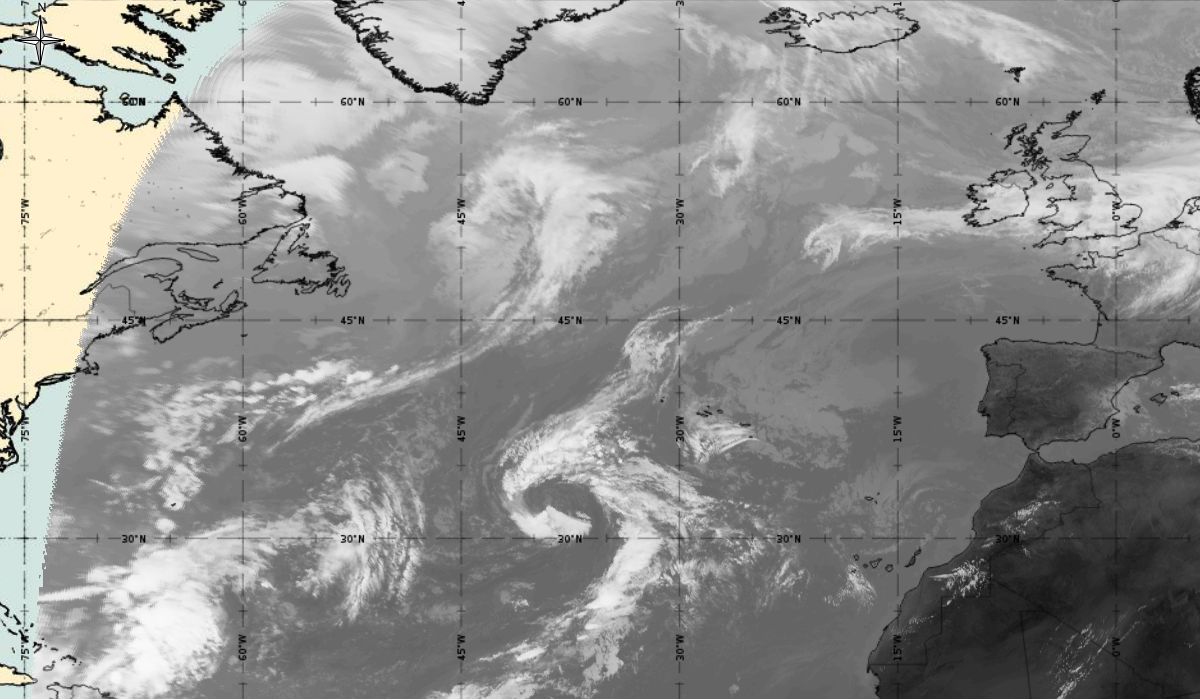
In the next 24 hours, convection steadily increased near the centre of the low and it is estimated by the National Hurricane Center (NHC) that a tropical storm (depression) - Ophelia, formed by 06:00 UTC 9th October when the system was located about 760 nautical miles (about 1400 km) southwest of the Azores (30.9 °N, 40 °W) (Figure 8 - 9th October 06:00 UTC). An area of deep convection was located east of the centre of the low.
|
|
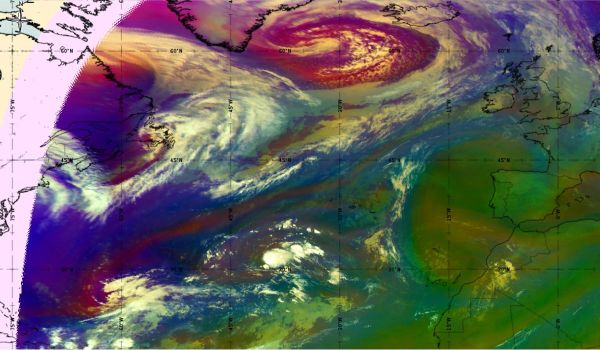
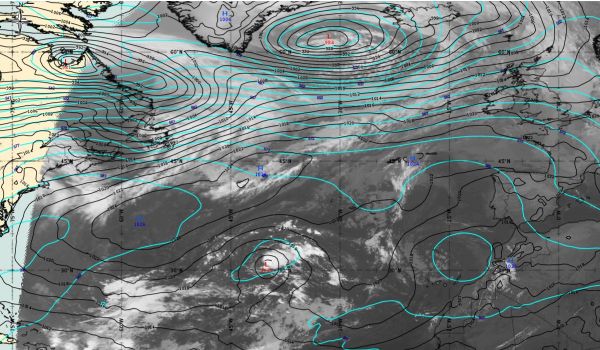
Figure 8: 9th October 2017 06:00 UTC - MSG IR10.8, mean sea level pressure (black line) and geopotential height at 500 hPa (blue line - both ECMWF)/Airmass RGB, source: EUMeTrain, ePort;
In the next two days, tropical storm Ophelia was almost stationary and steadily strengthening.
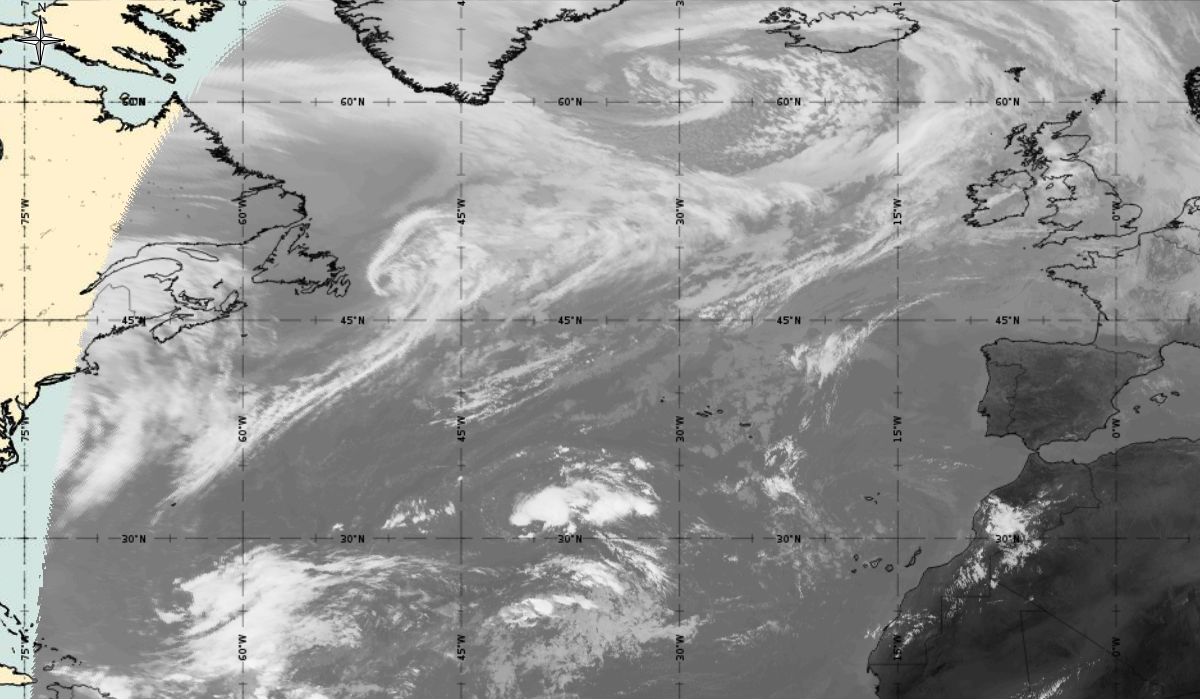
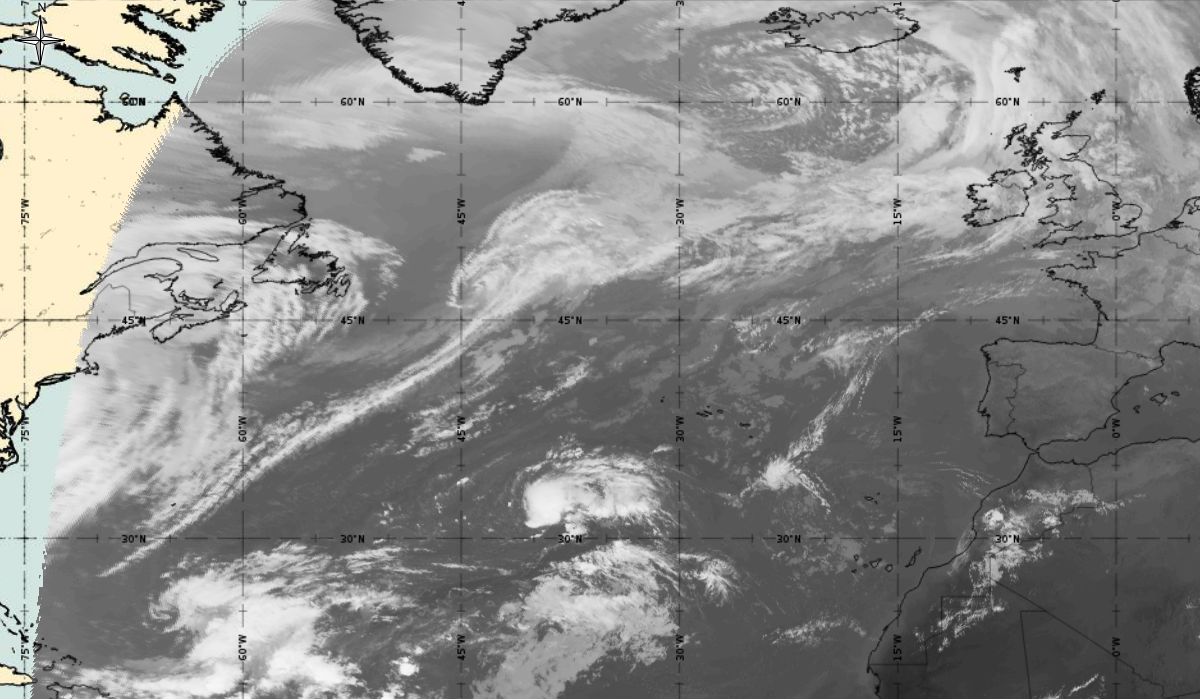
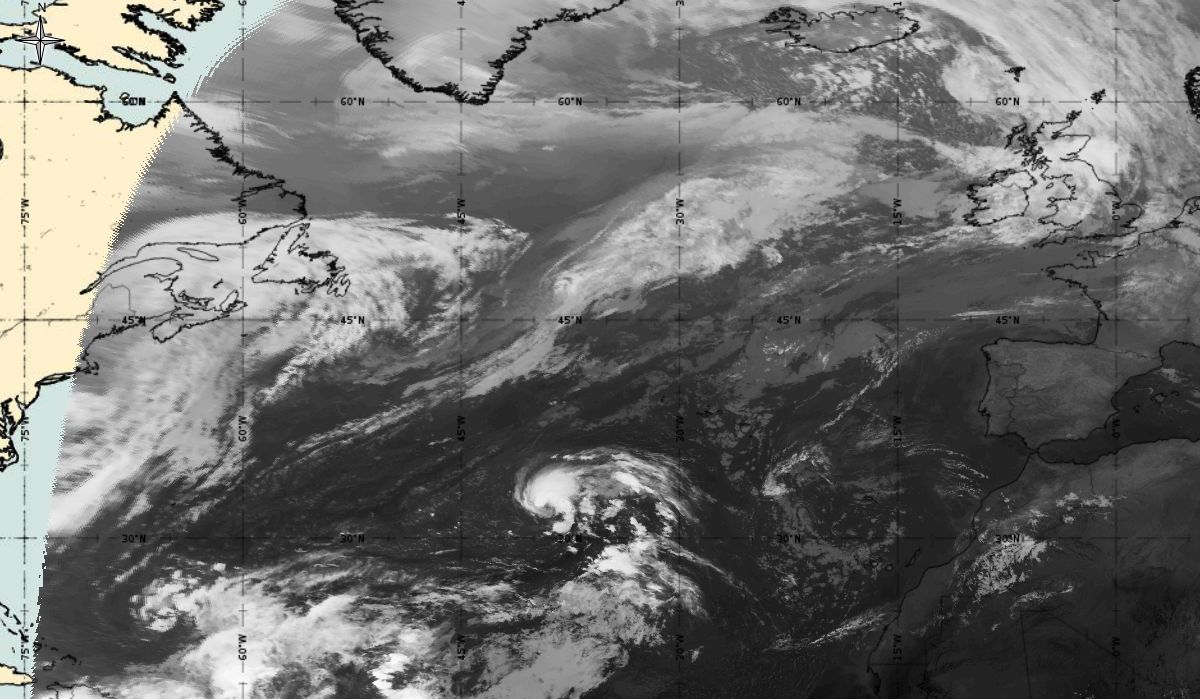
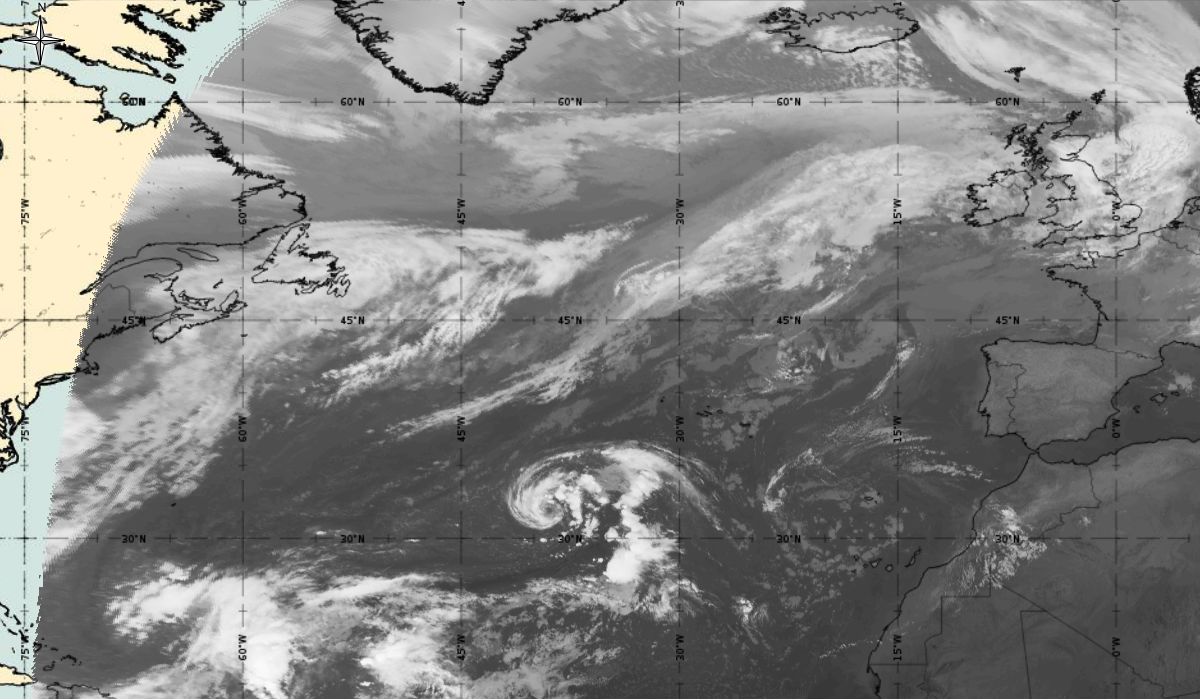
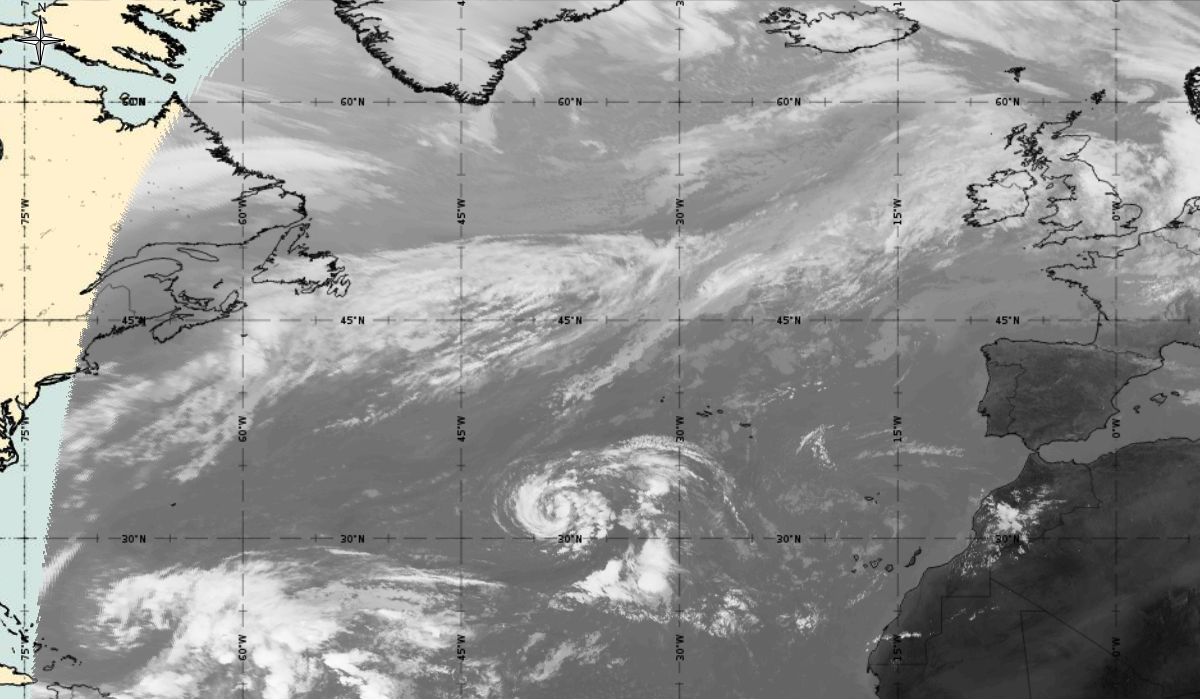
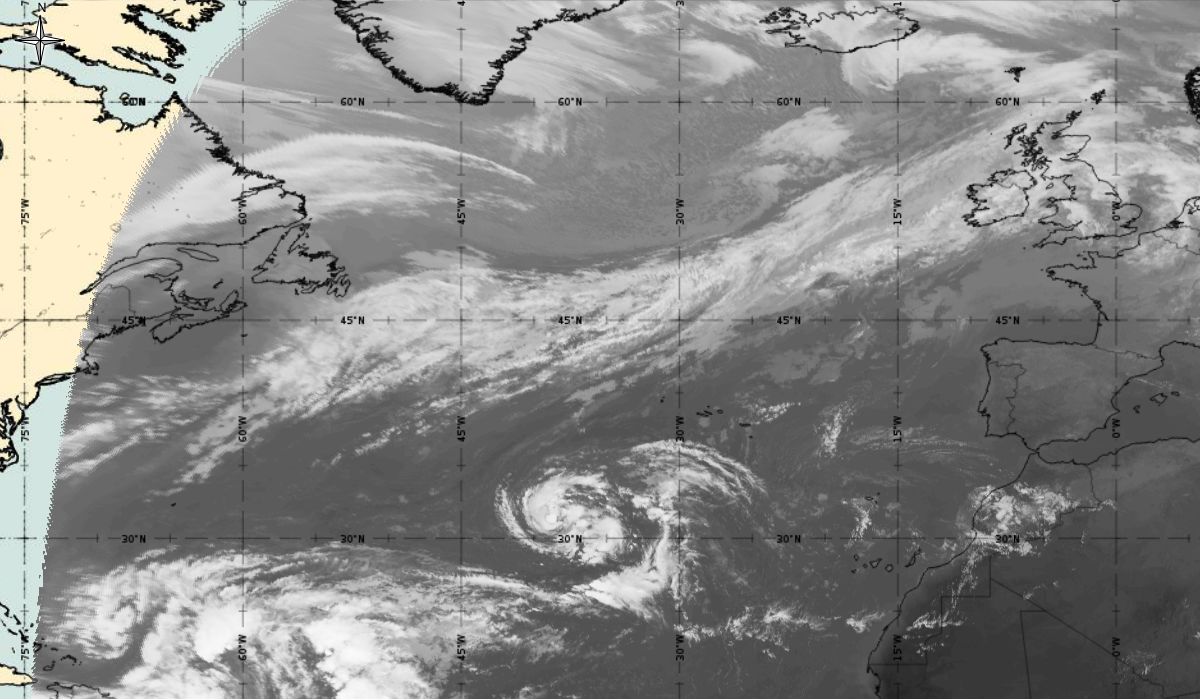
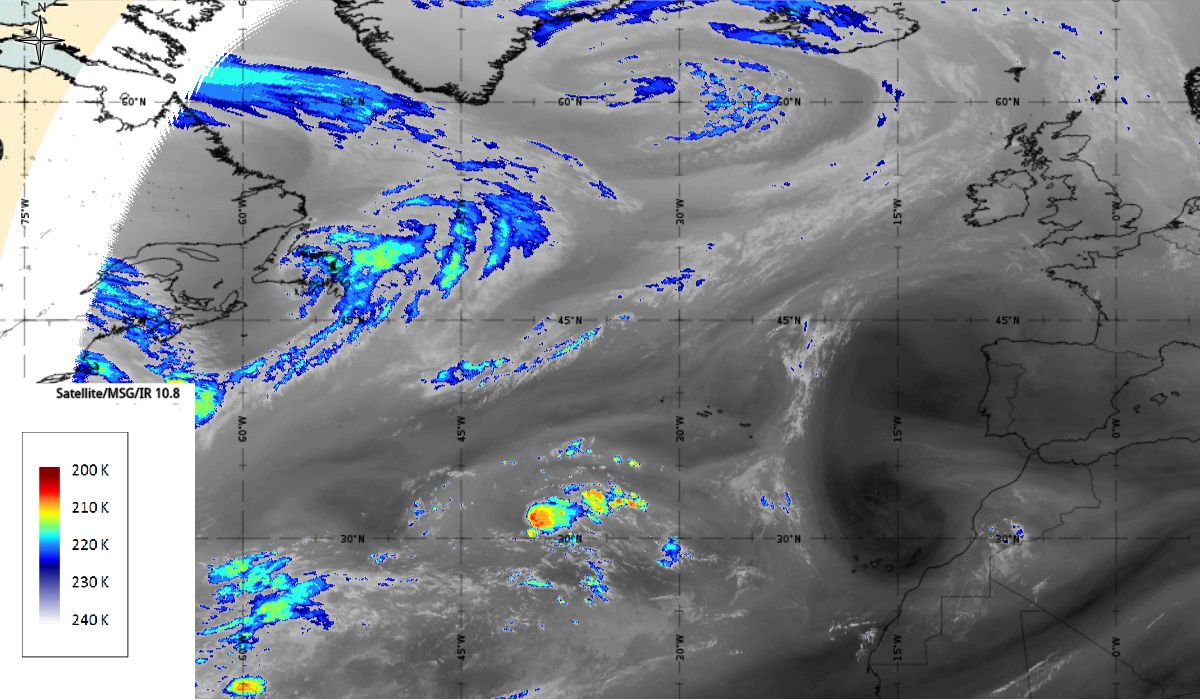
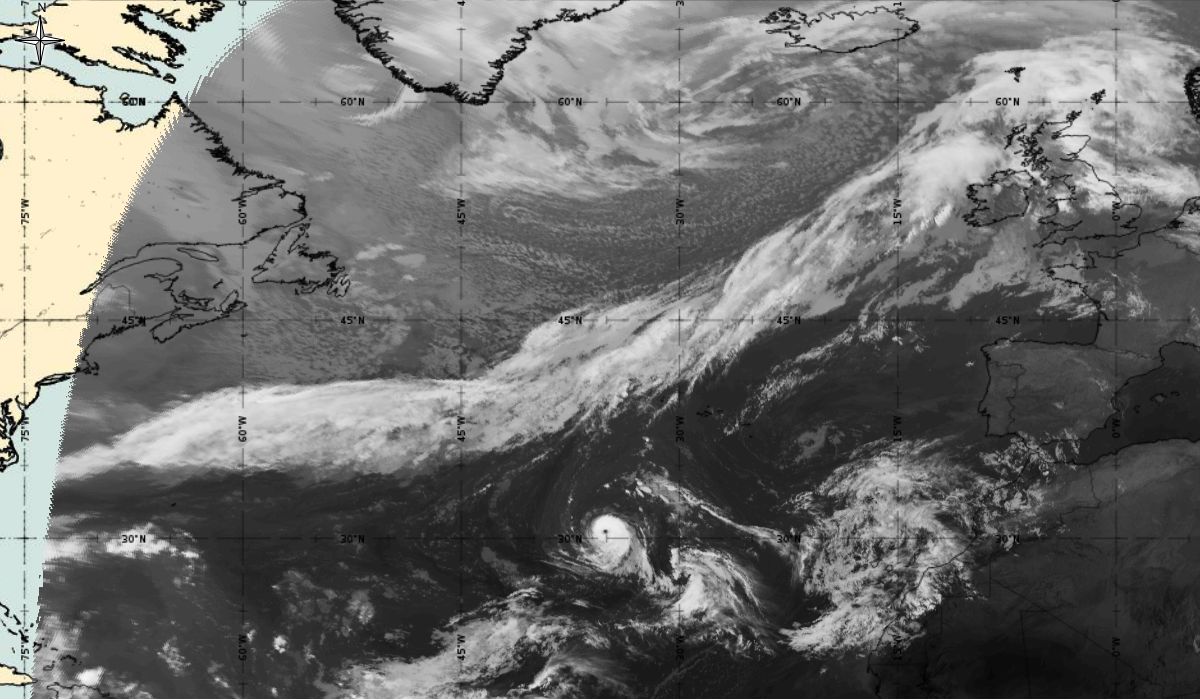
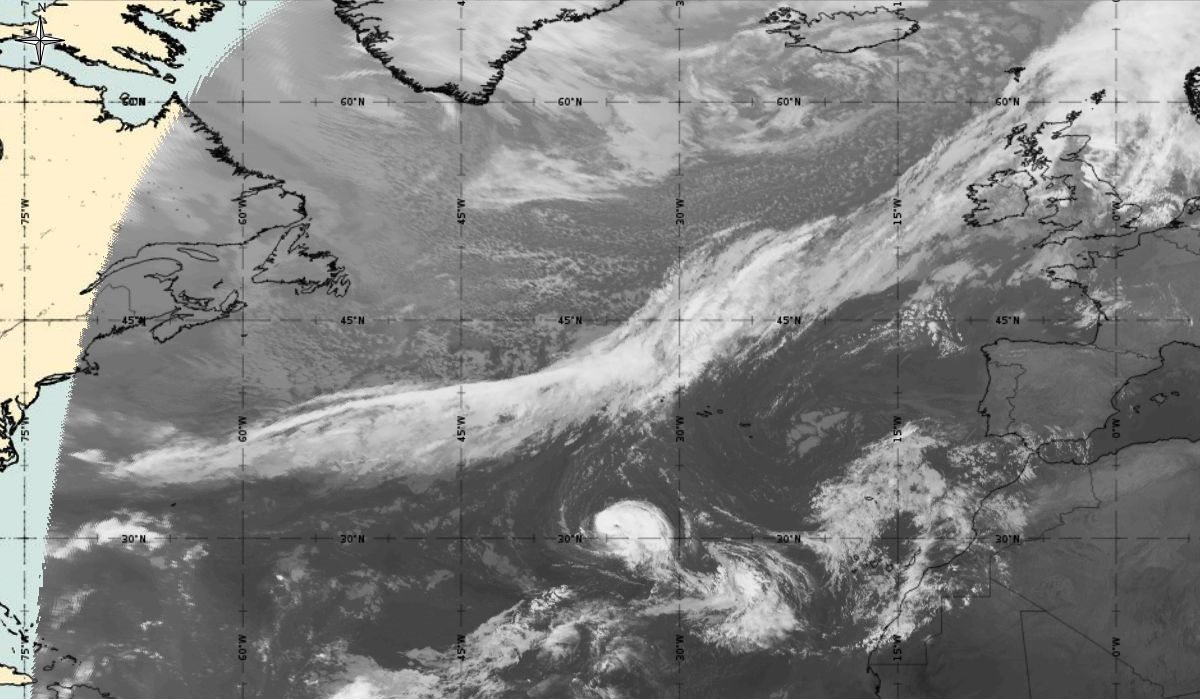
Extra information can be gained if we look at the enhanced IR 10.8 by Meteosat 10 (Figure 9). On the north side of the spiral cloud band convective development occurred with the cloud top temperature around -60 °C. The cyclonic curvature is no longer clearly visible.
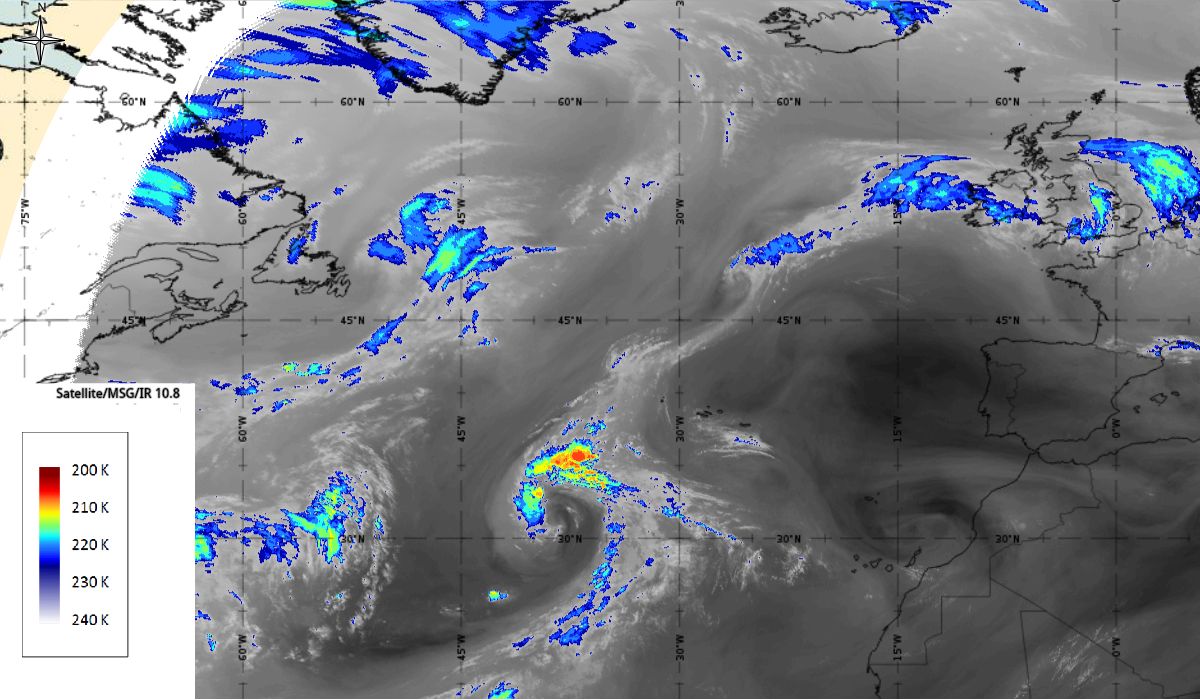
Figure 9: Meteosat 10 Enhanced IR10.8, 7th October 2017, 06:00 UTC/9th October 2017,06:00 UTC/11th October 2017,06:00 UTC (source: EUMeTrain, ePort)
Note: Click on the image to go through the gallery
If we look at Severe Storm RGB and 24-hour Microphysics RGB (Figure 10) we see the processes are intensifying and developing cyclonic properties from 8th to 10th October. Bright yellow spots at severe storm RGB image indicate thick ice cloud with small ice crystals on the top. The same structure could be seen on 24-hour Microphysics, in this case as dark red area.
|
|
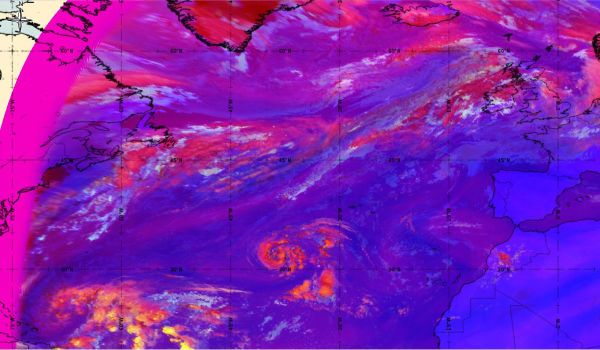
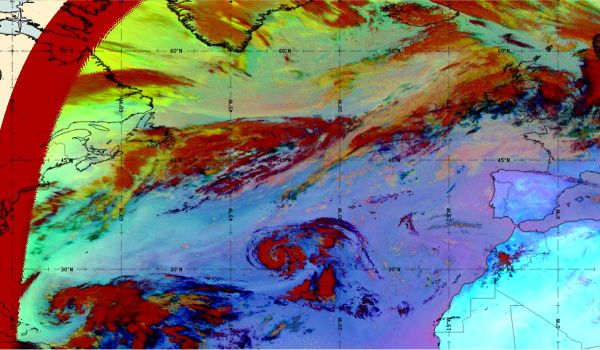
Figure 10: Severe storm RGB 10th October 2017, 12:00 UTC/24-hour Microphysics RGB (source: EUMeTrain, ePort)
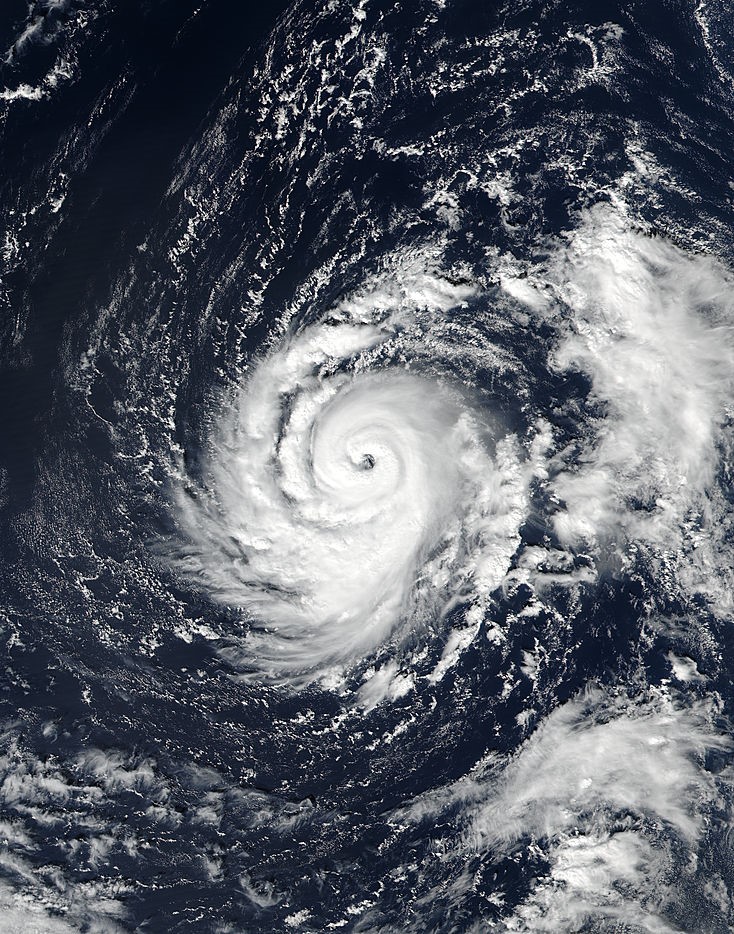
Tropical storm at the full stage of development can be seen at MODIS satellite image (Figure 11).
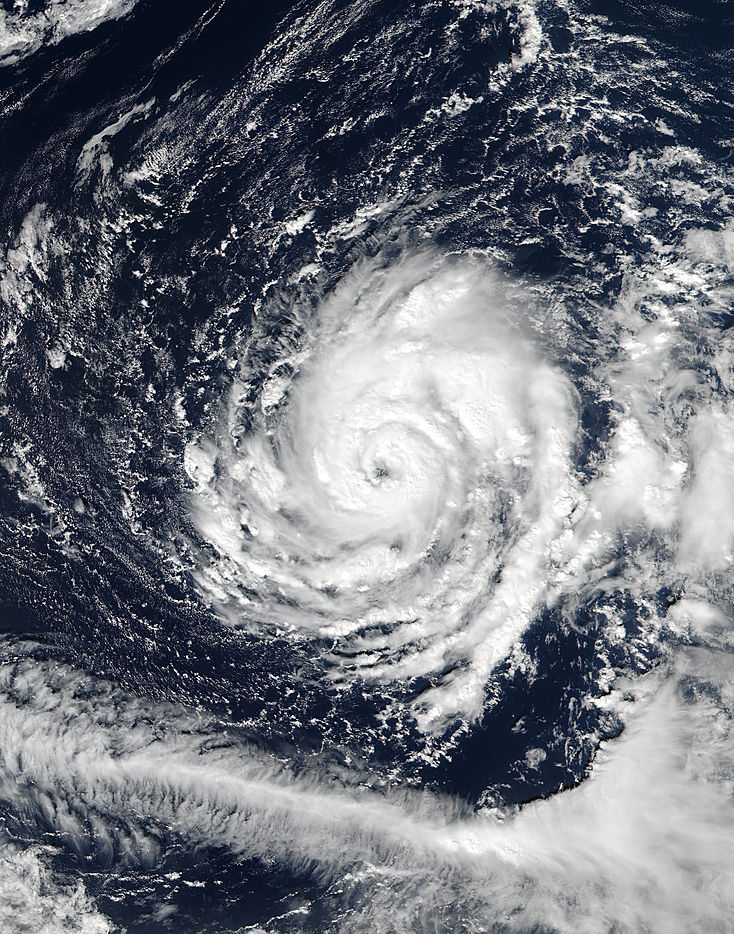
Figure 11: MODIS satellite image (true colour) of tropical storm Ophelia on 11th October 2017, approximately at 16:00 UTC (source: NASA)
Wind speed
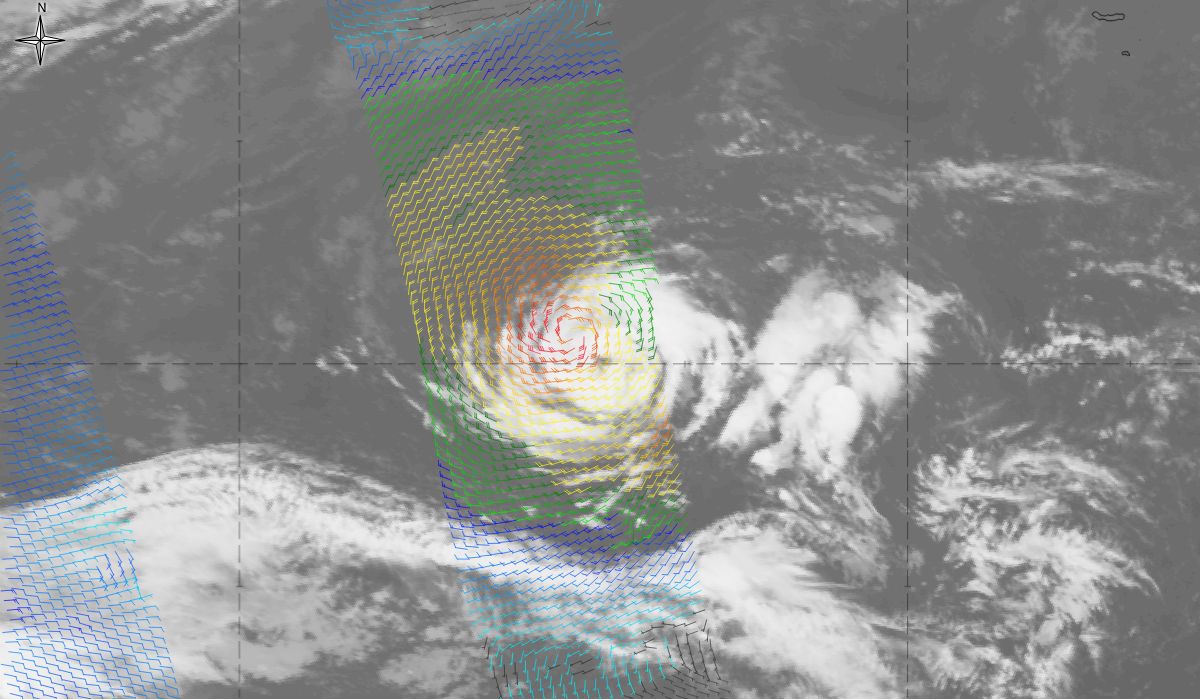
An ASCAT overpass in the region of interest gives the wind speed over the storm Figure 12. This data reveals gale winds (30 kt-orange colour) over a large area, and up to 45 kt (red colour) near the centre of the storm.
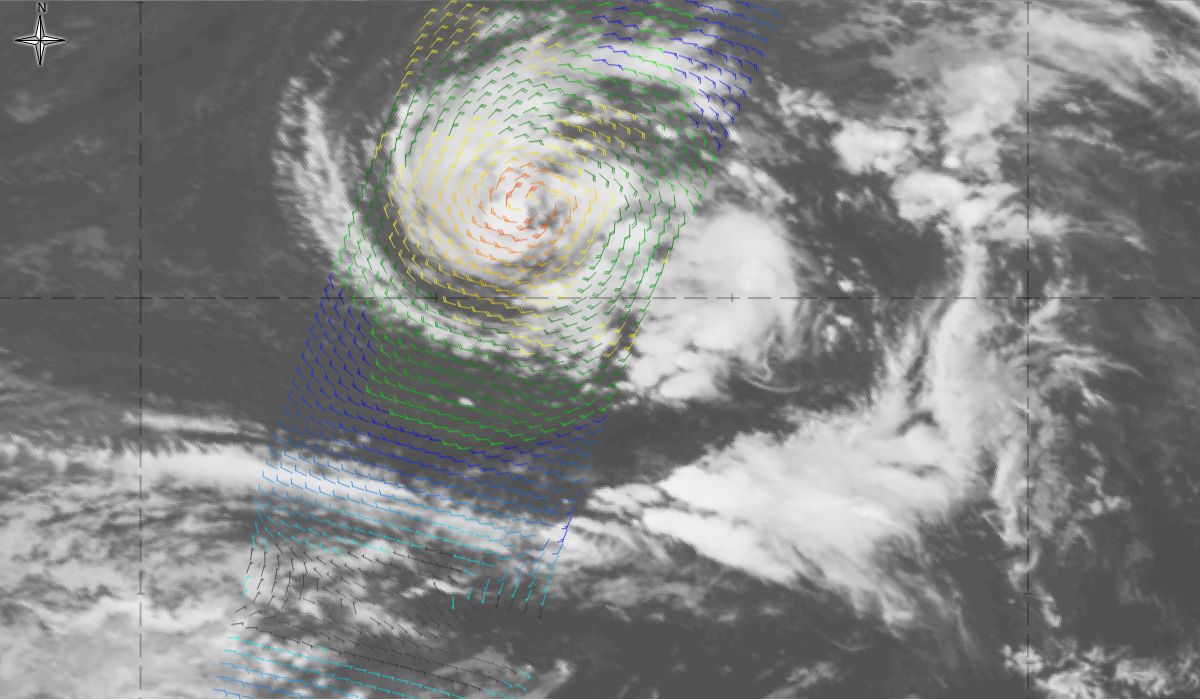
Figure 12: Meteosat 10 IR 10.8 overlaid with ASCAT wind (colour wind barbs) from 10th October 2017, 18:00 UTC to 11th October 2017, 18:00 UTC (source: EUMeTrain, ePort)
Note: Click on the image to go through the gallery
Height of PV=1,5; WV images
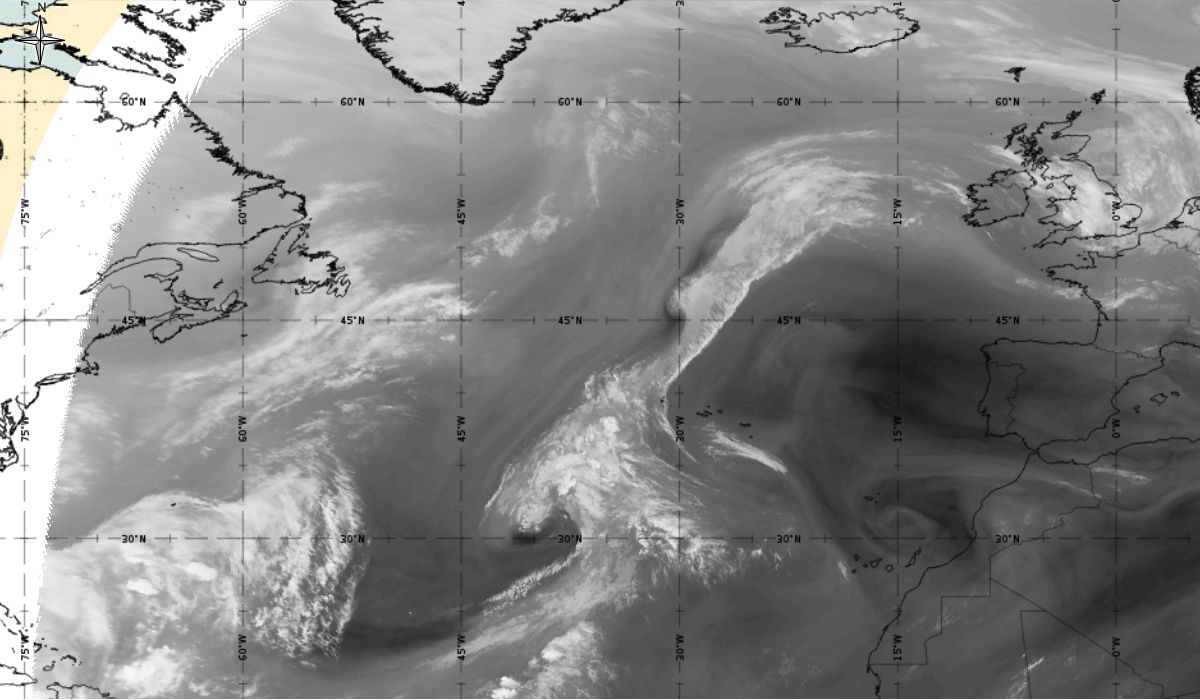
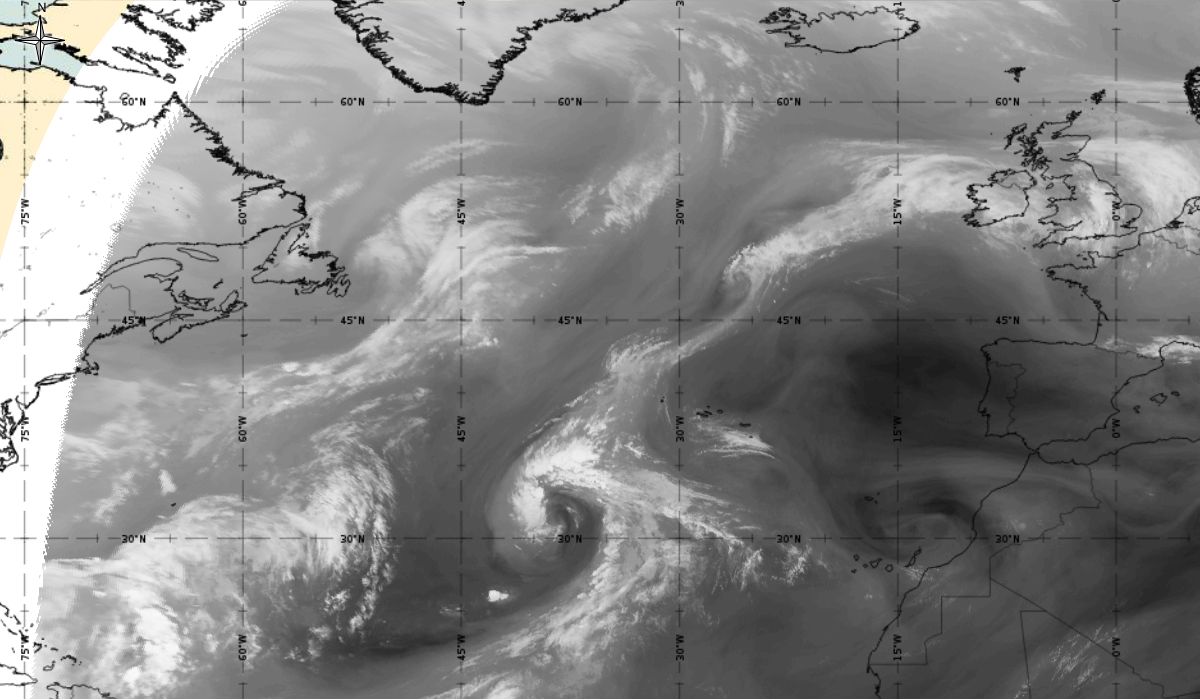
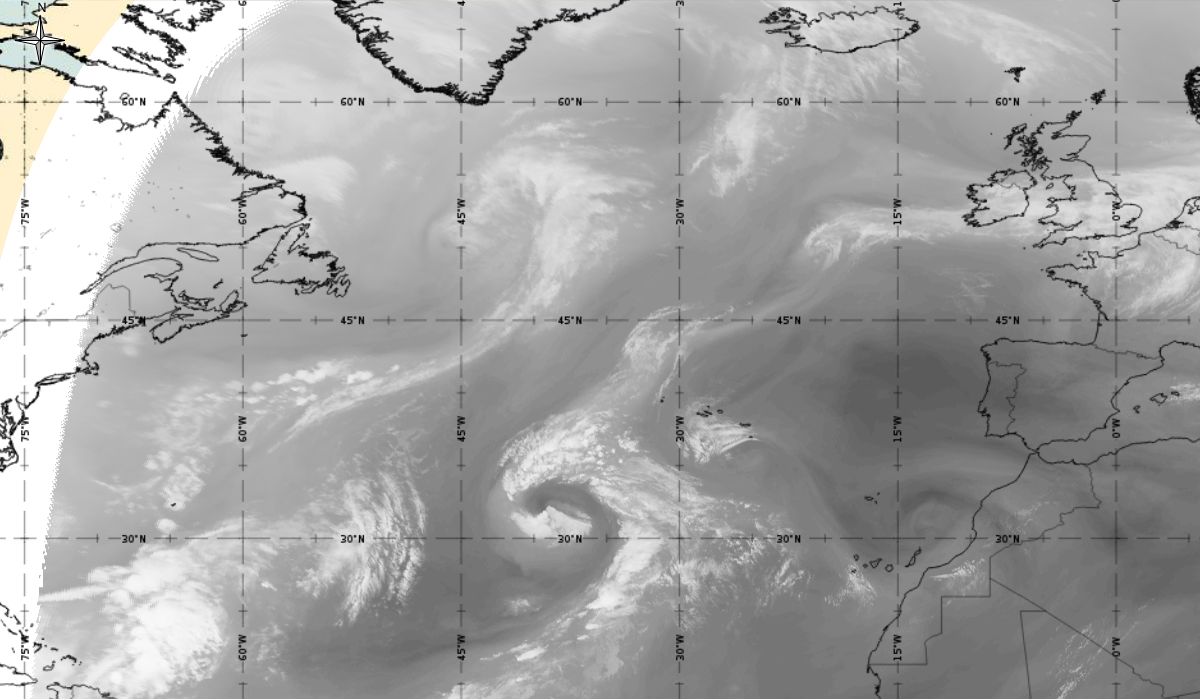
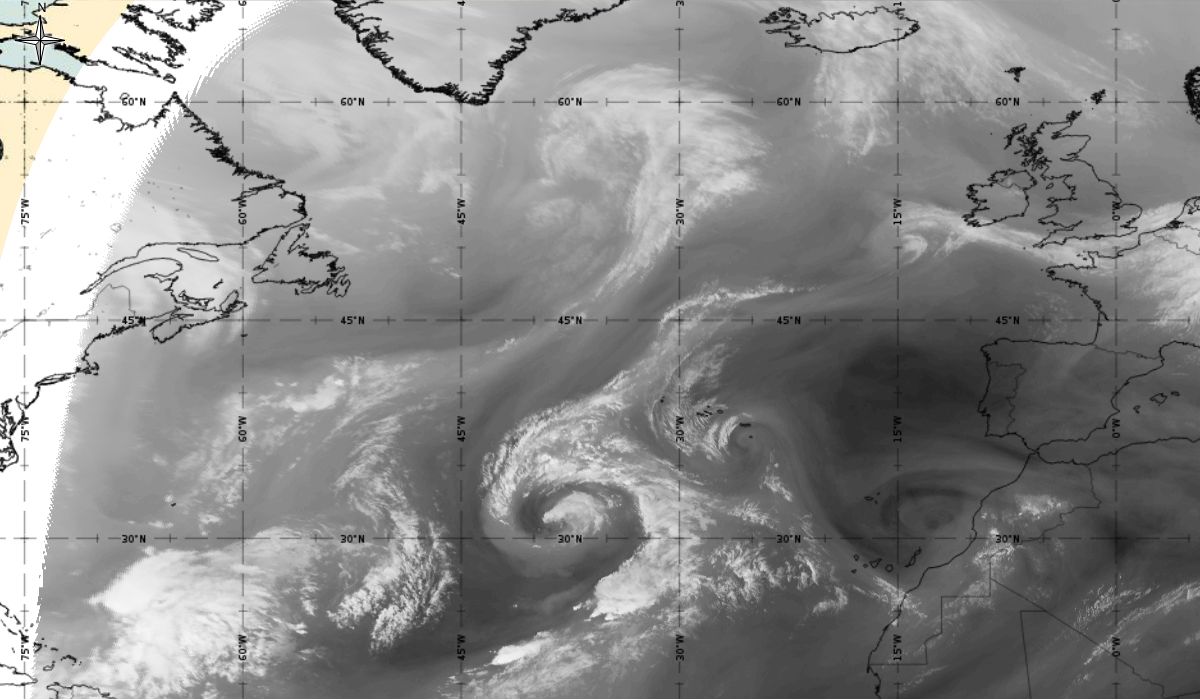
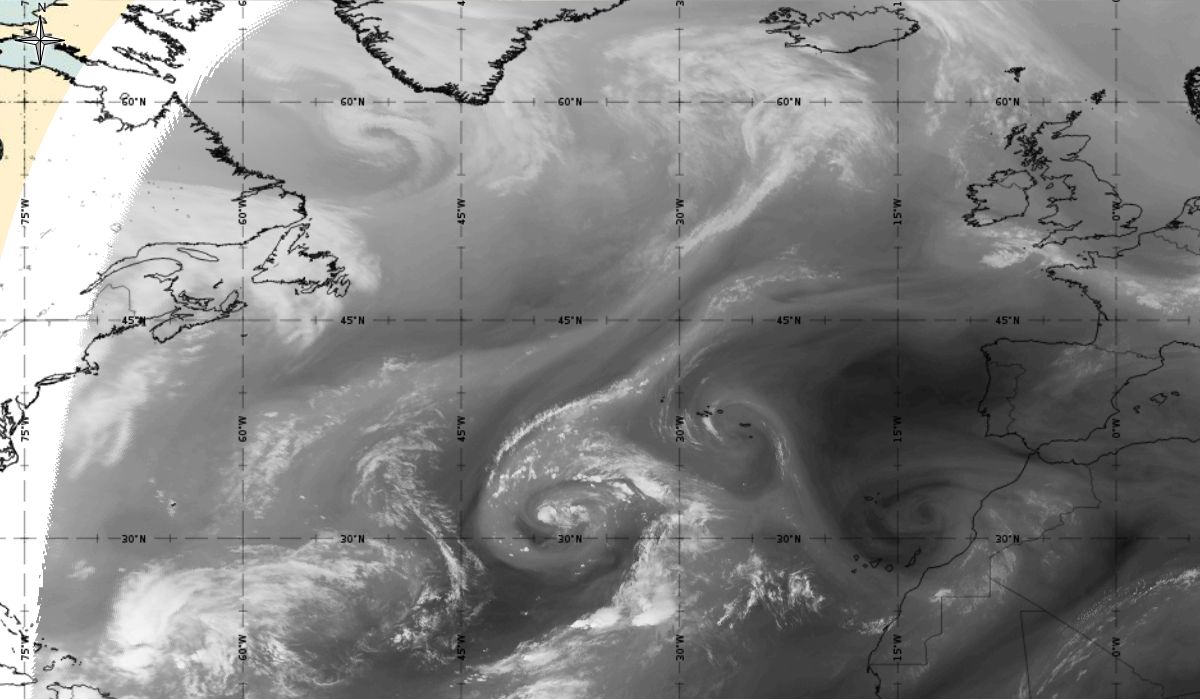
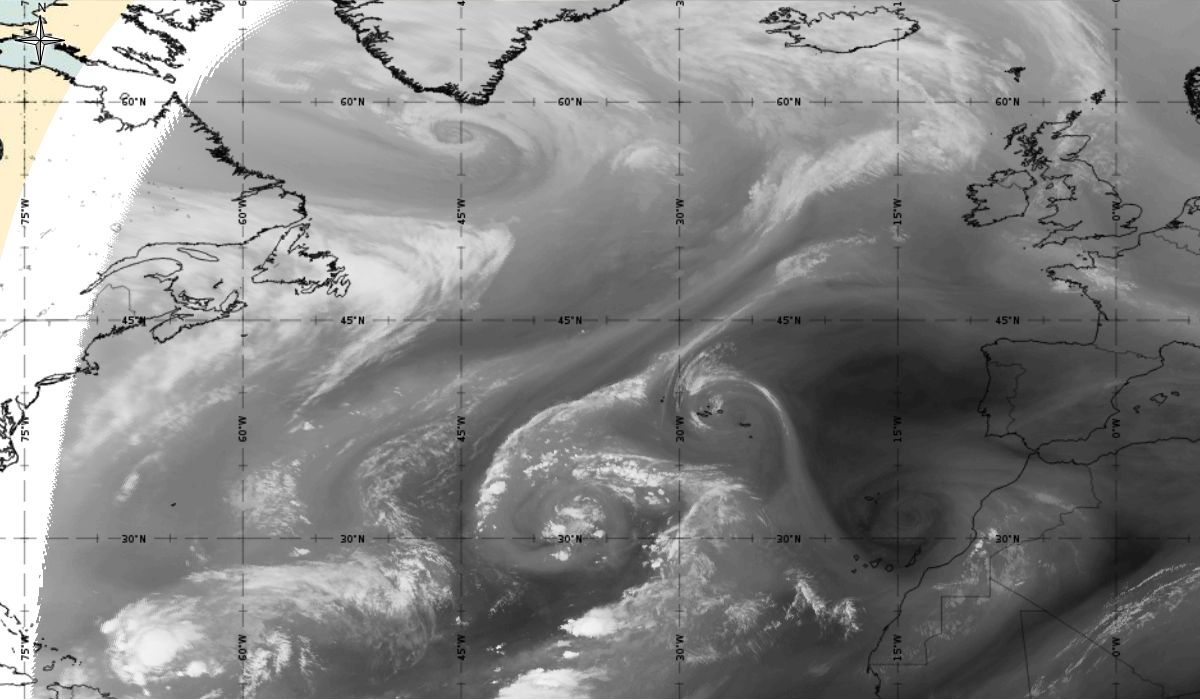
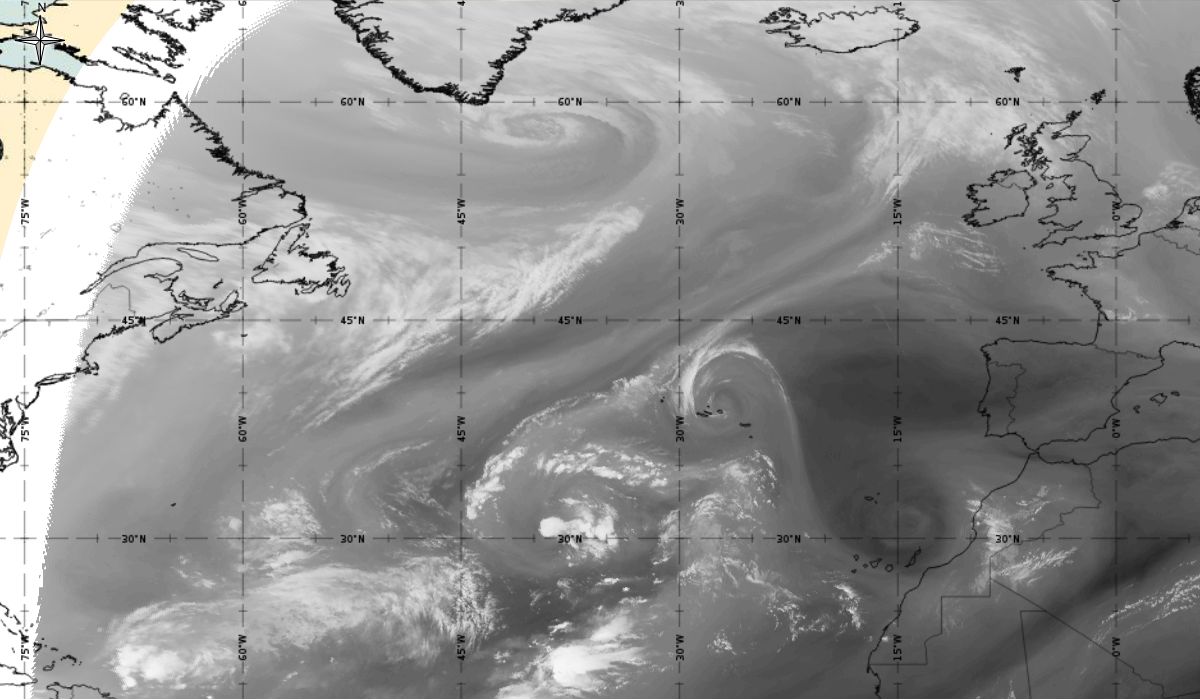
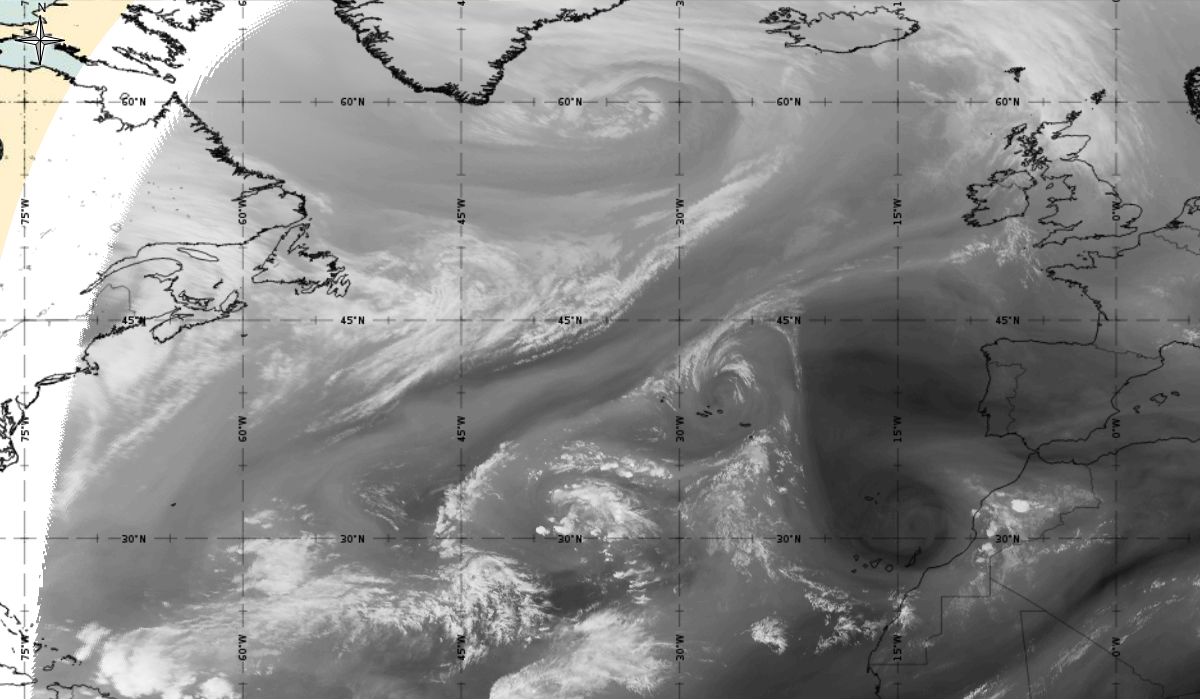
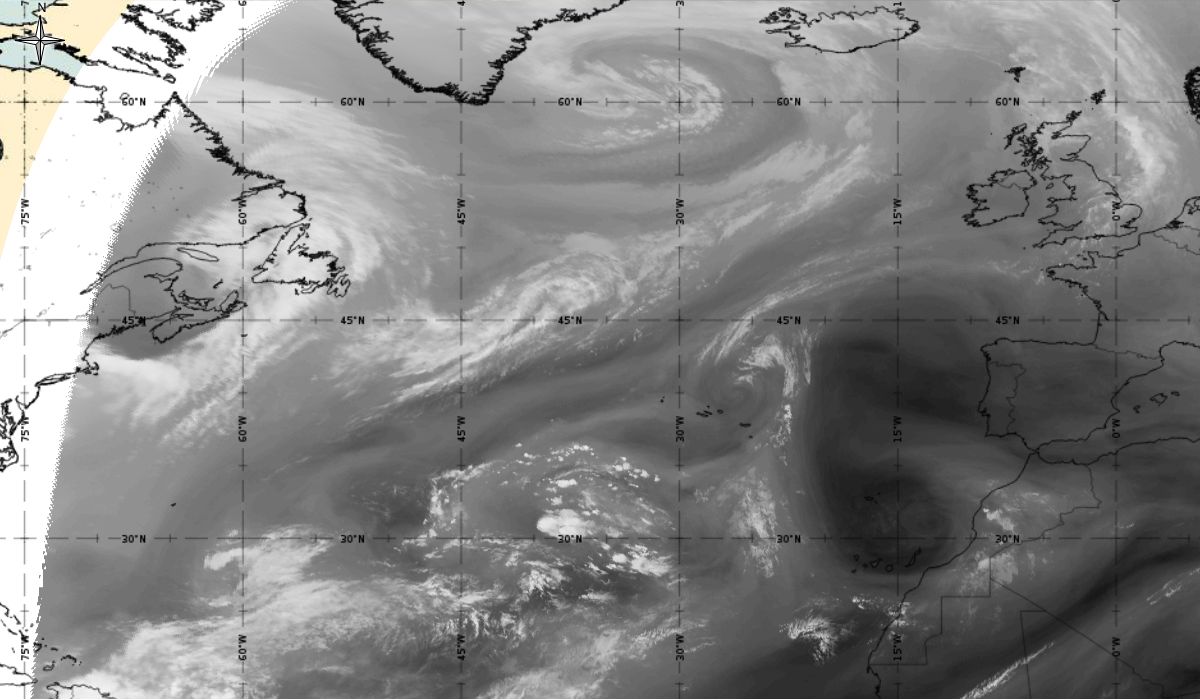
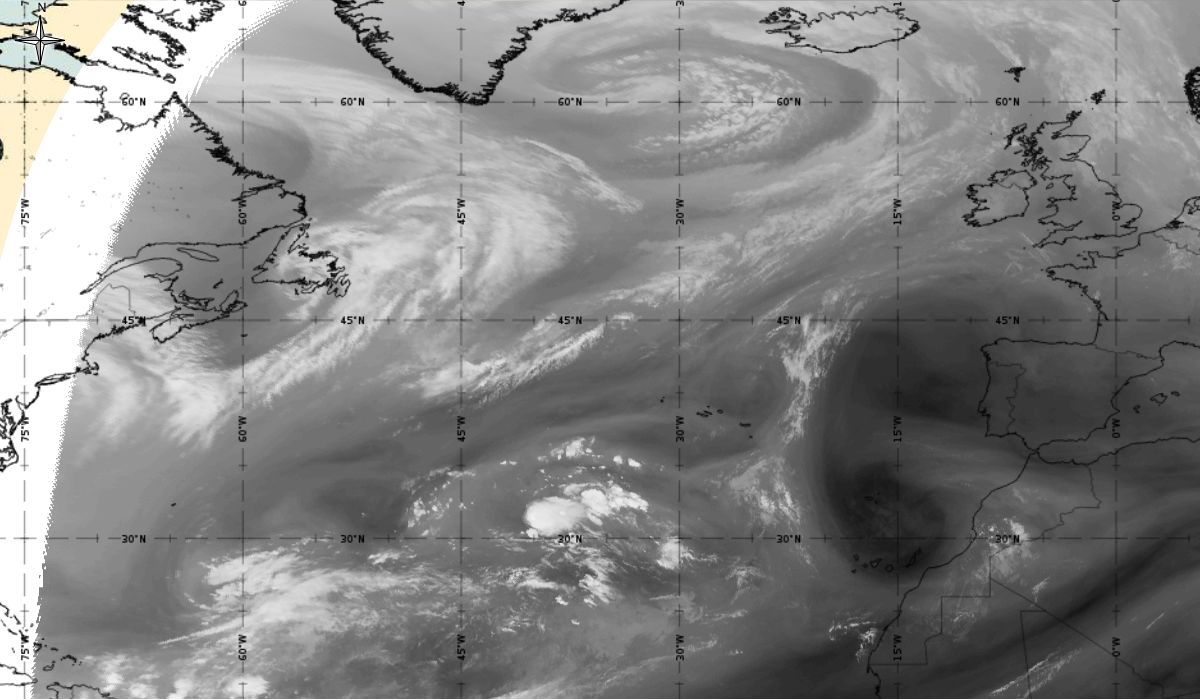
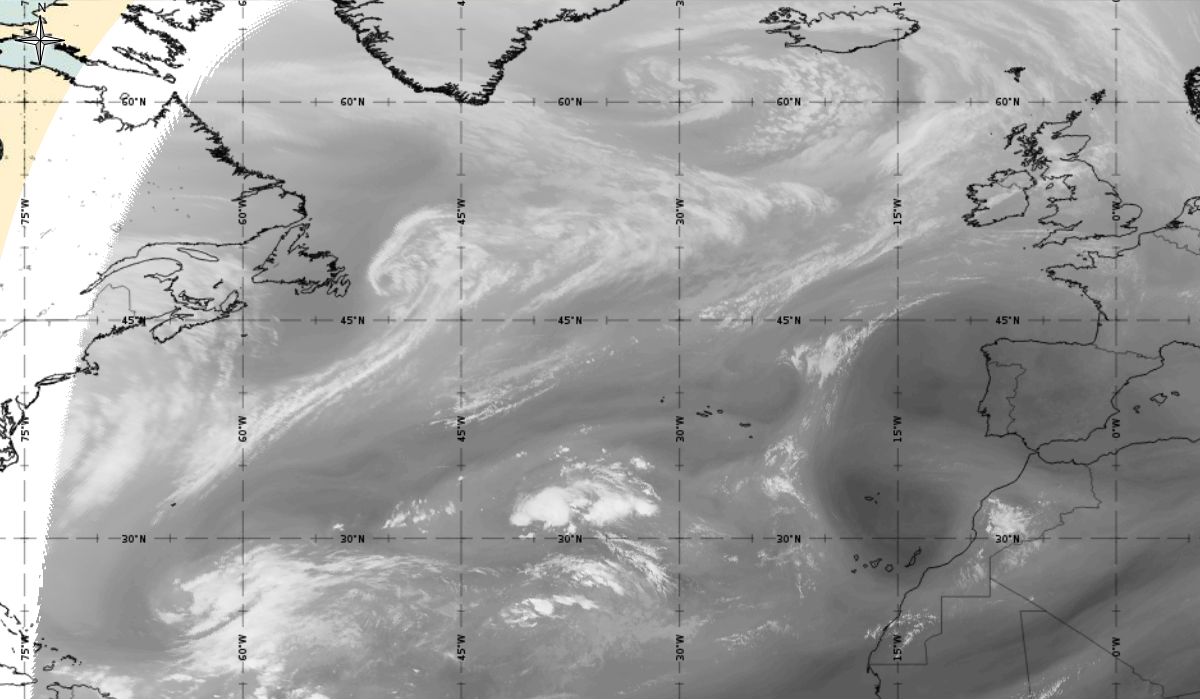
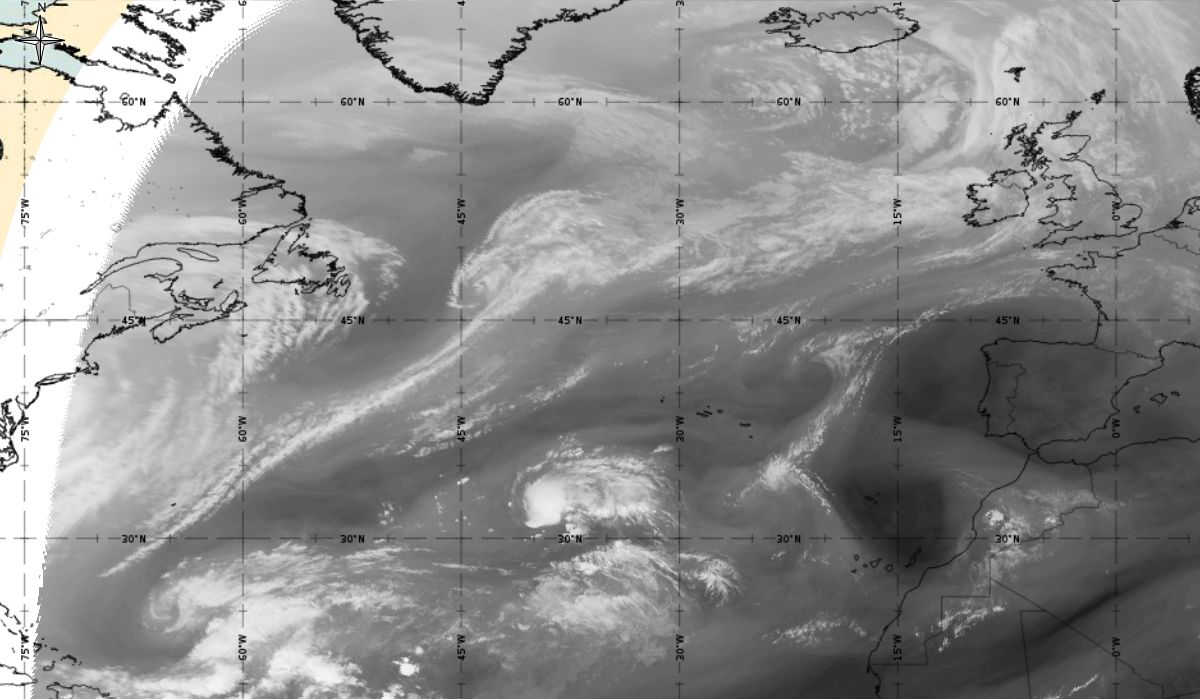
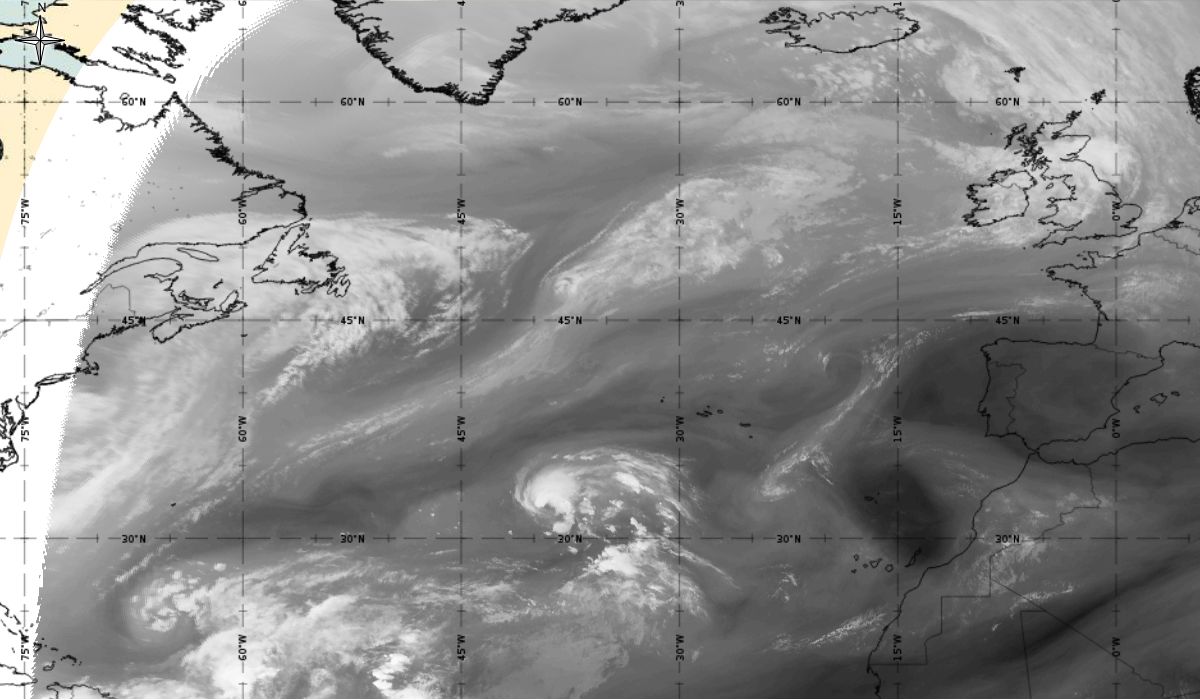
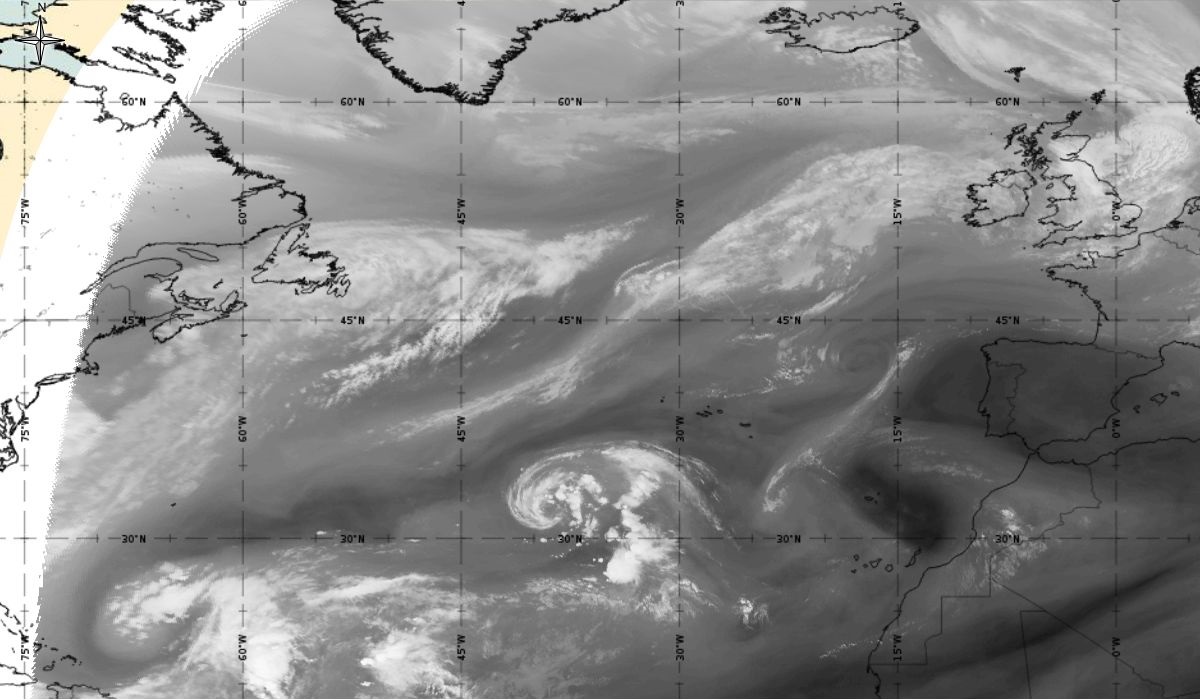
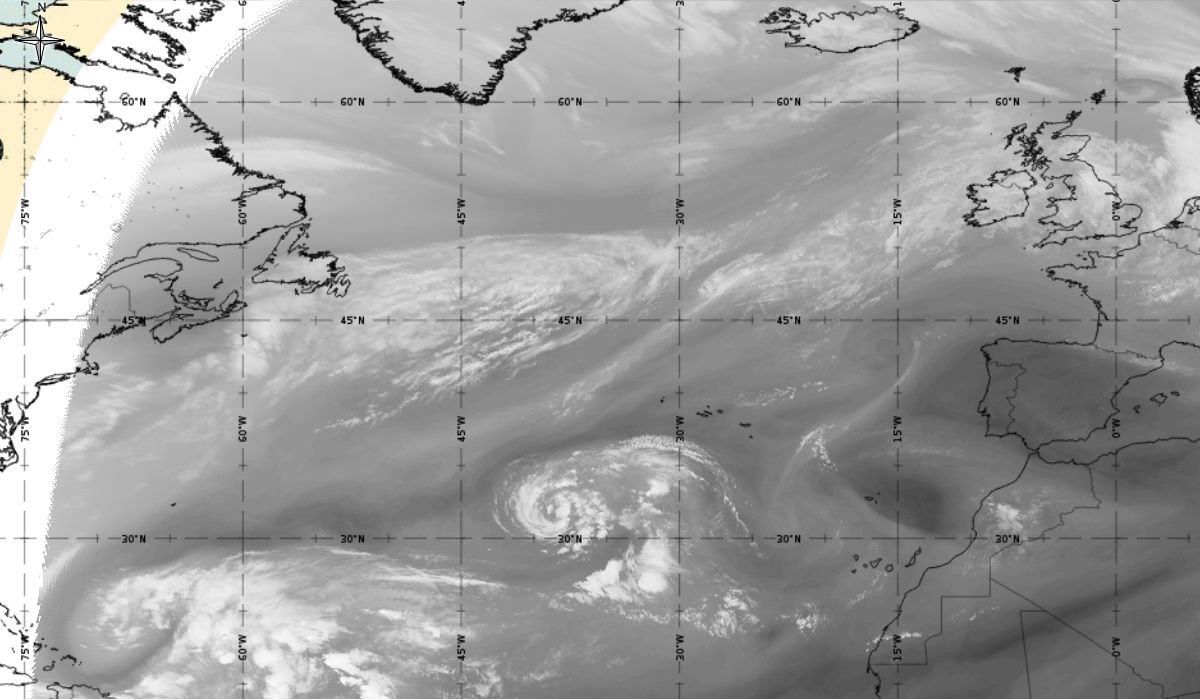
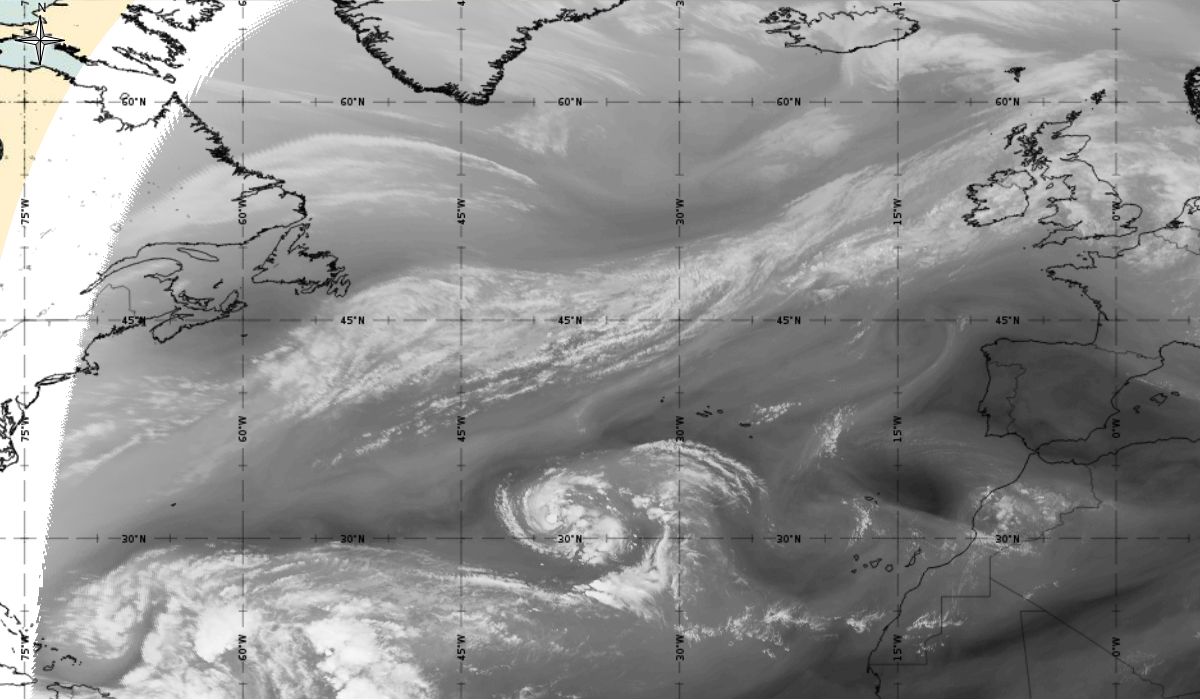
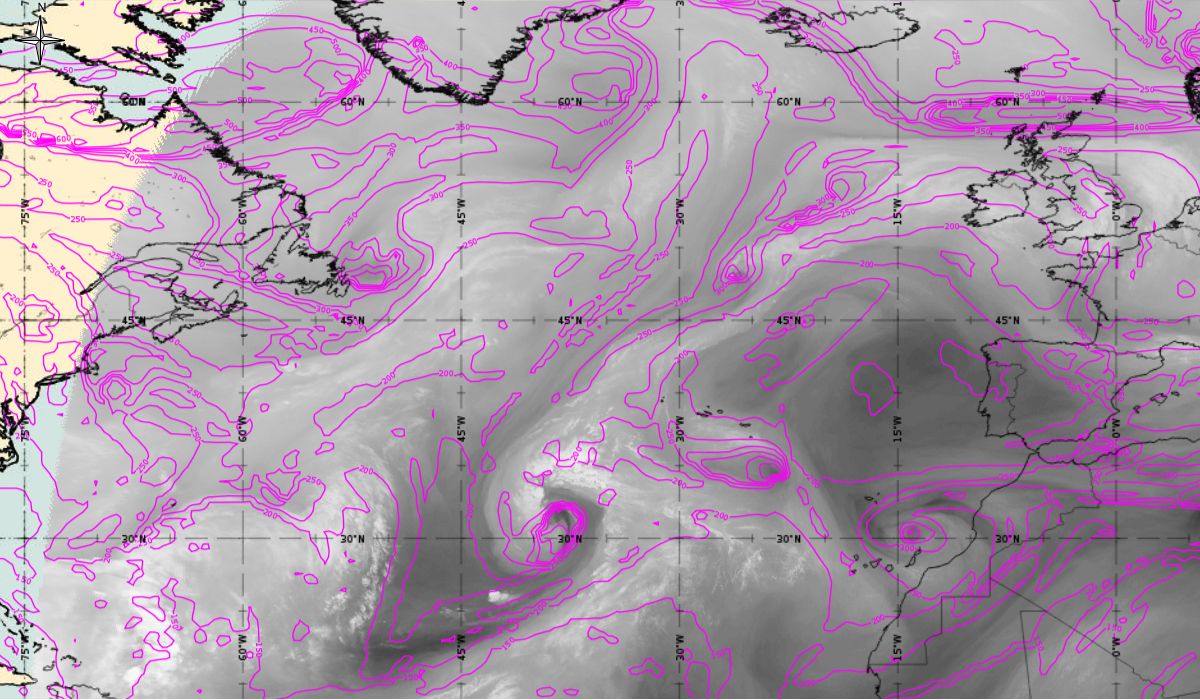
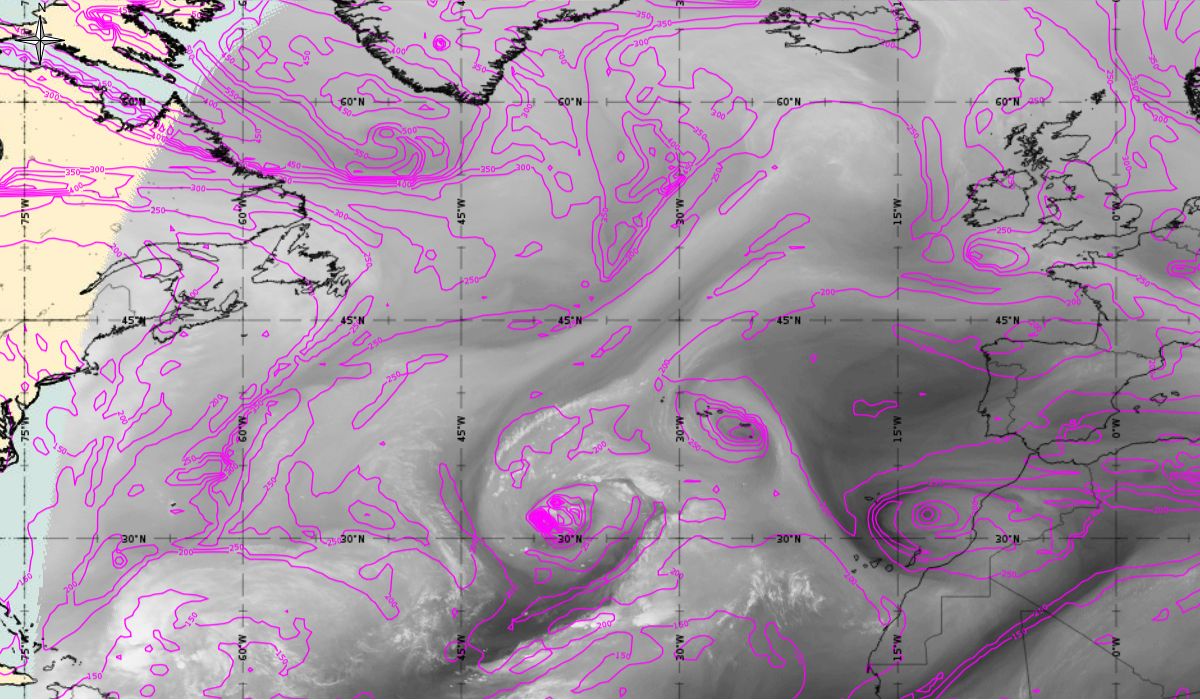
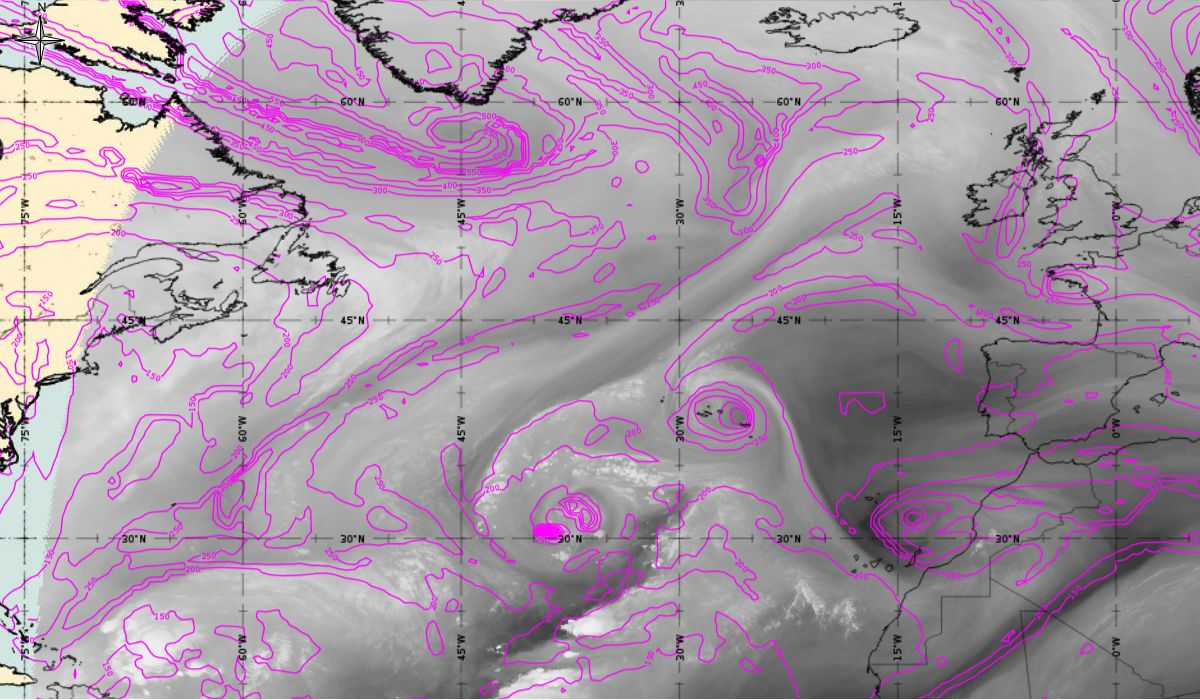
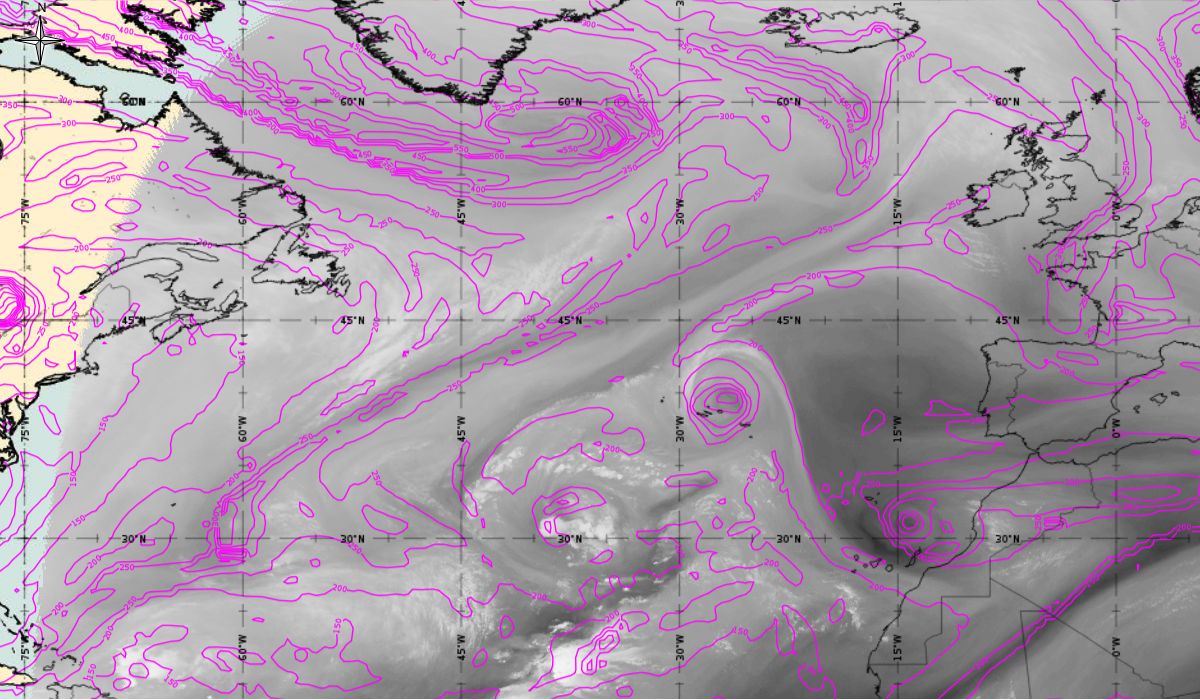
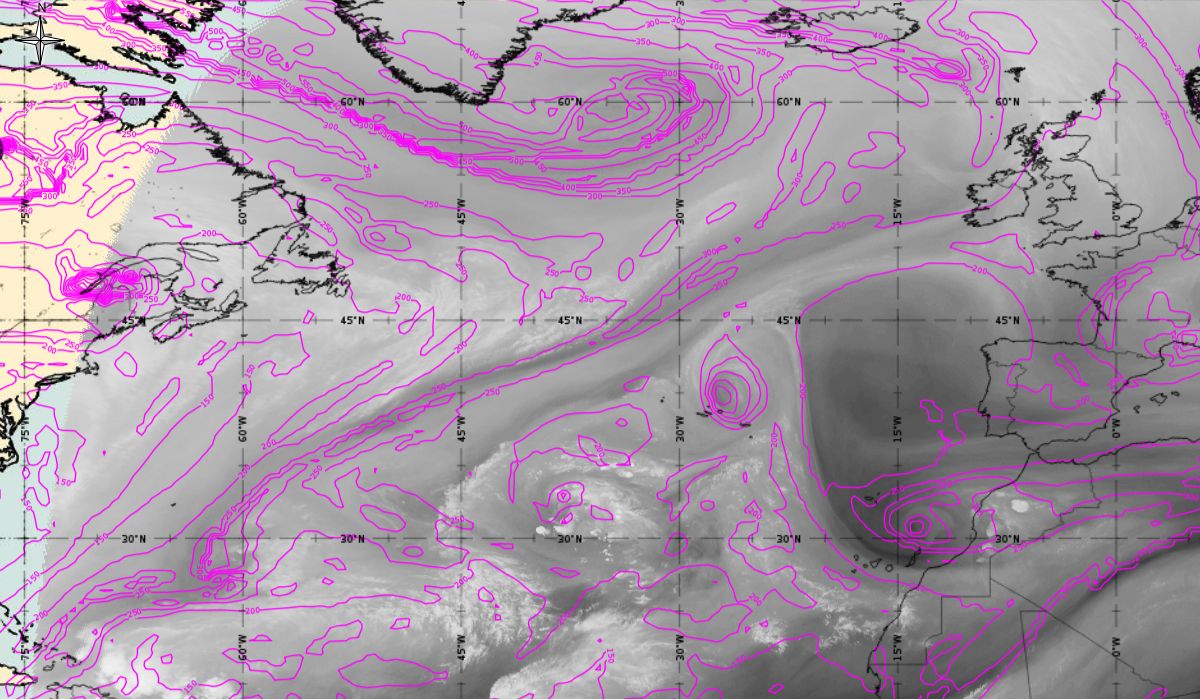
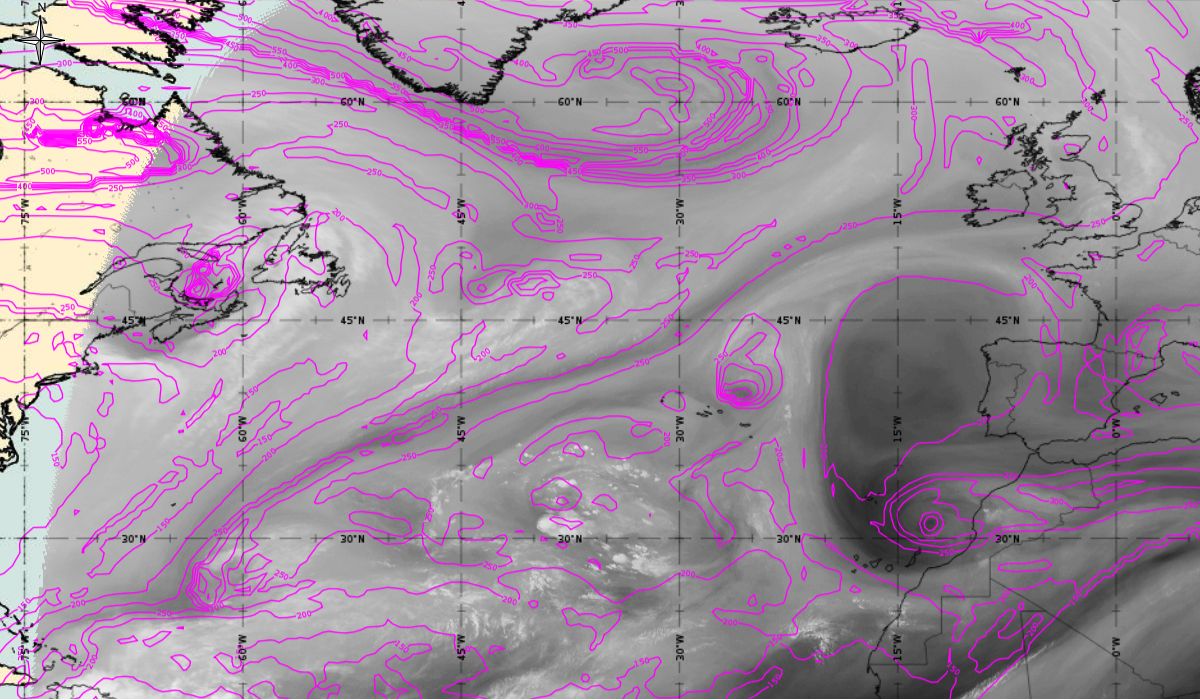
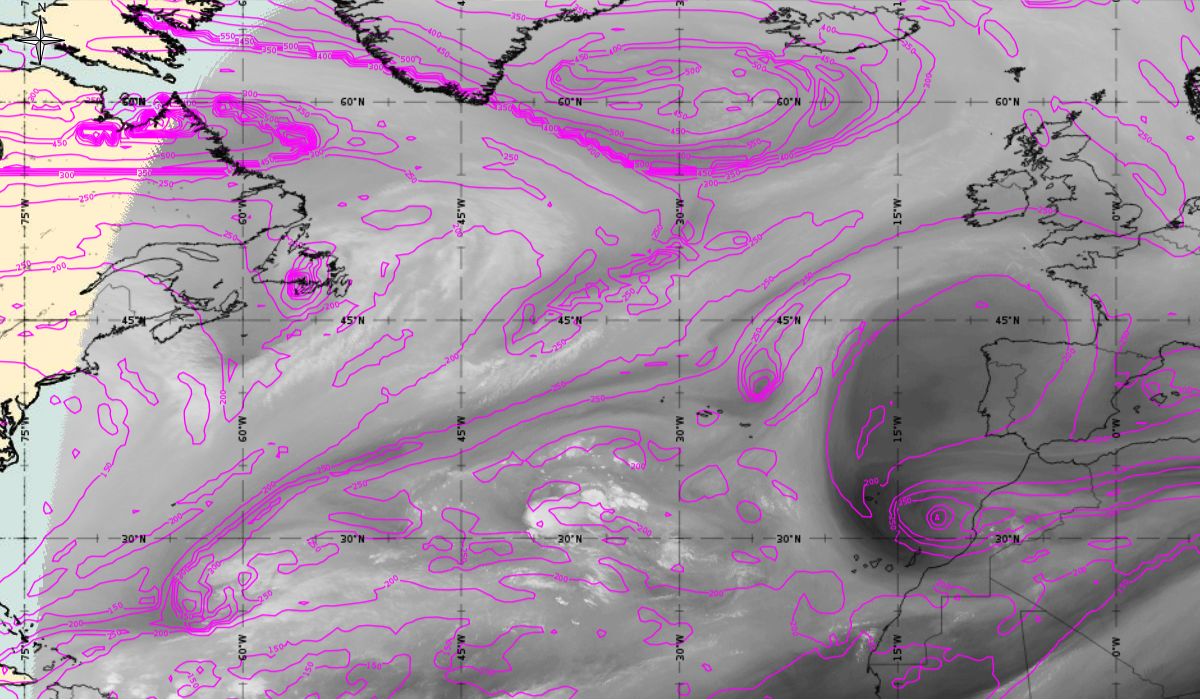
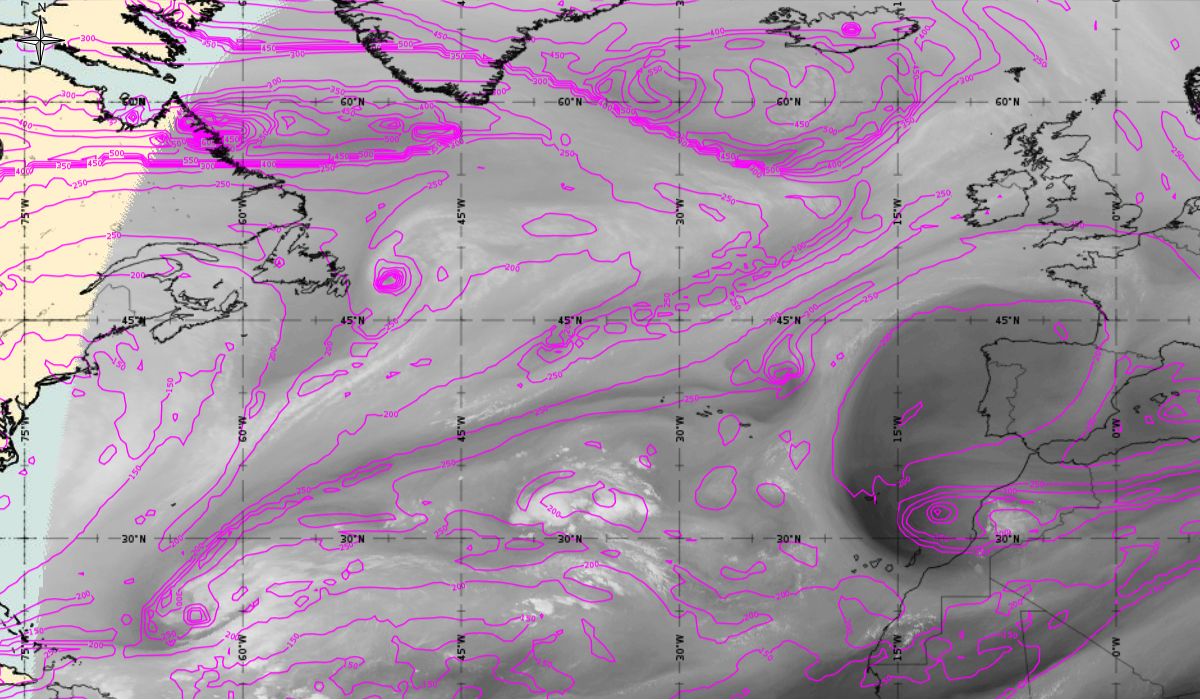
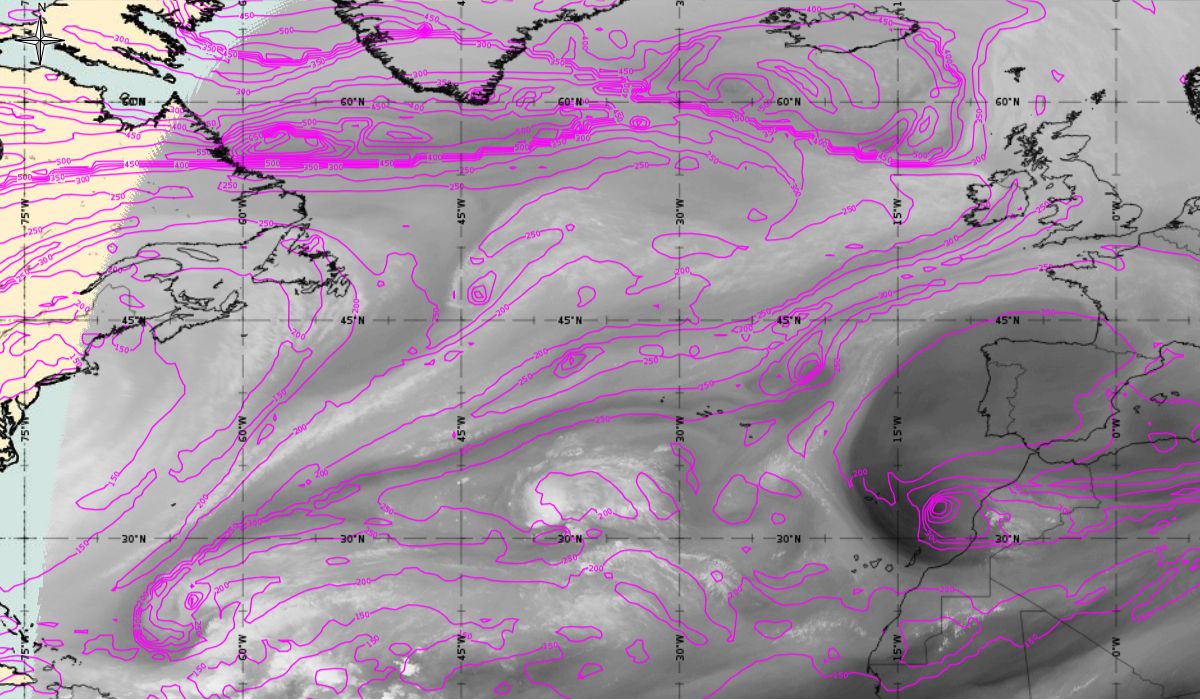
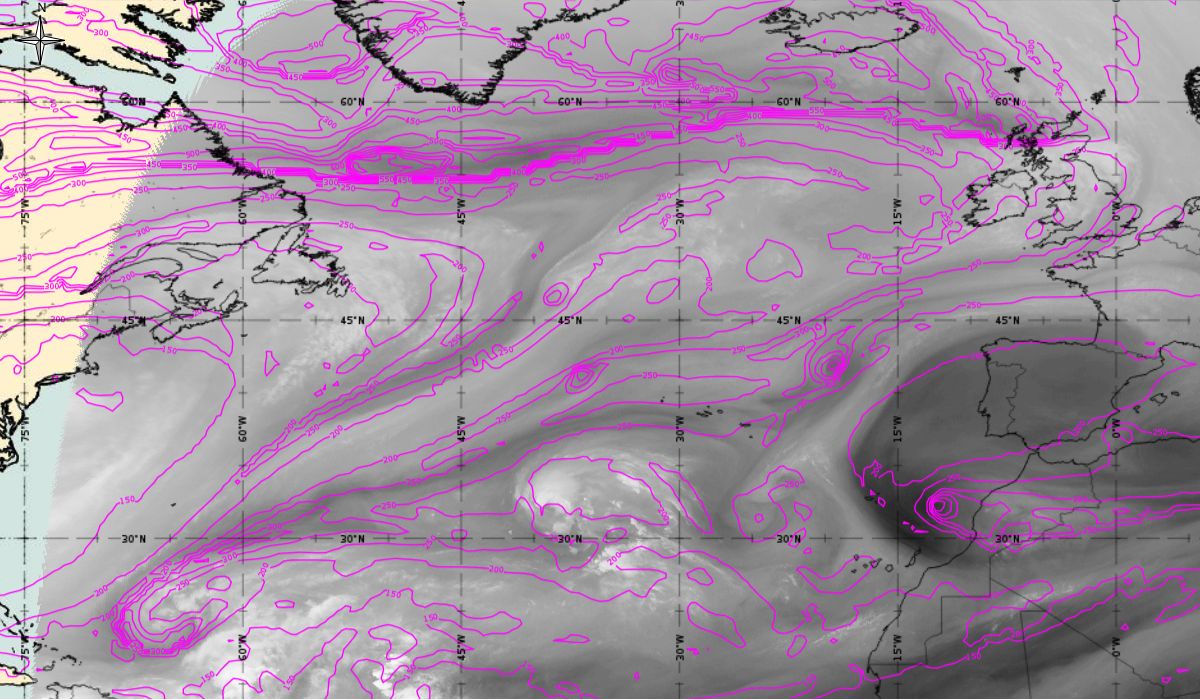
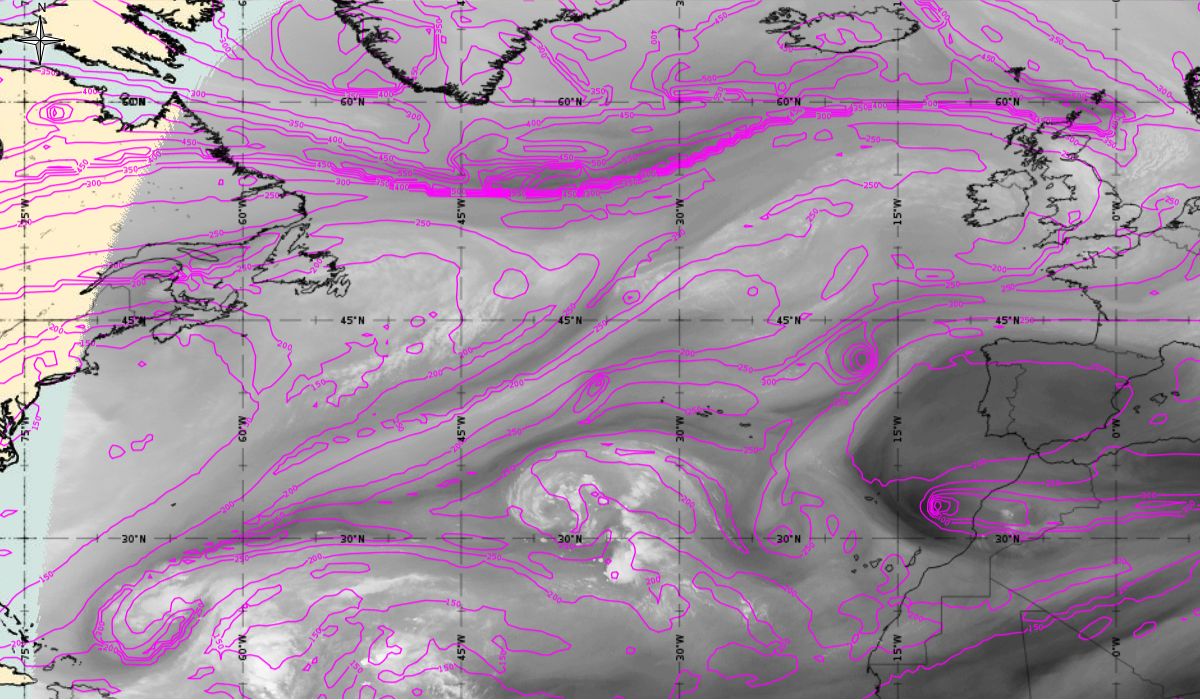
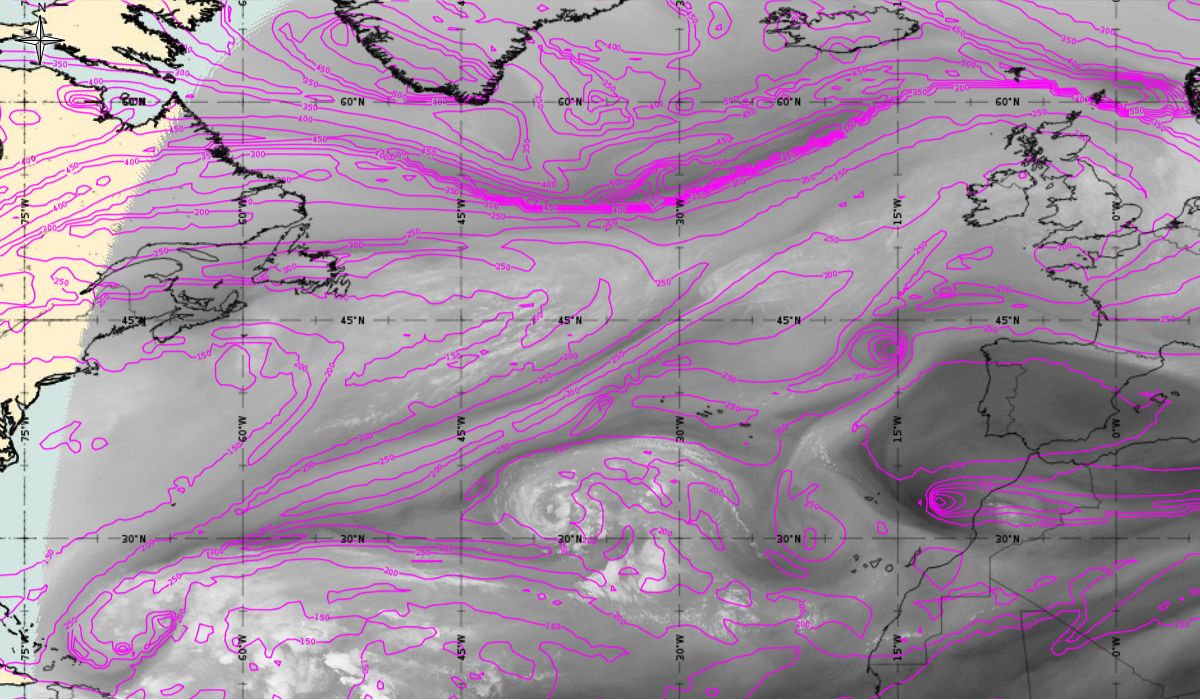
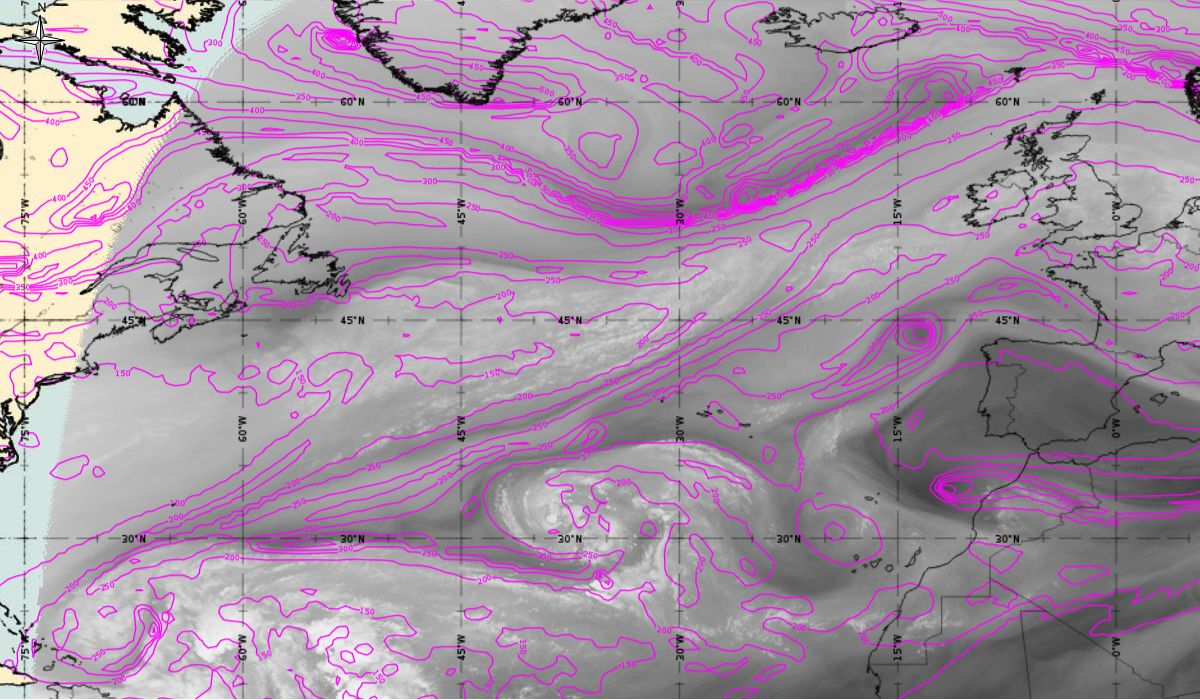
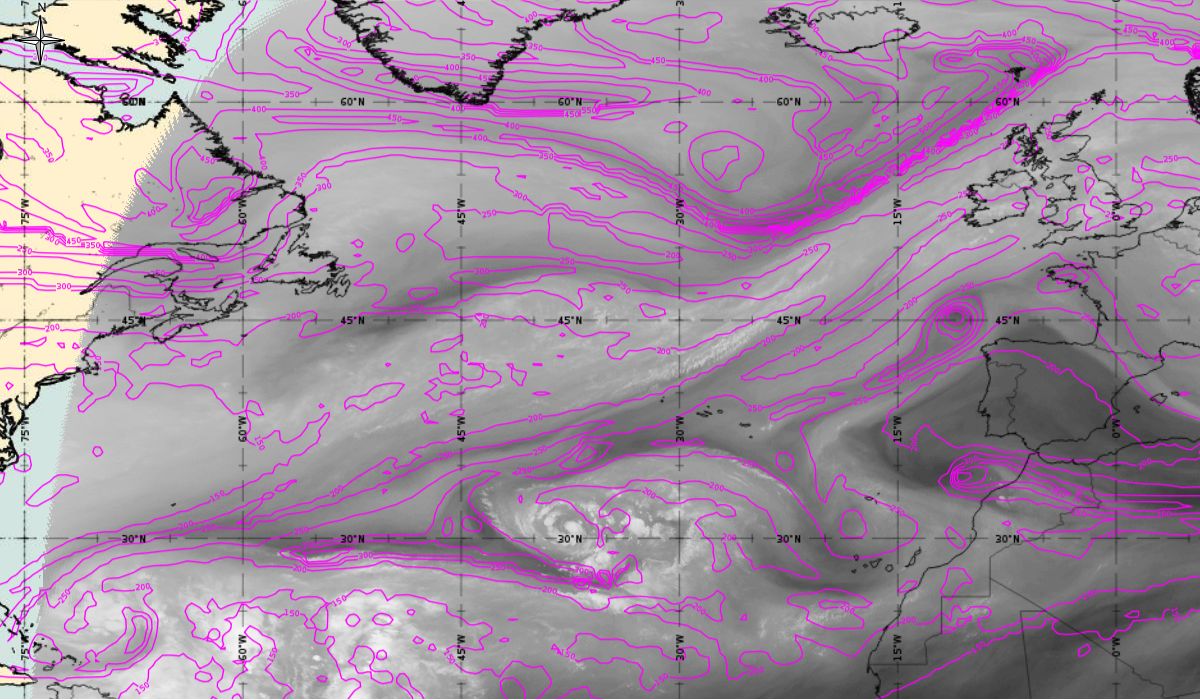
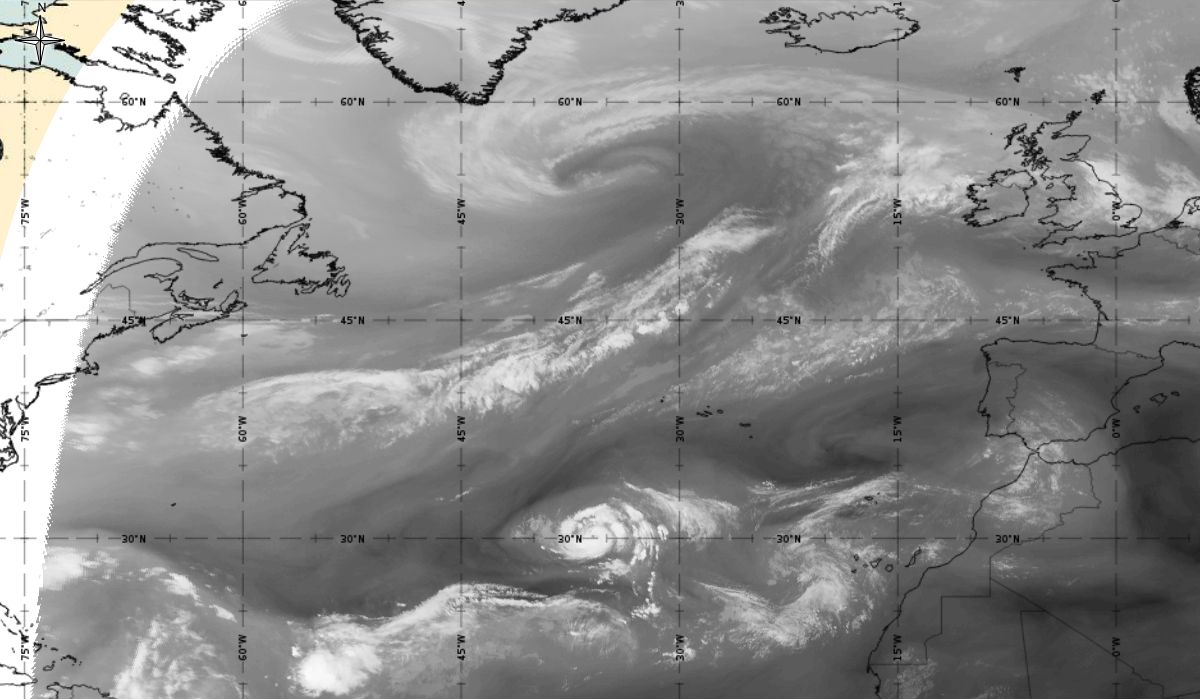
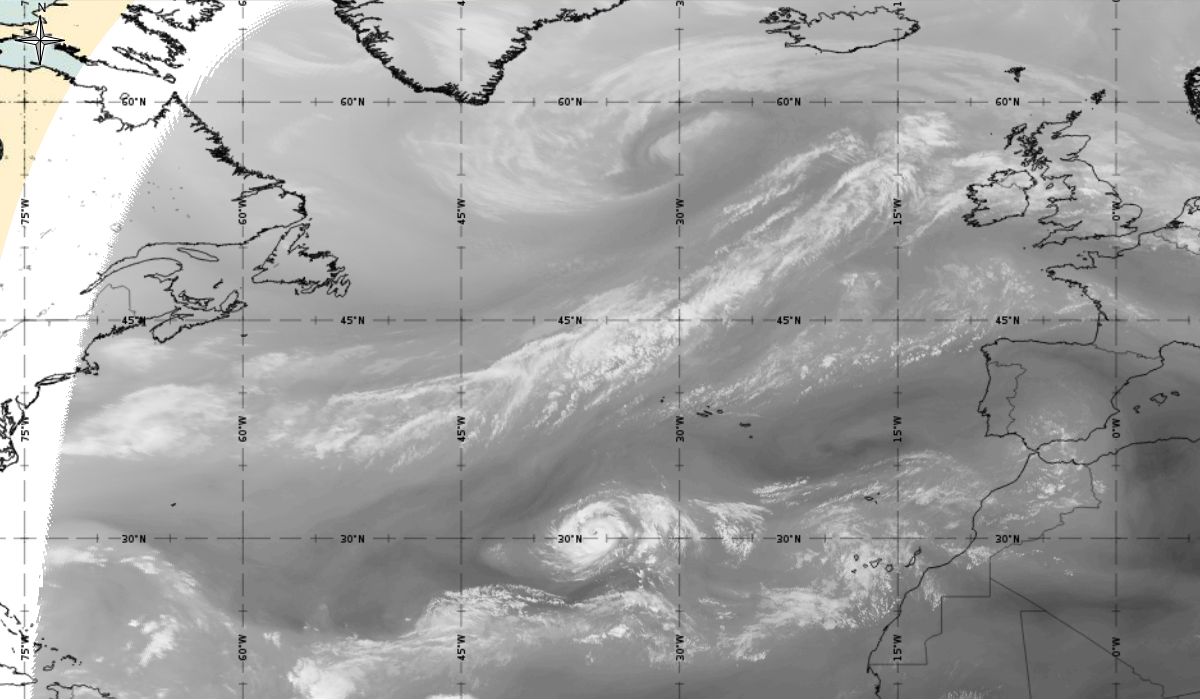
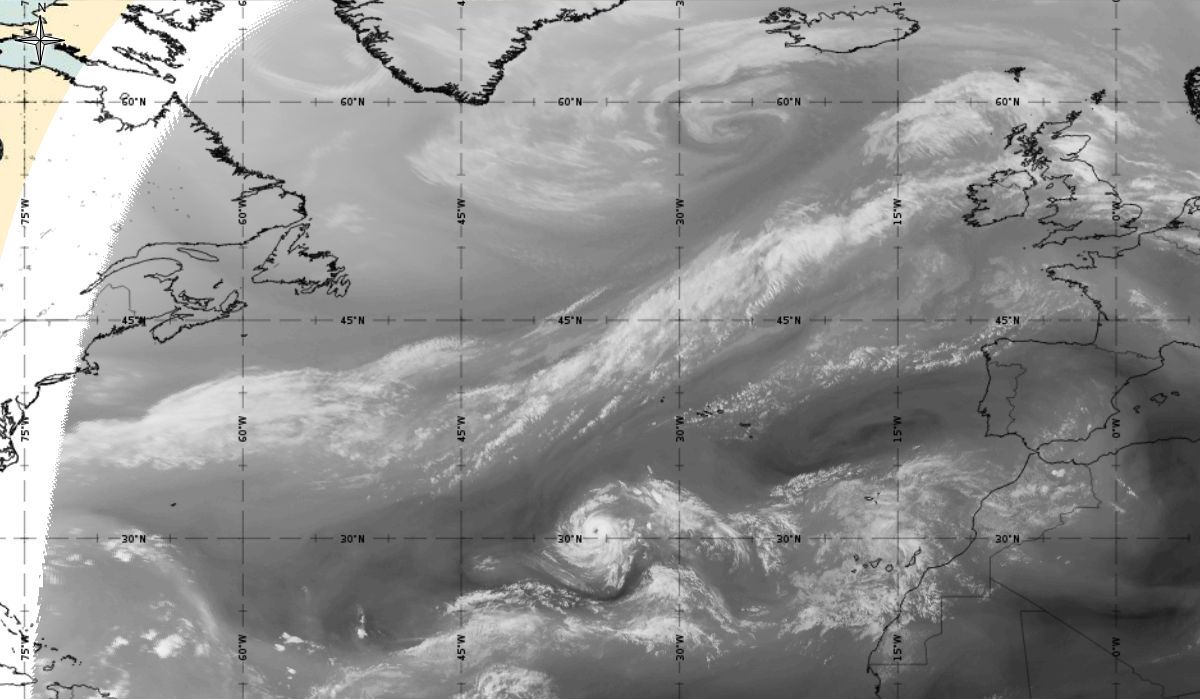
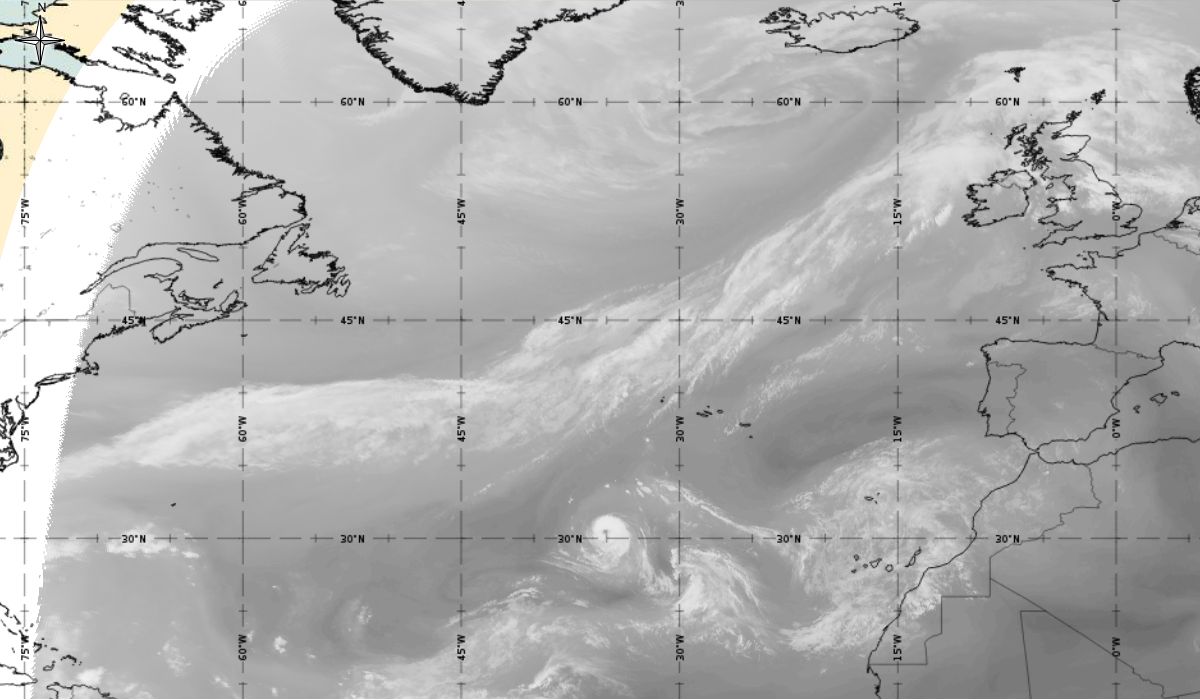
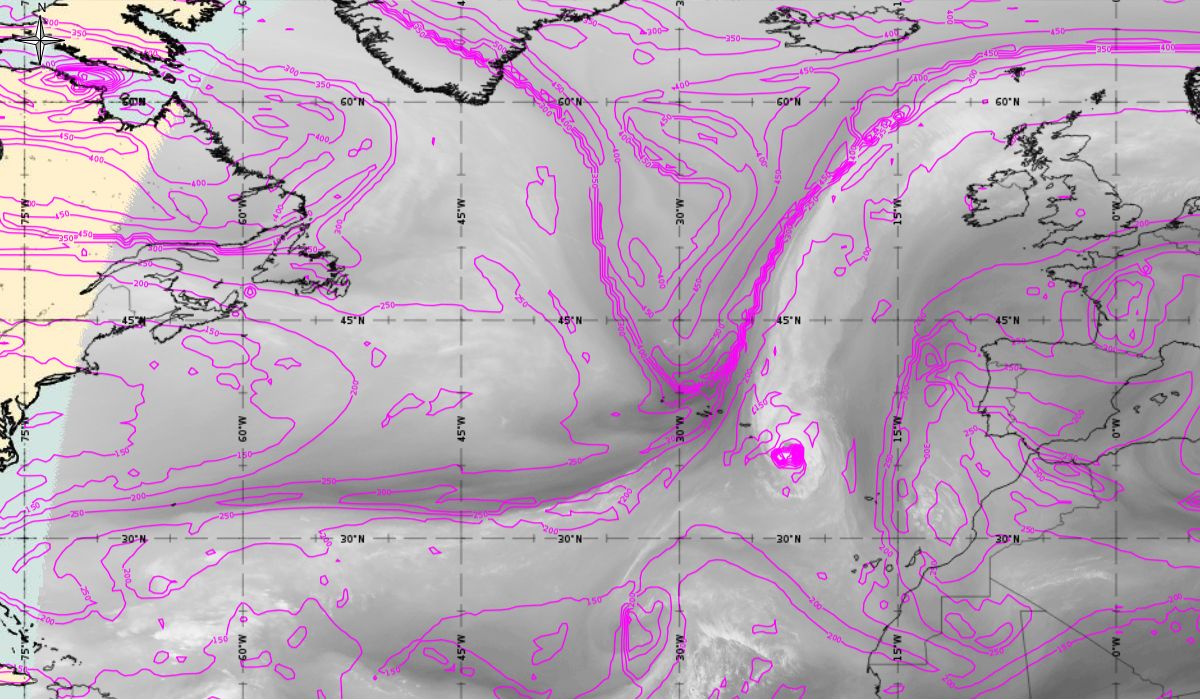
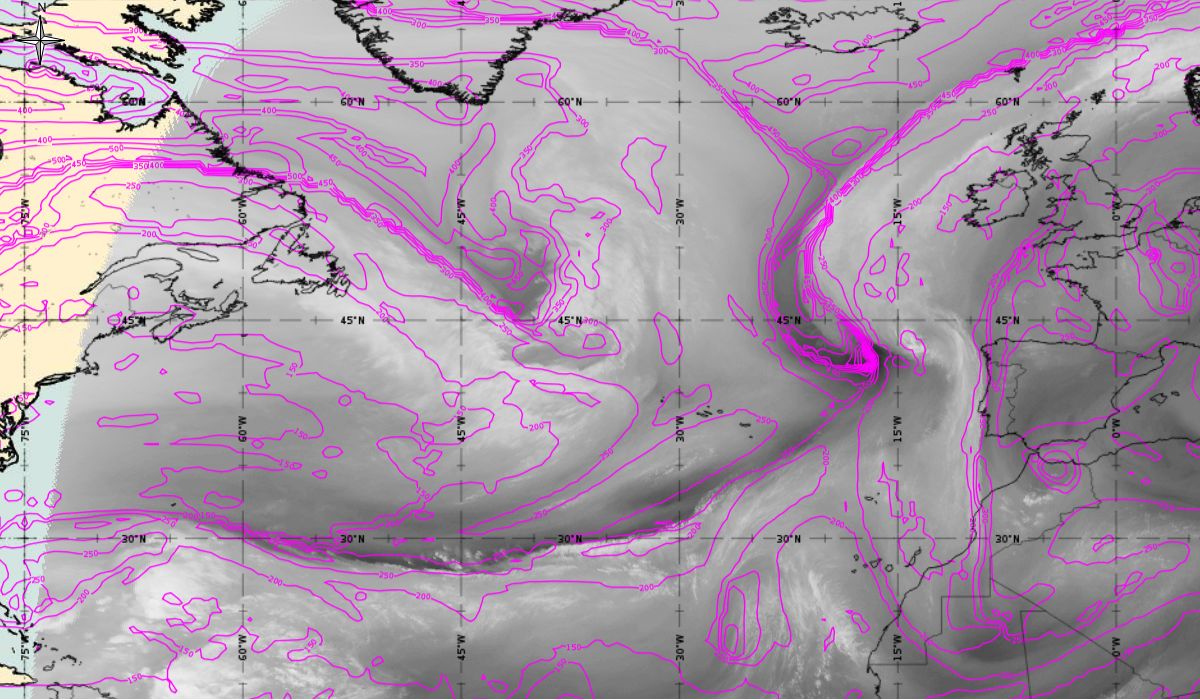
If we look at additional meteorological parameter (Figure 13), (height of PV=1,5), downward protruding stratospheric air could be documented by model fields of PV=1.5 PVU. A PV anomaly coincides very well with the dry intrusion (dark strip) in WV images. At the beginning, when a cyclone is deepening over the Atlantic, this dry intrusion can be clearly seen (during 7th October). PV=1.5 reaches down to 400 (even 450) hPa, which indicates a lowering of the tropopause; this hints at a cyclogenetic process.
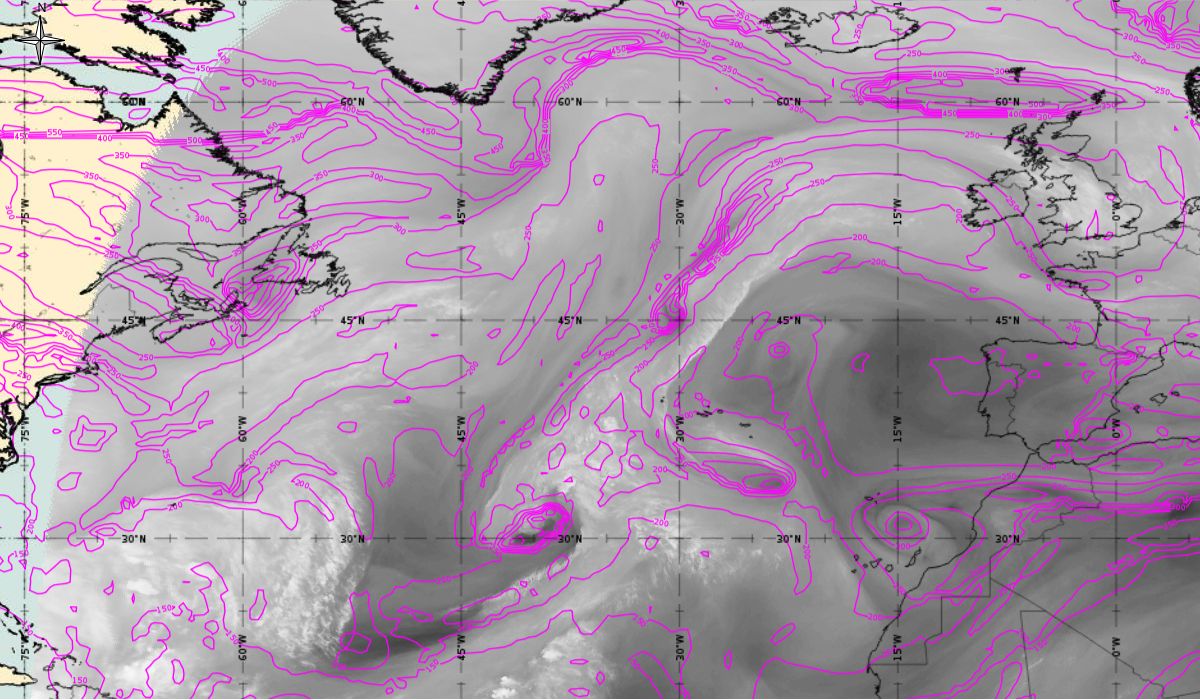
Figure 13: Height of PV=1.5 PVU (magenta), Meteosat 10 WV 6.2 from 7th October 2017, 00:00 UTC to 11th October 2017, 06:00 UTC (source: EUMeTrain, ePort)
Note: Click on the image to go through the gallery
Hurricane phase
Hurricane Ophelia - development from category 1 to category 3 on Saffir Simpson scale
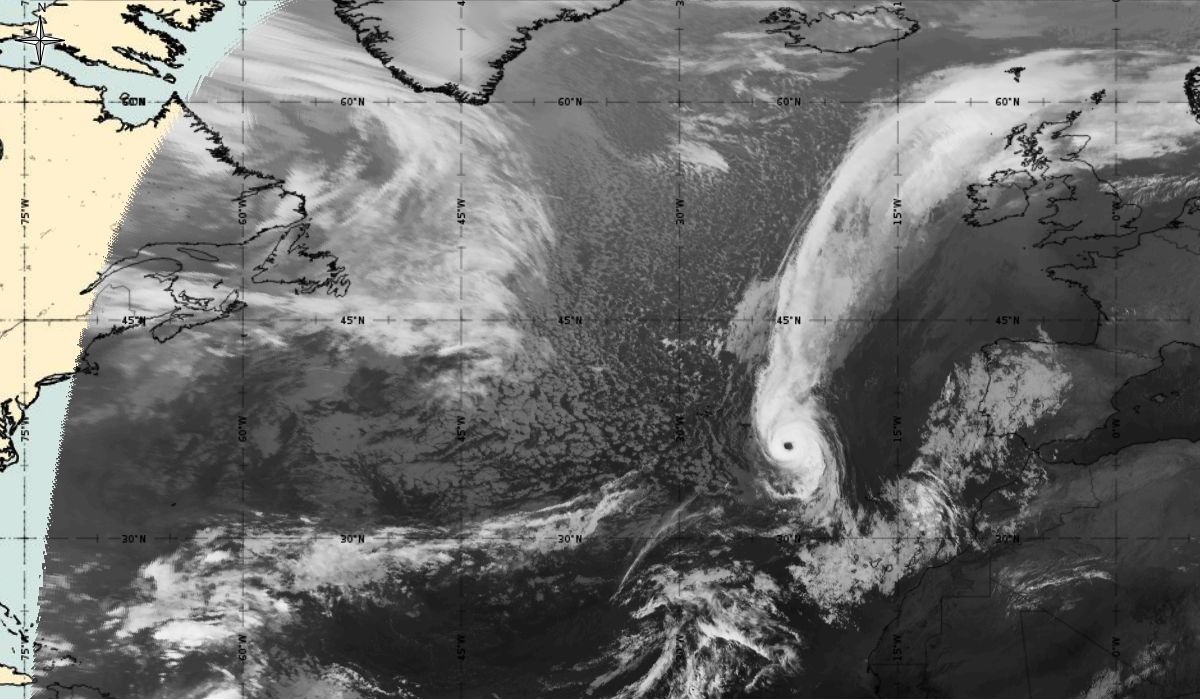
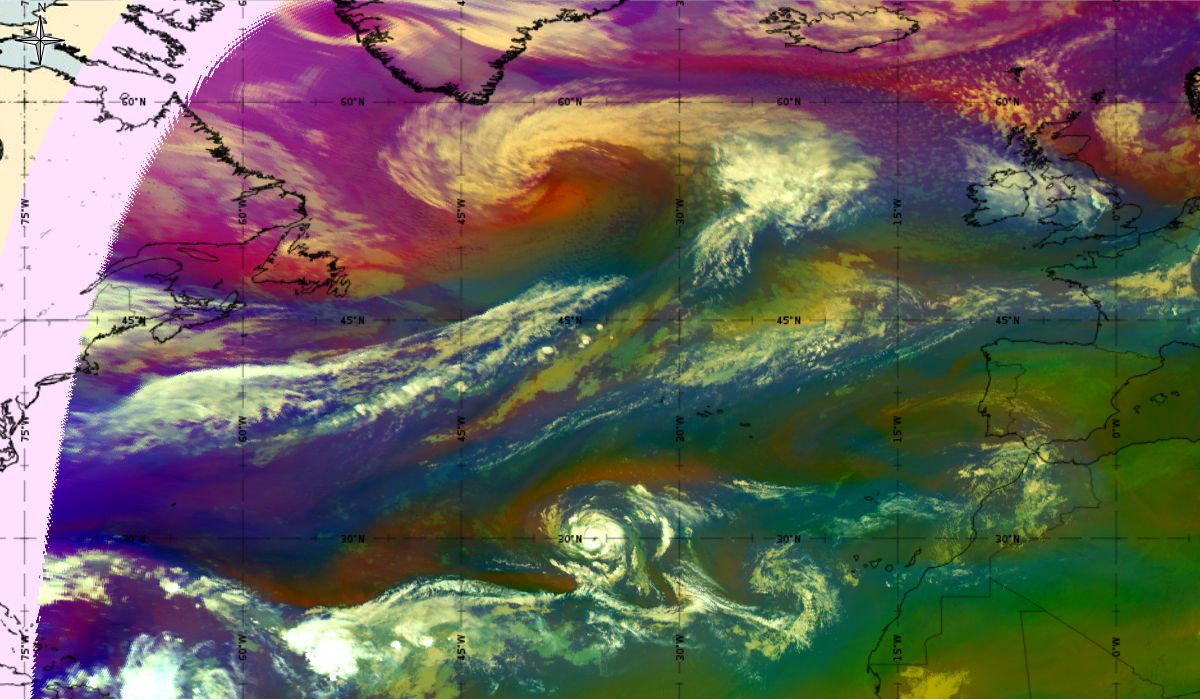
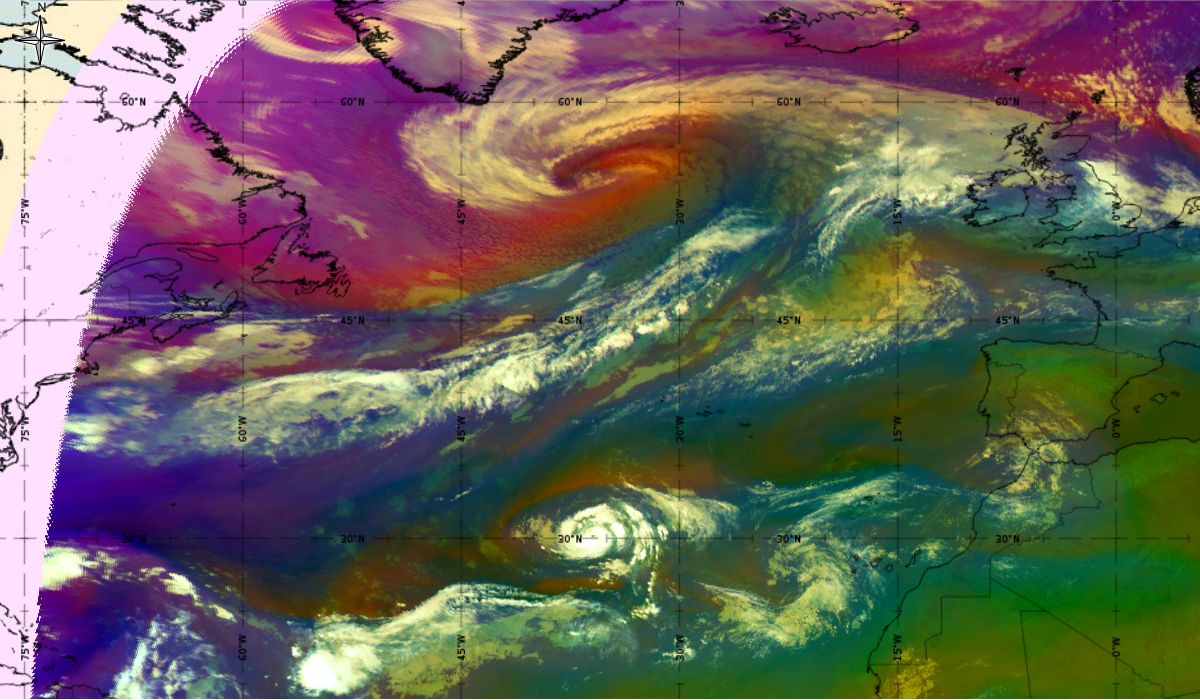
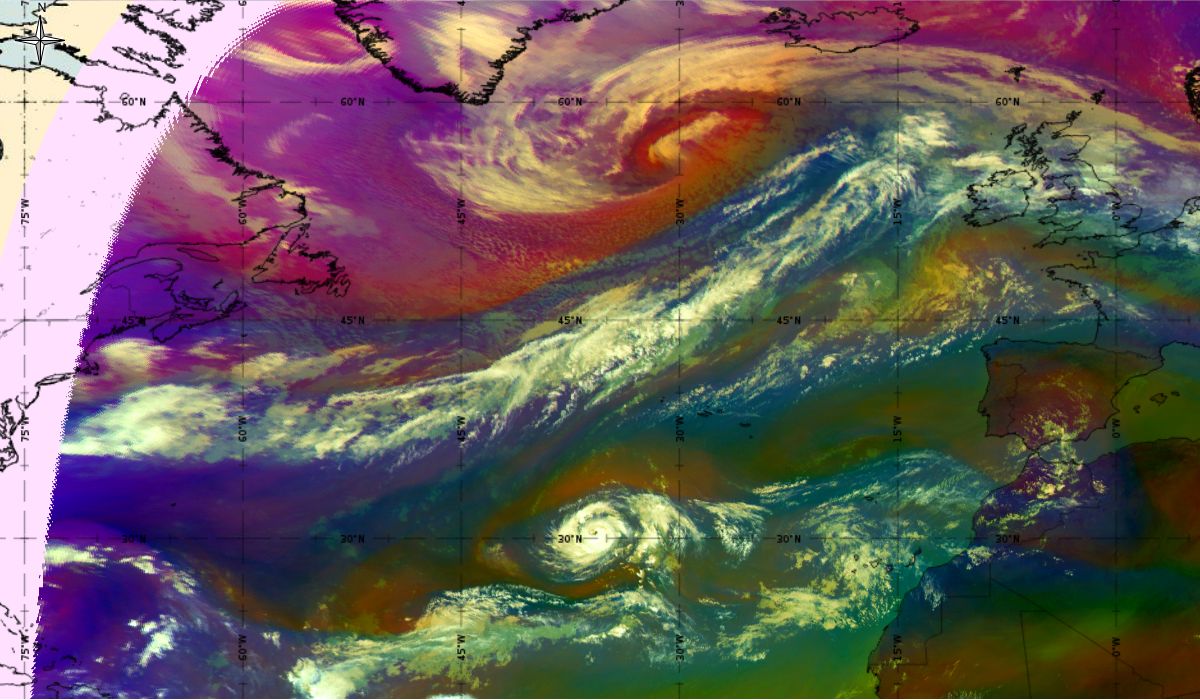
Loop 4 and 5: Meteosat 10 IR 10.8 and Airmass RGB animation from 11th October 2017, 18:00 UTC to 15th October 2017, 00:00 UTC (source: EUMeTrain, ePort)
Note: To go through individual images, click Loop 4 or
Loop 5
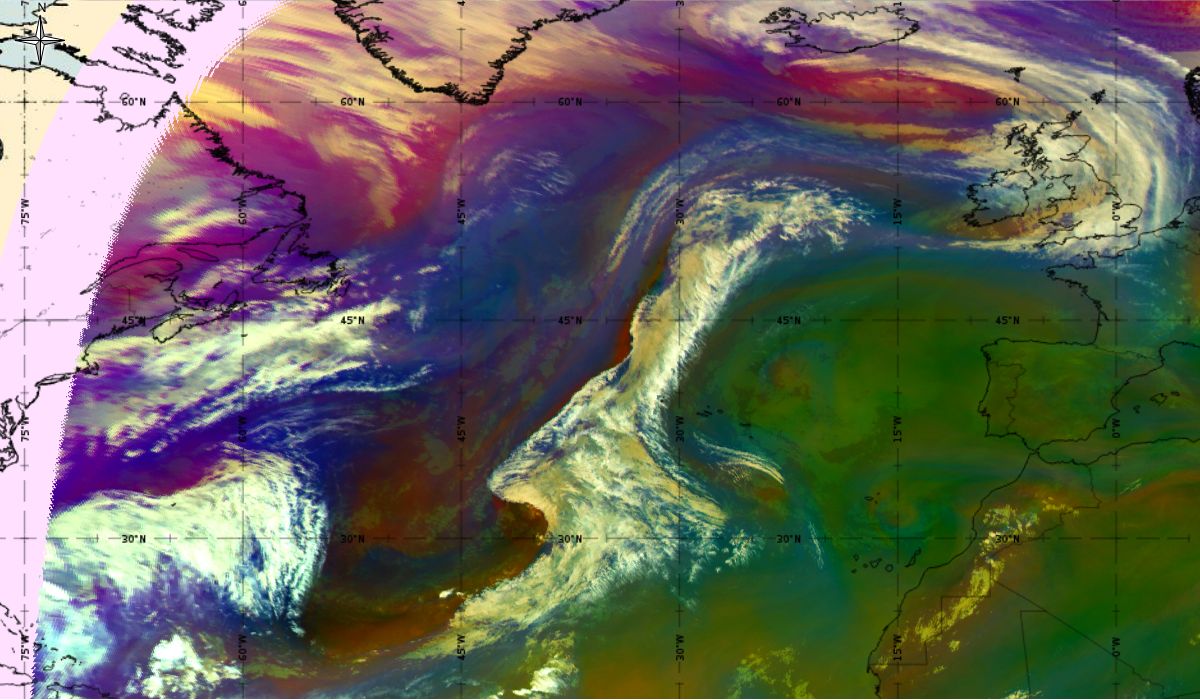
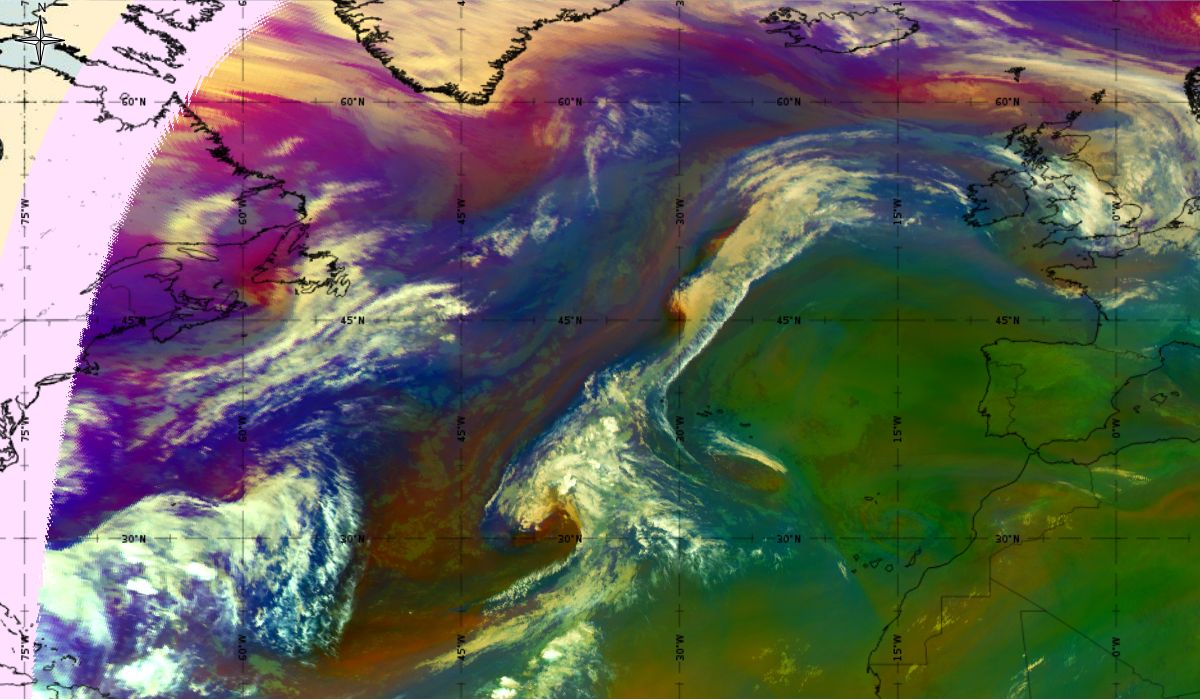
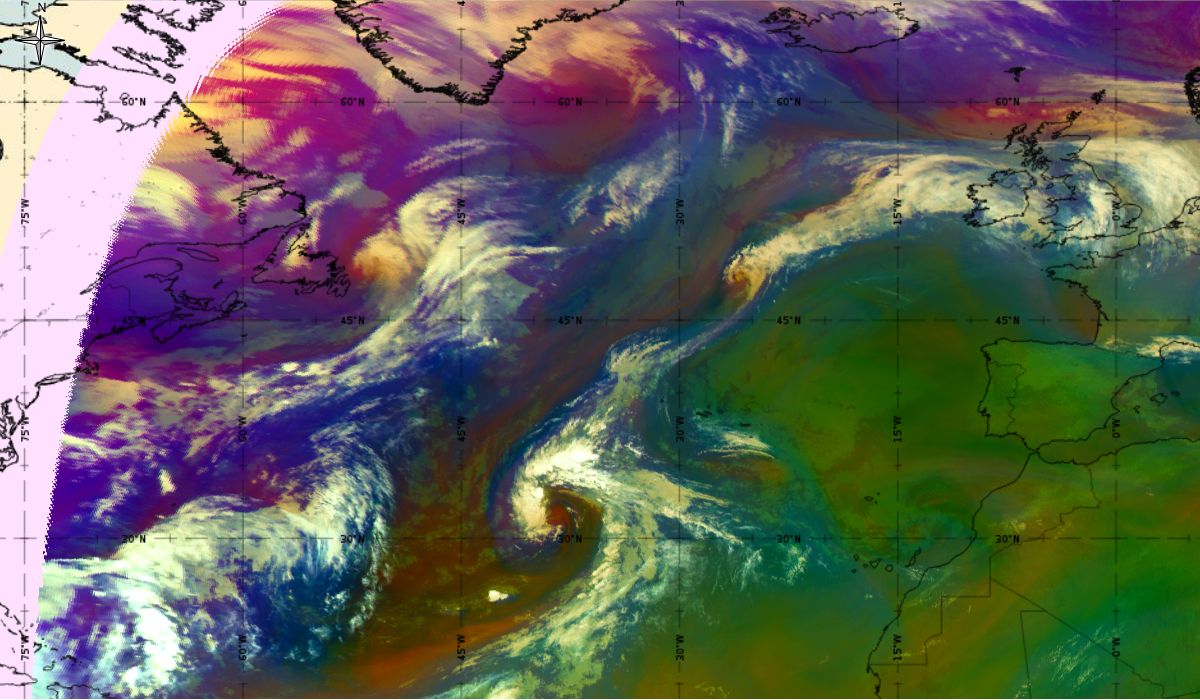
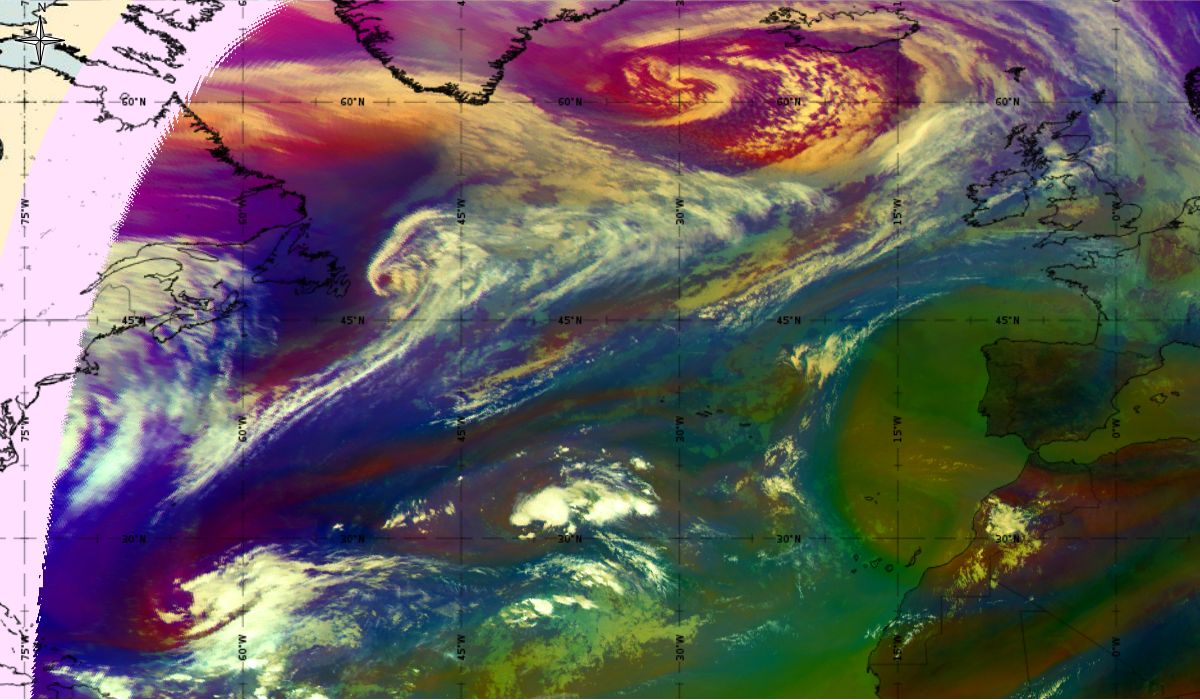
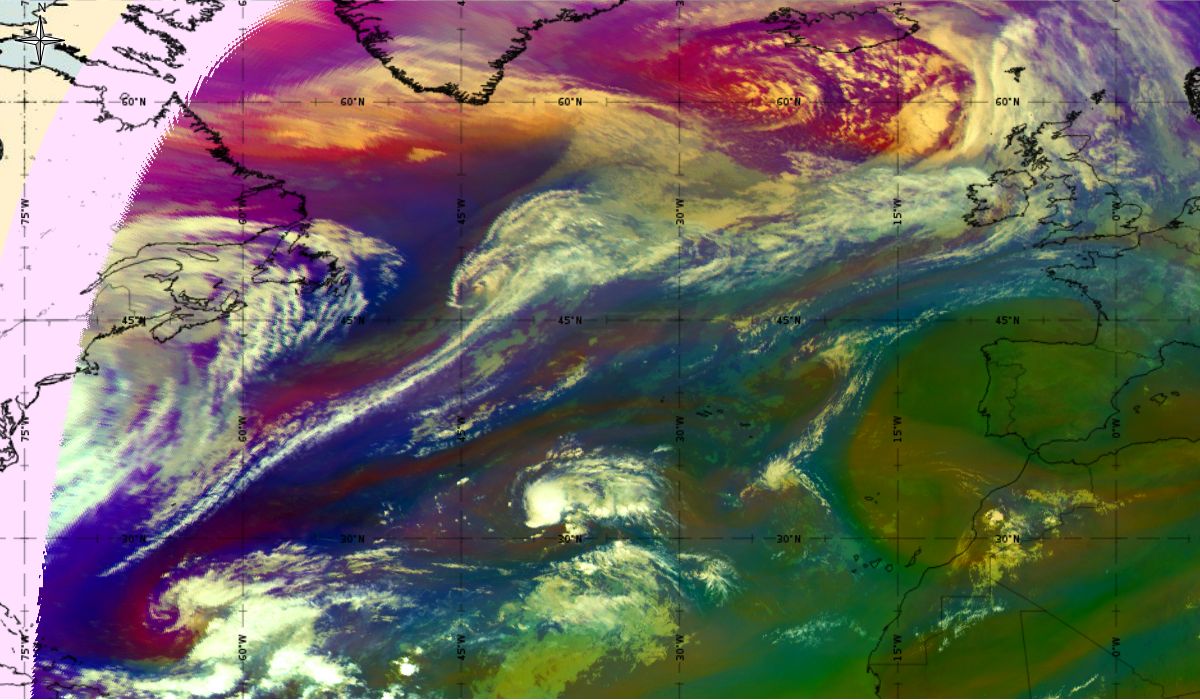
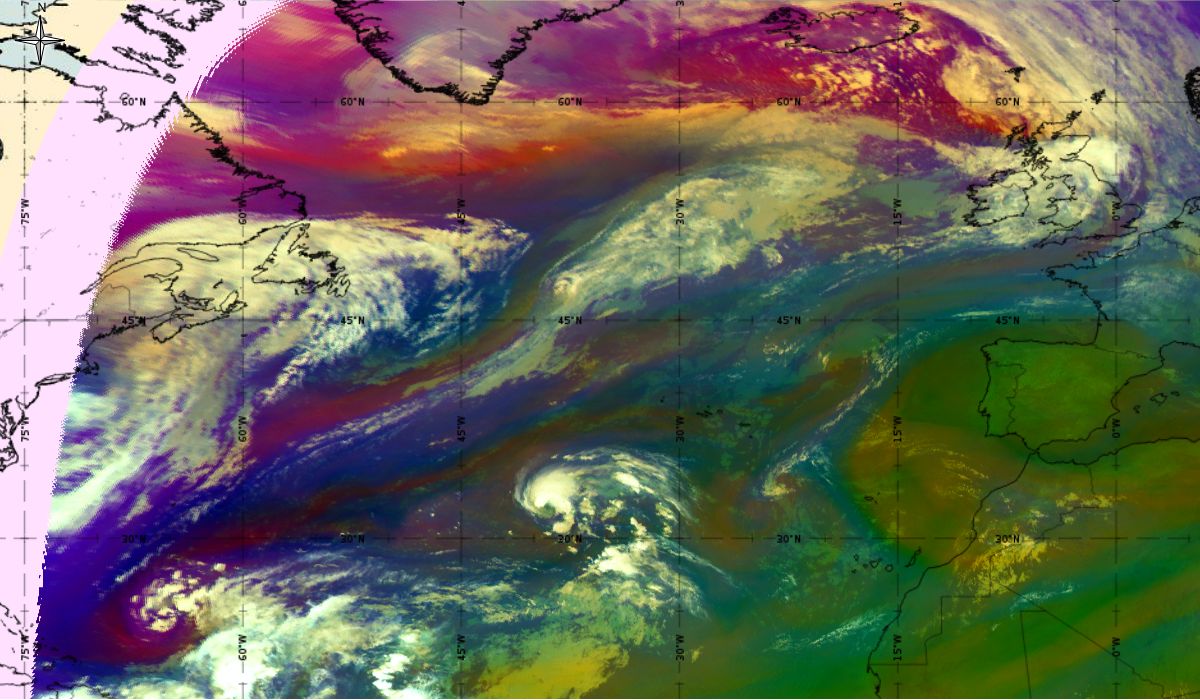
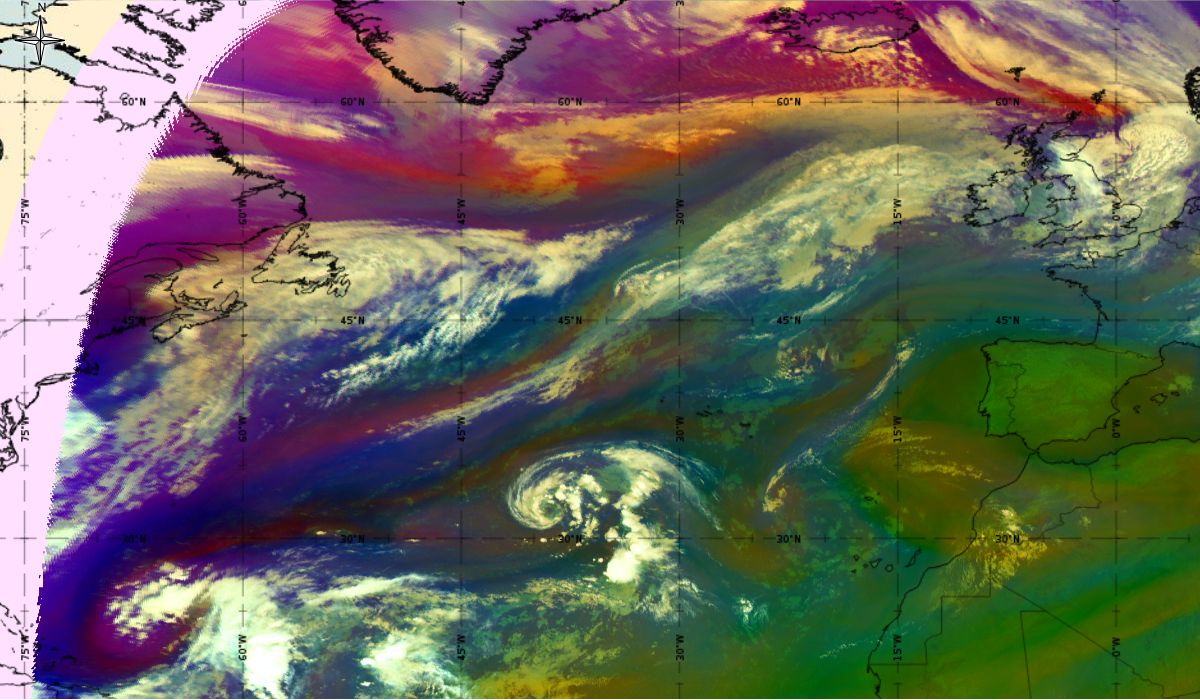
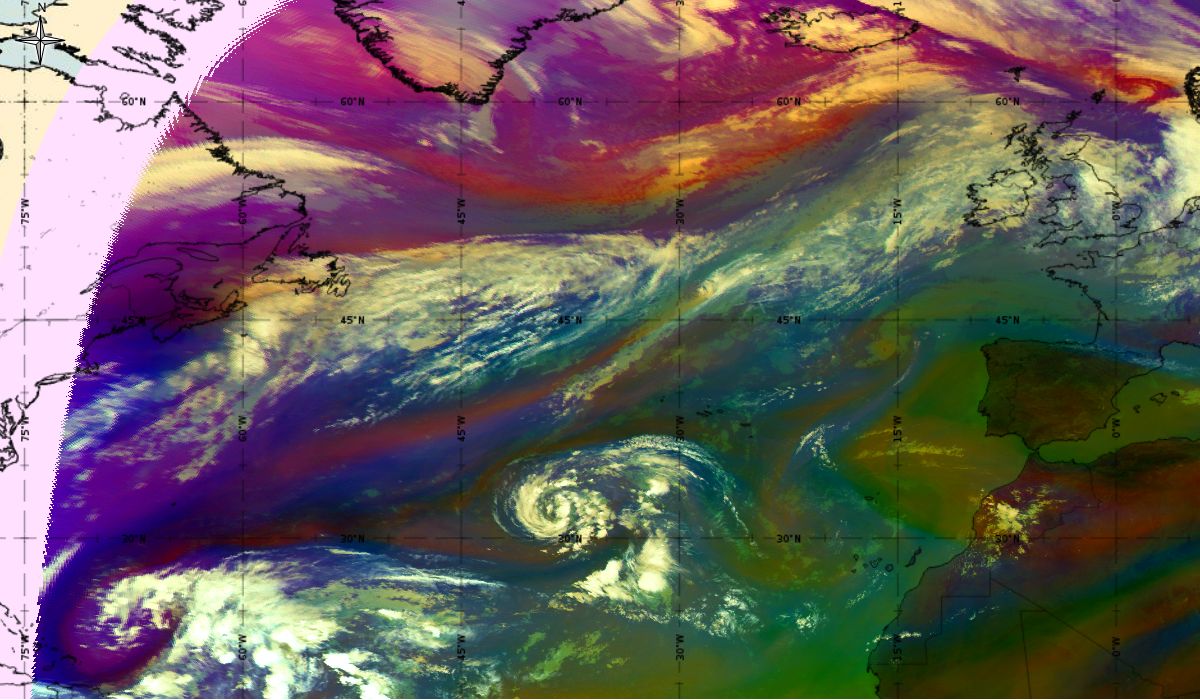
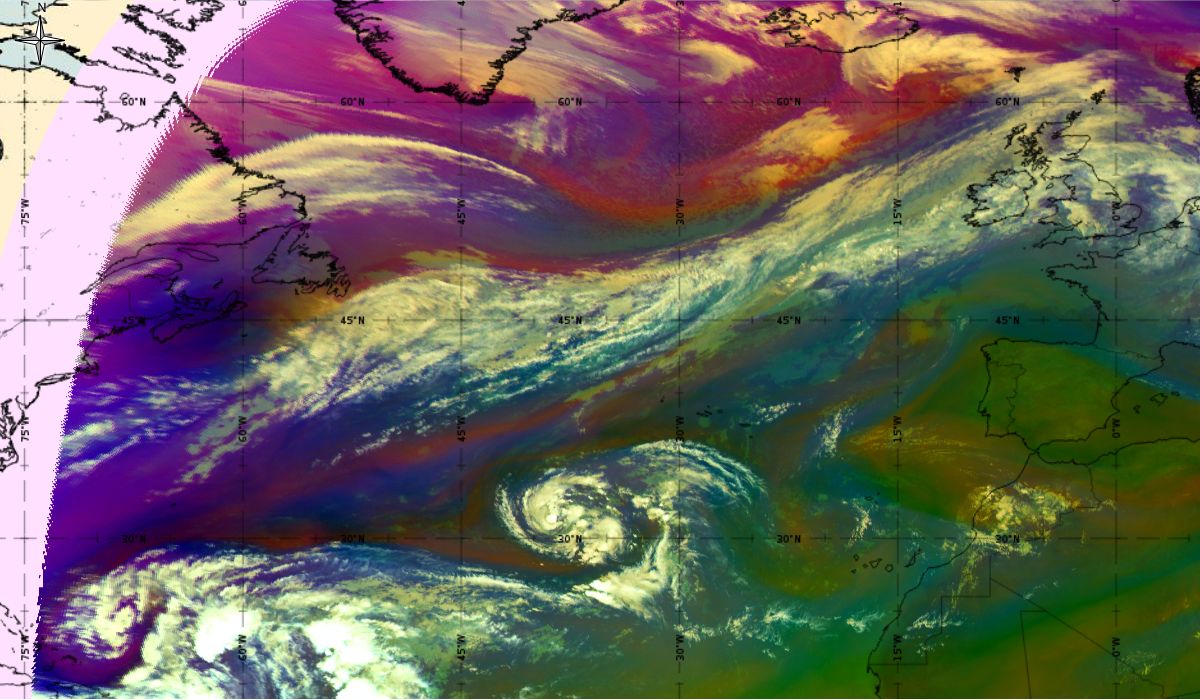
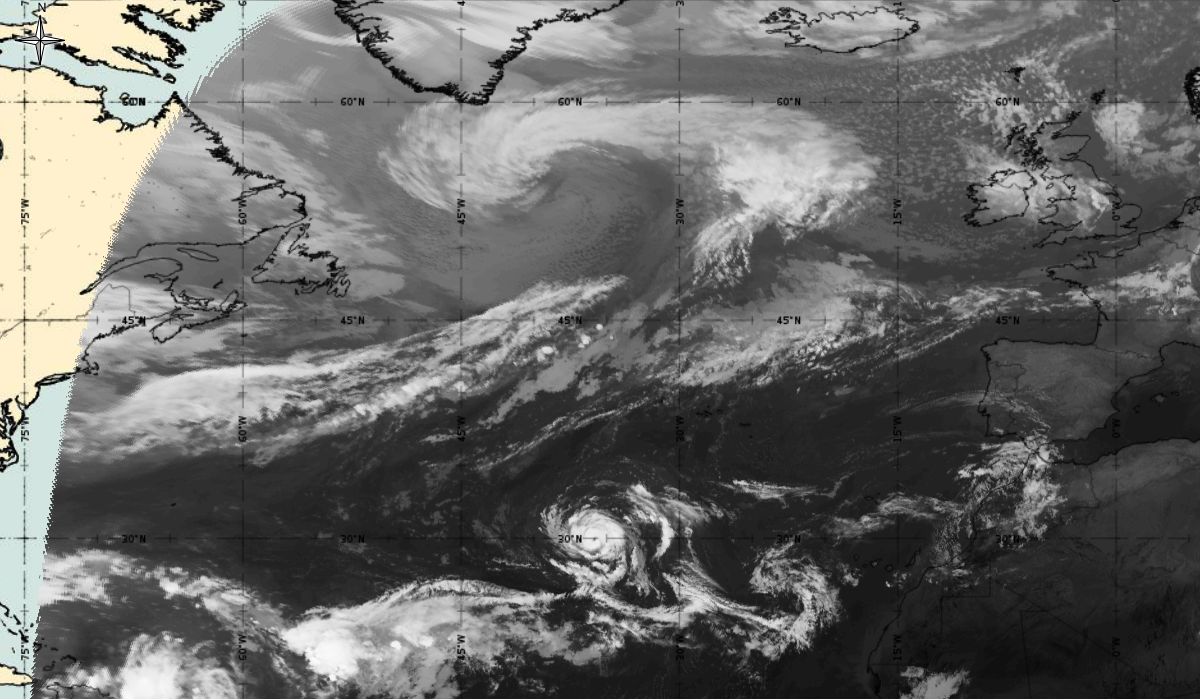
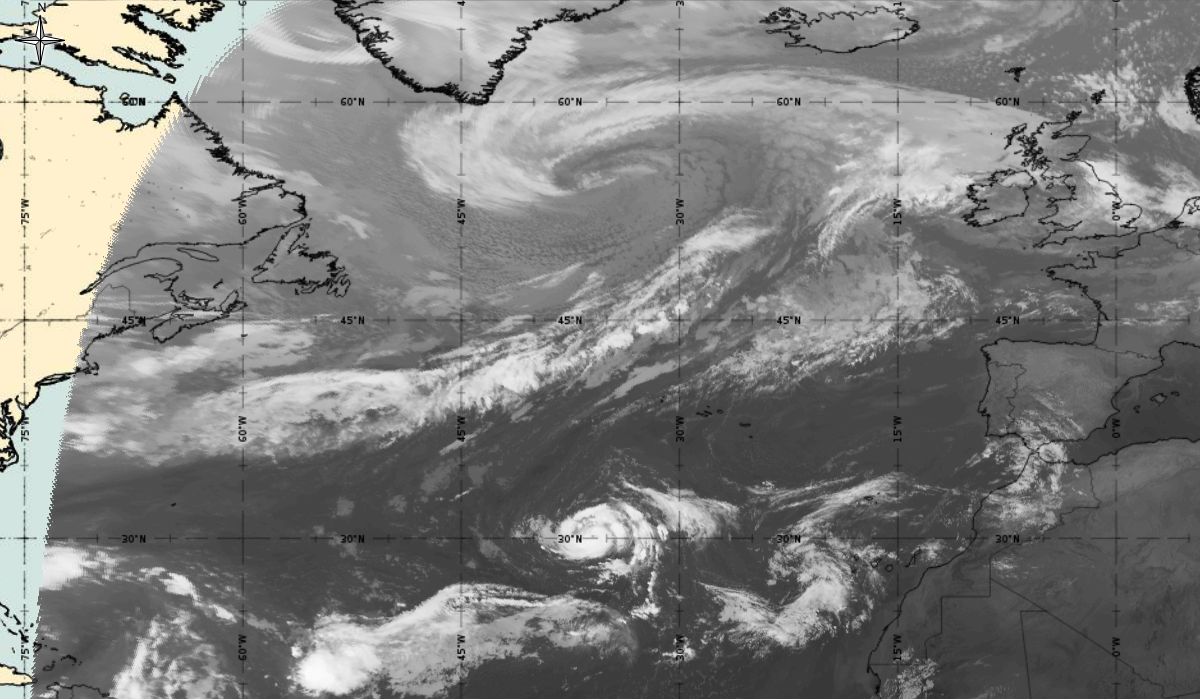
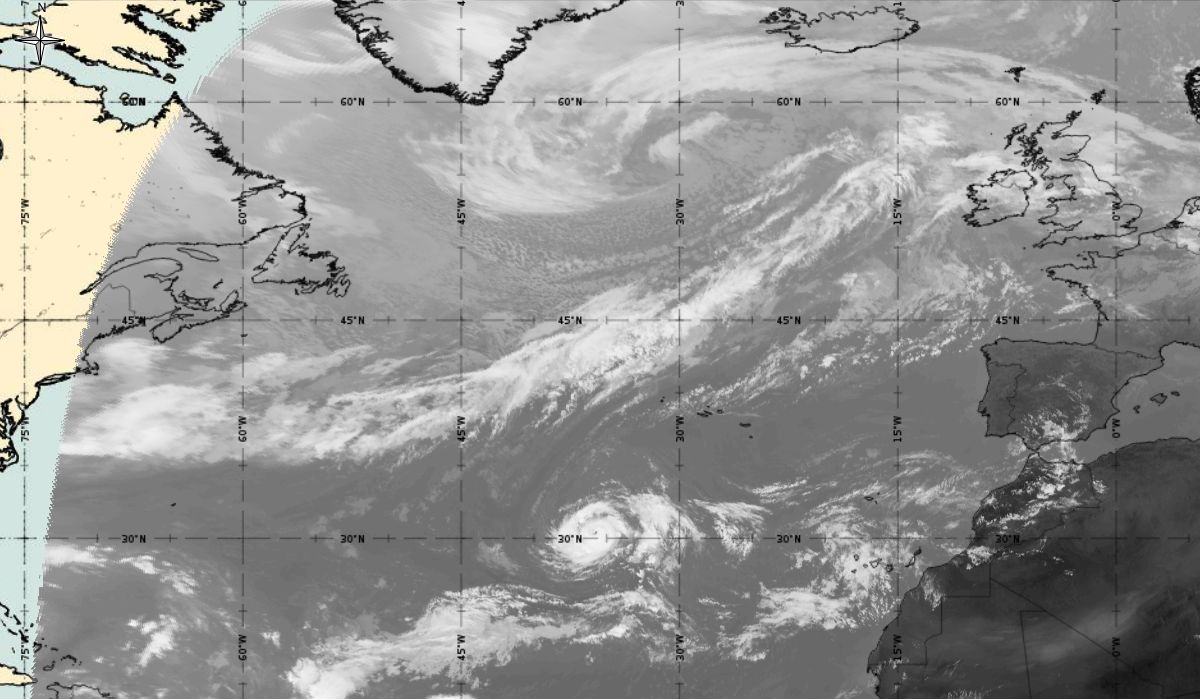
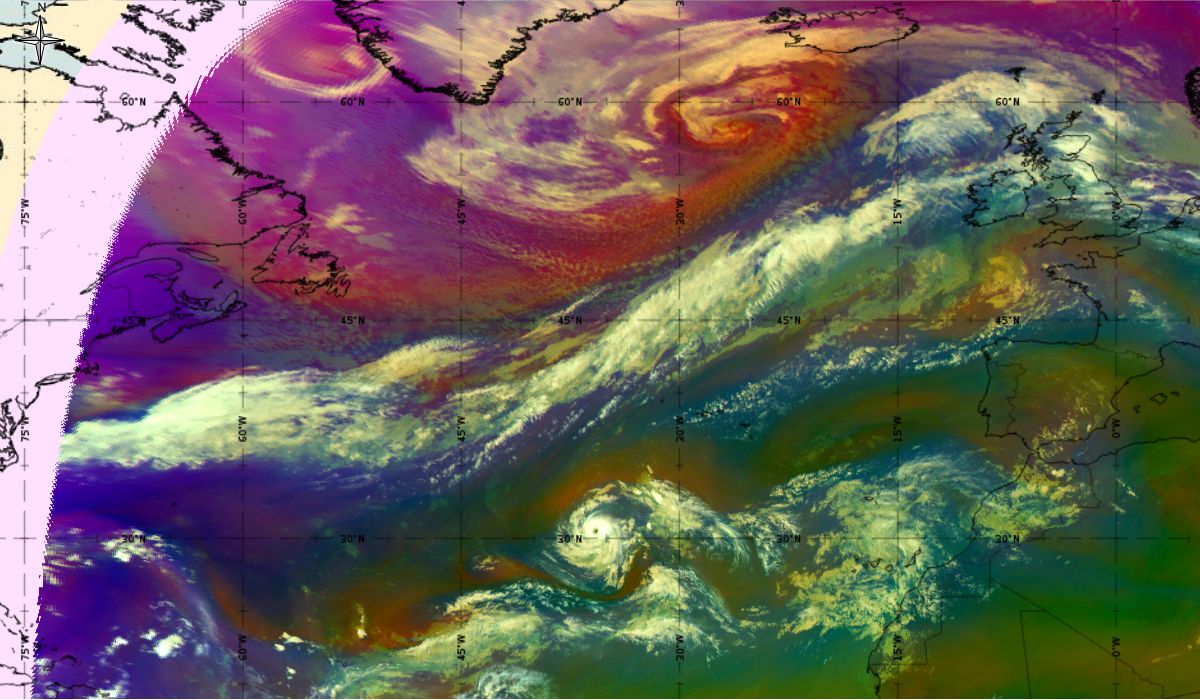
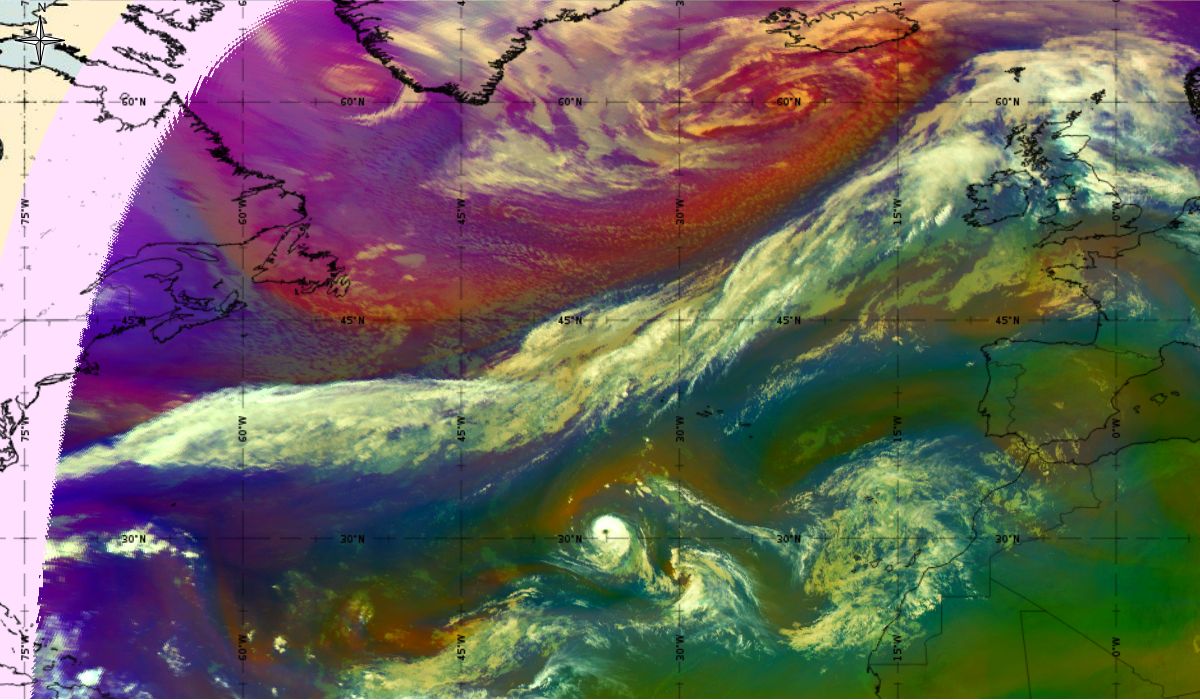
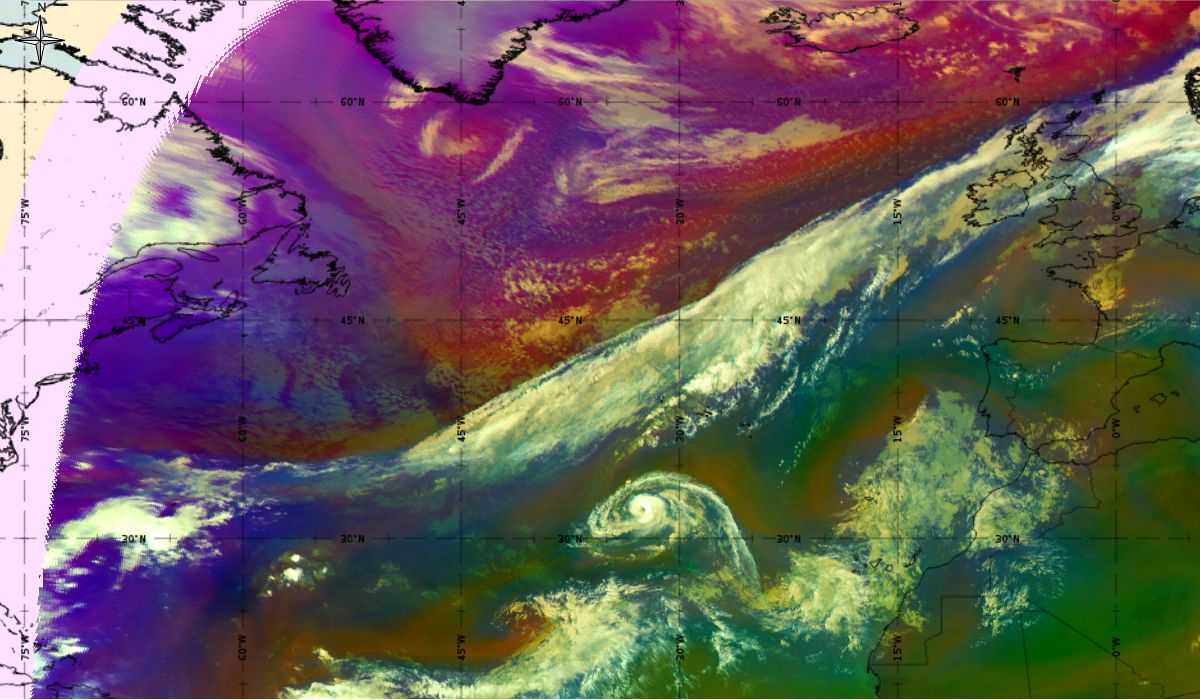
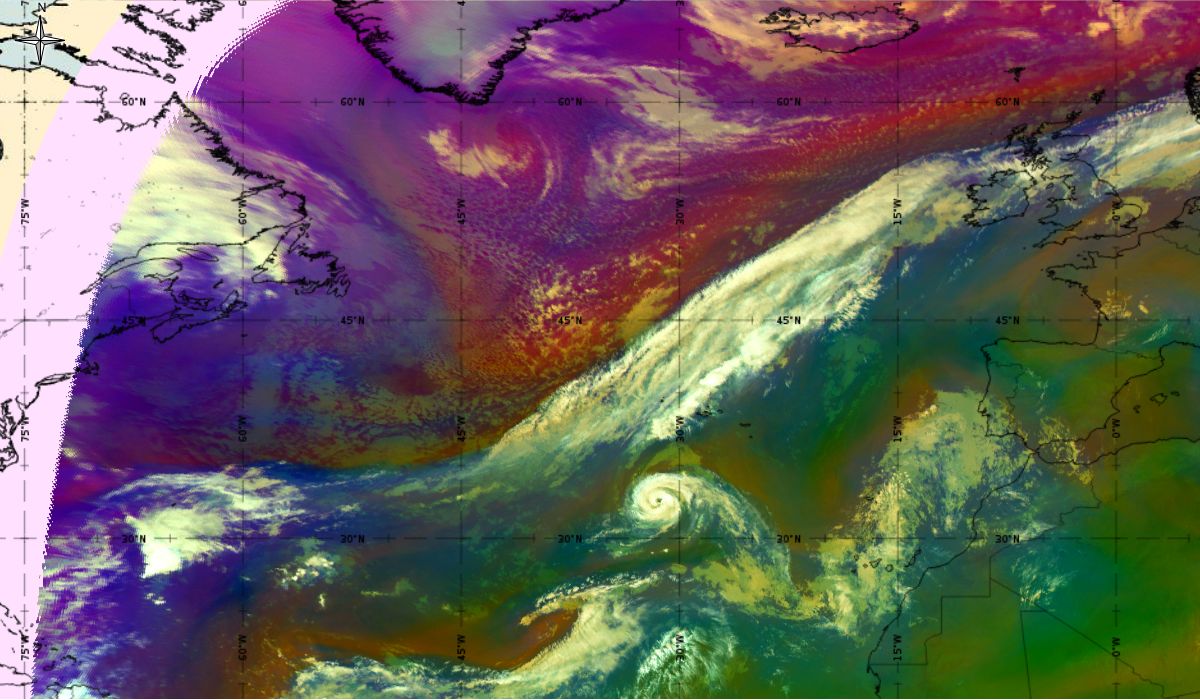
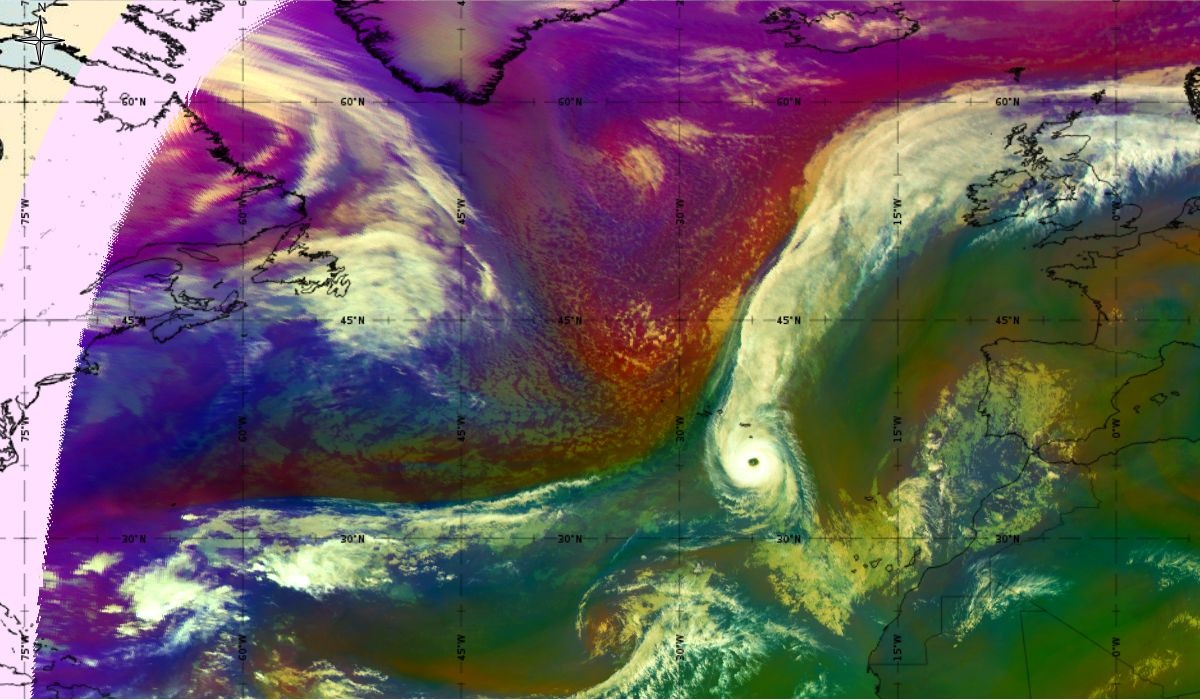
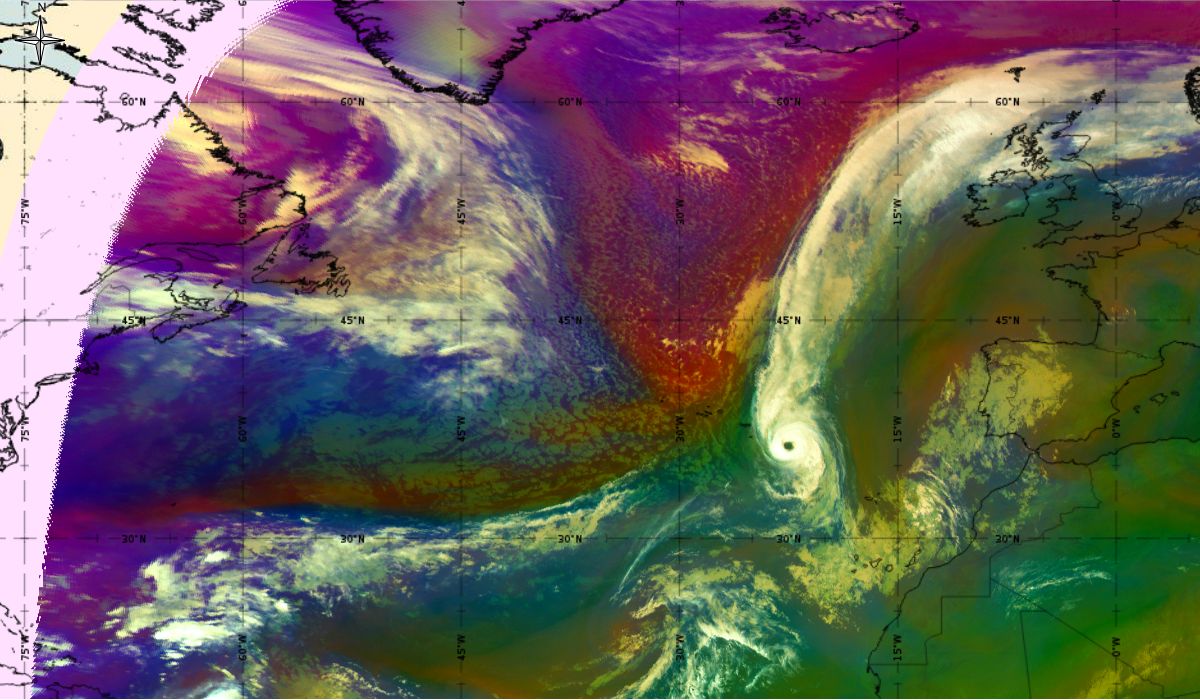
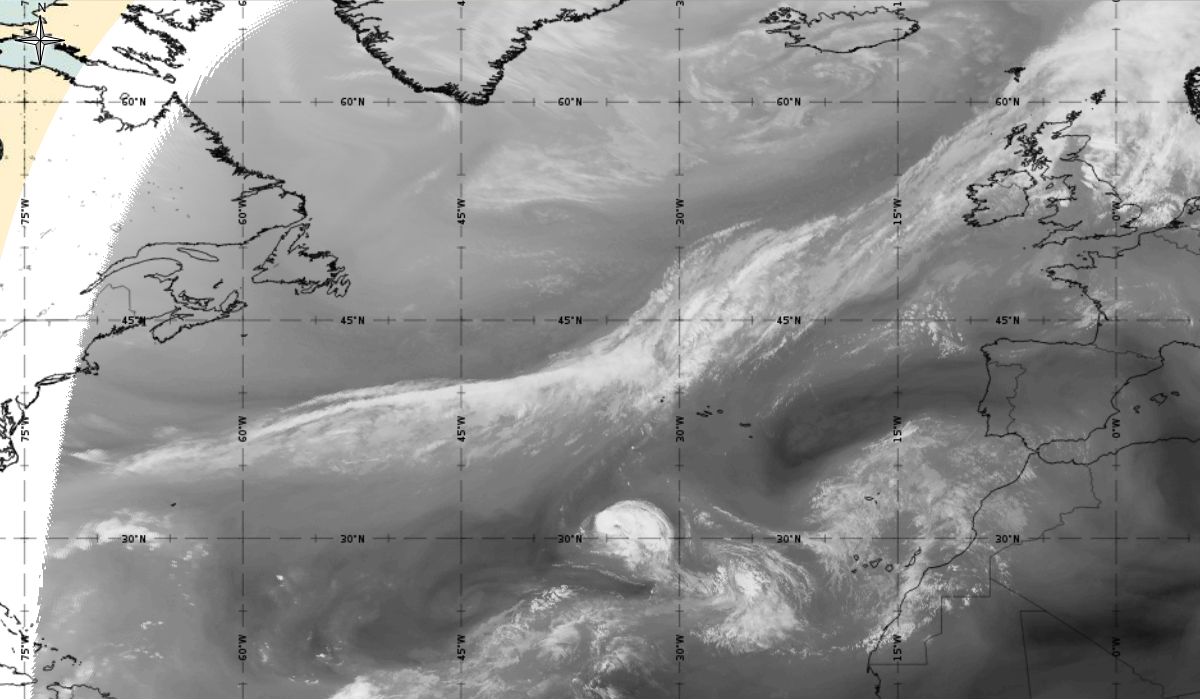
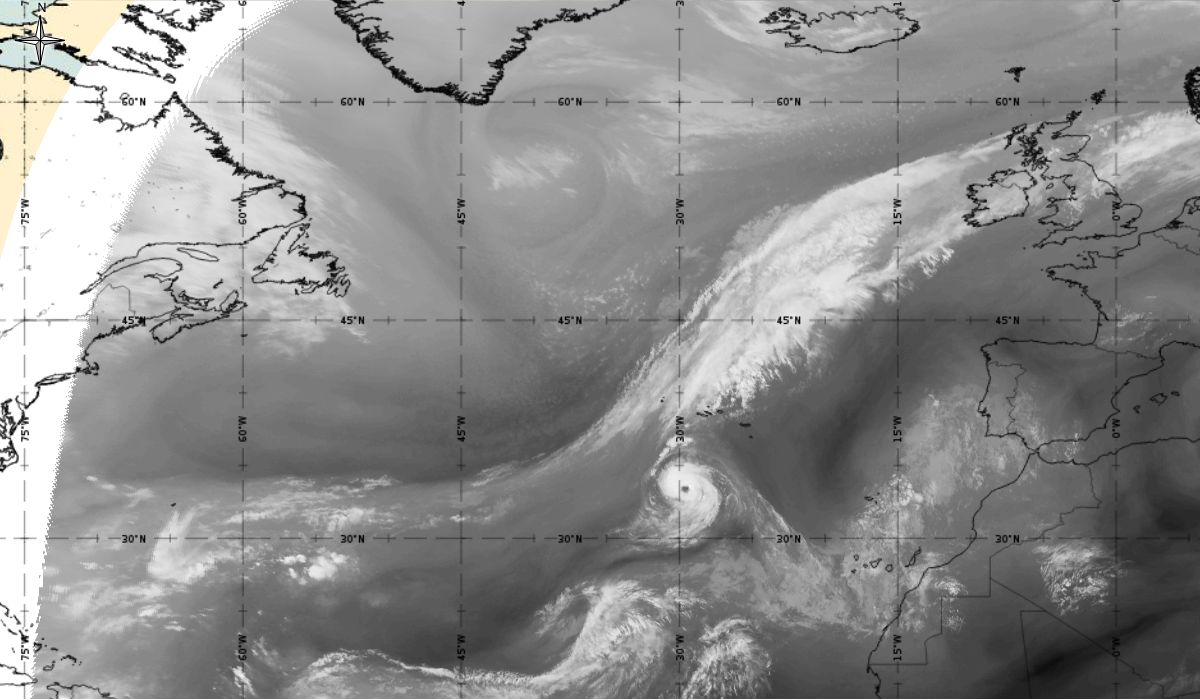
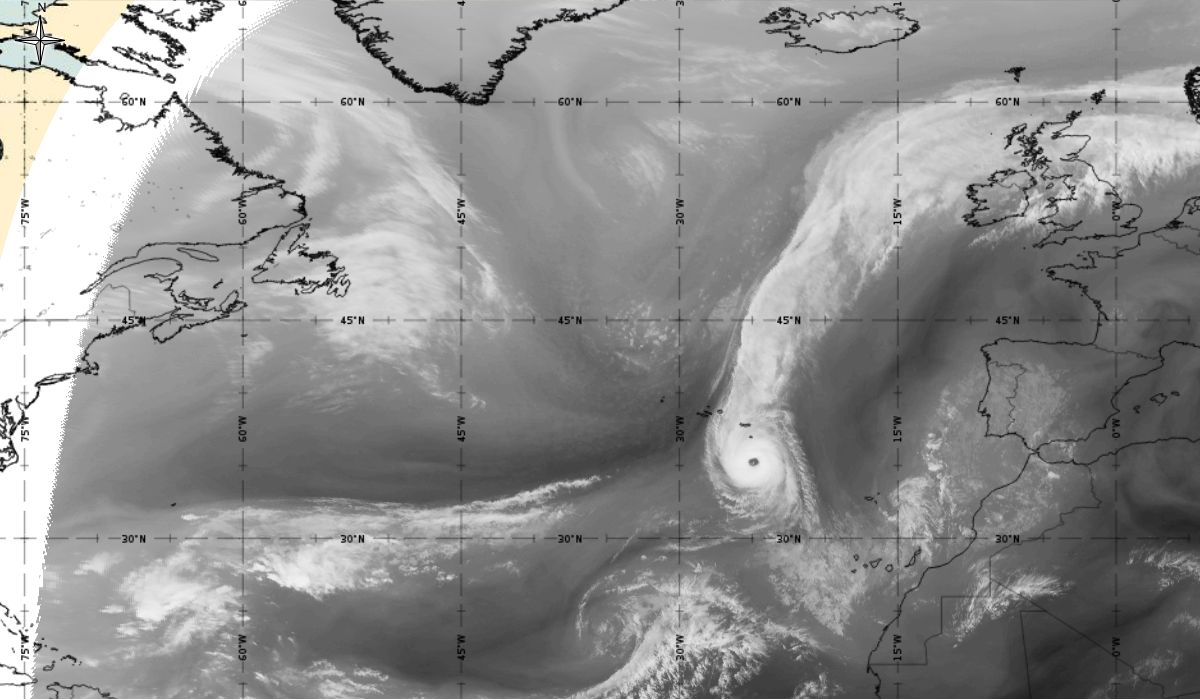
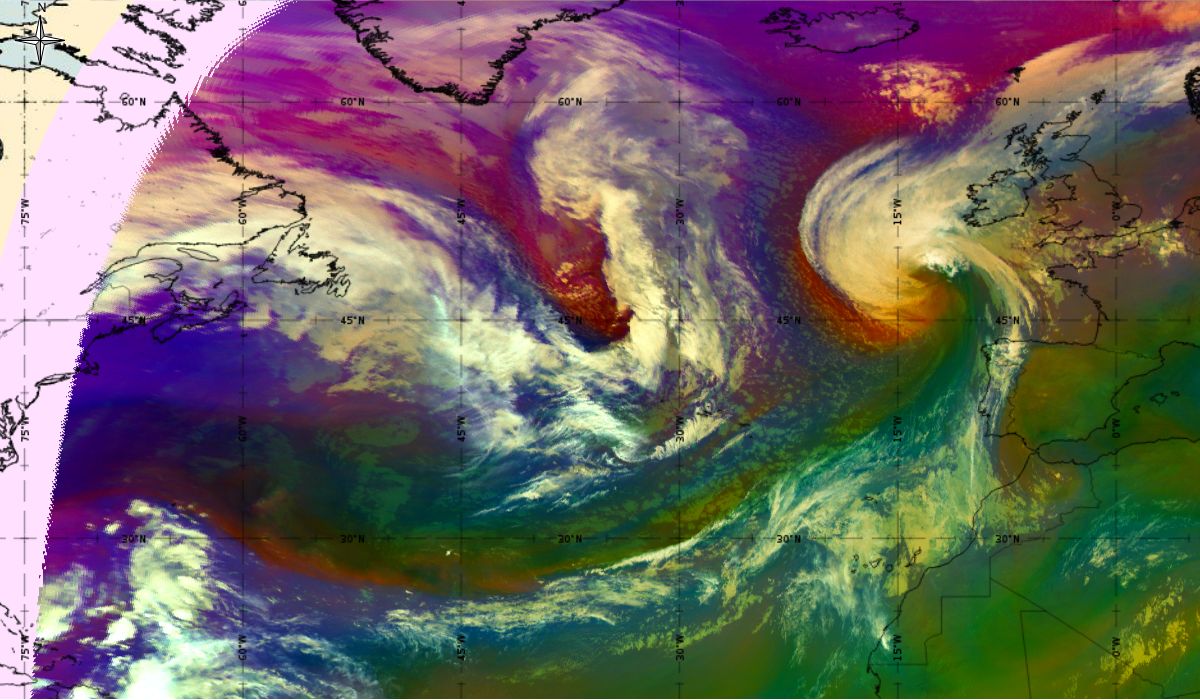
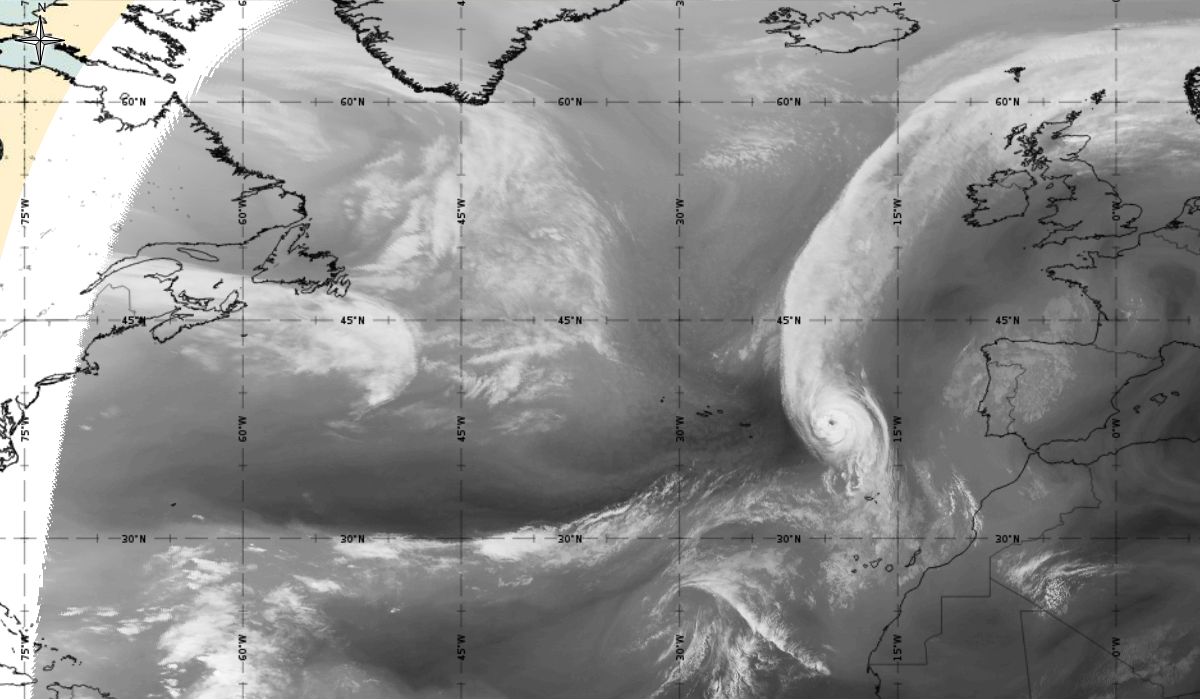
The path and evolution of hurricane Ophelia and a well-defined eye can be followed through Airmass RGB satellite images. The development occurred in the warm air masses (greenish colour) but attention should be focused on the colder air masses north of the pronounced cloud band and the jet (in the area of transition from blue to red colours at the rear side of the cloud band). After Ophelia reached its maximum strength (14th October 12:00 UTC), an interaction with a strong upper level trough (trough visible in red colour) and jet stream flow caused a gradual weakening of the hurricane.
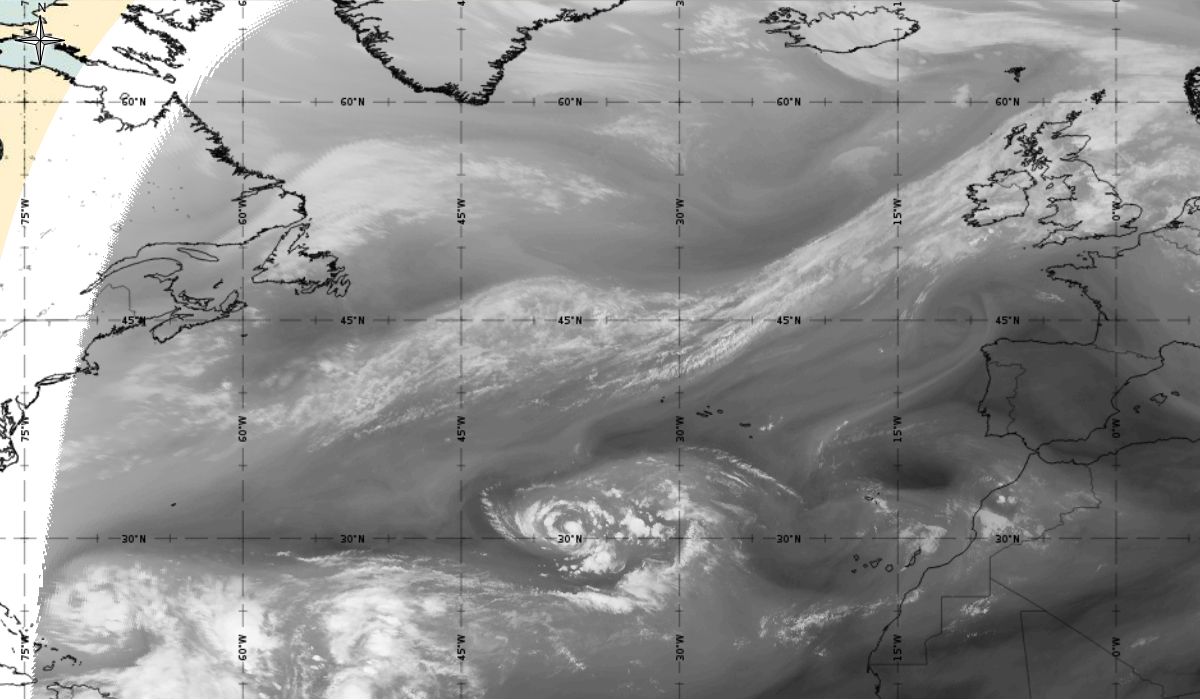
Loop 6: Meteosat 10 WV 7.3 animation from 11th October 2017, 18:00 UTC to 15th October 2017, 00:00 UTC (source: EUMeTrain, ePort)
Note: To go through individual images click Loop 6!
In the first 24 hours of the hurricane phase, the system is almost stationary but deepening. After that it was moving to the northeast with further development. The eye of the hurricane, a dark spot (dry area), can be followed in the cyclonic structure of thick, bright clouds (high water vapour content). The sharp, darker edge (especially notable when Ophelia reached its maximum on 14th October between 12:00 and 18:00 UTC) on the west side of the wide cloud system indicate a jet stream, which speeds up Ophelia to the northeast.
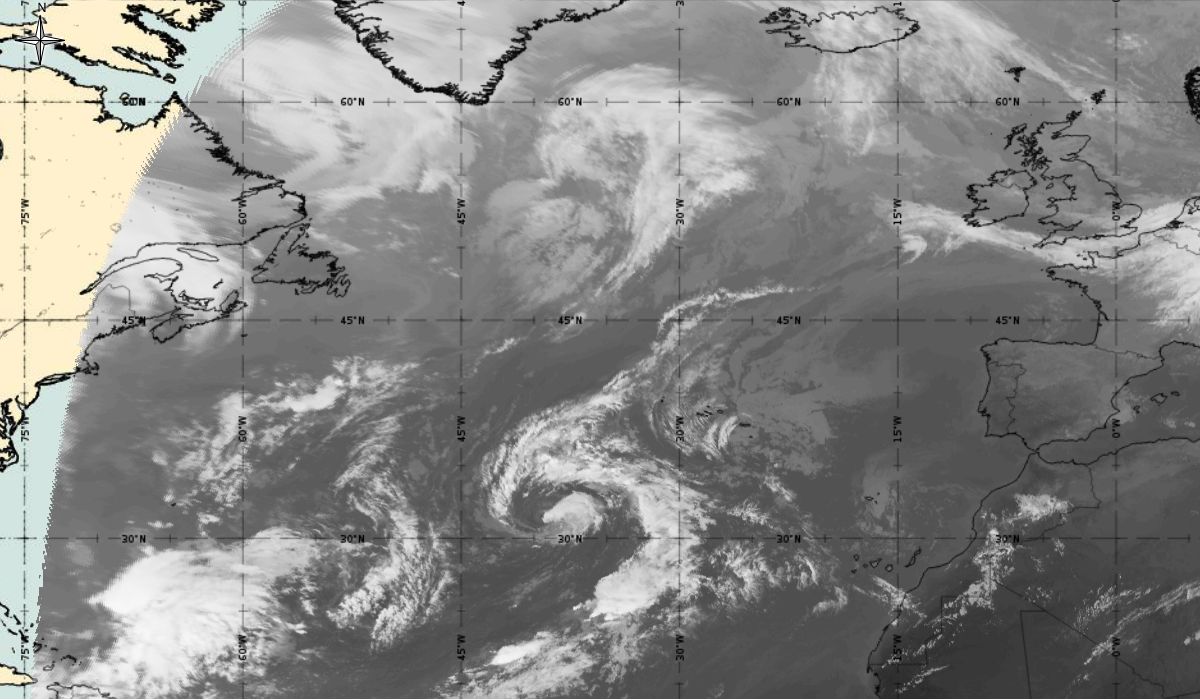
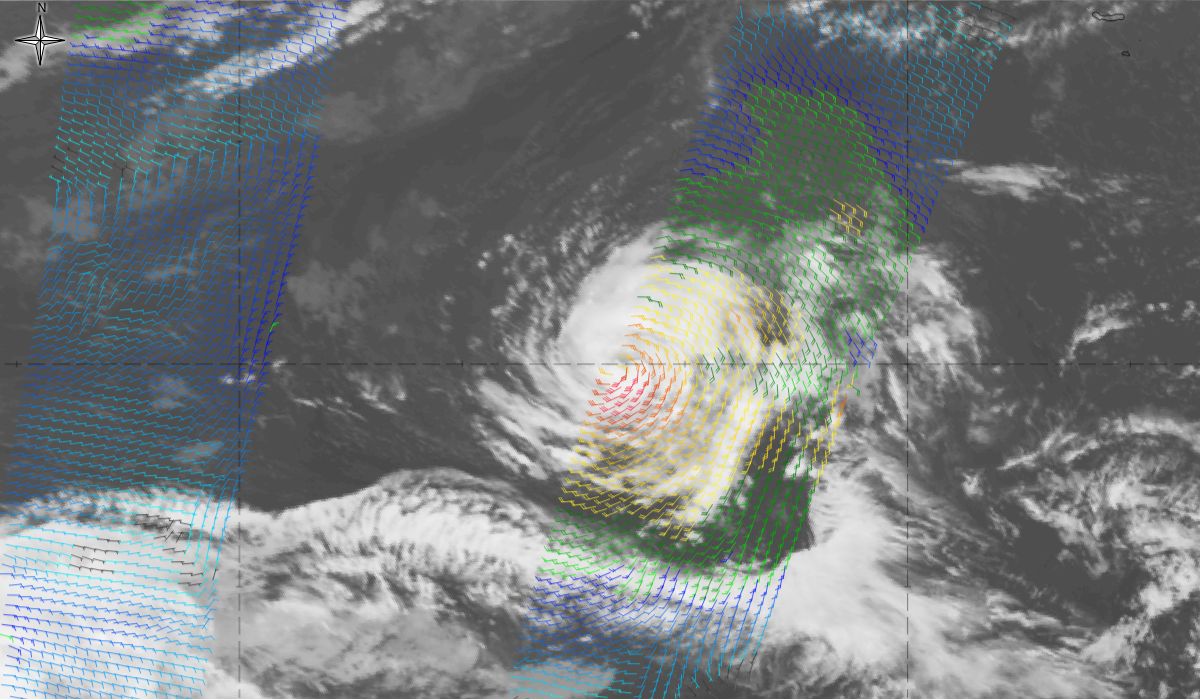
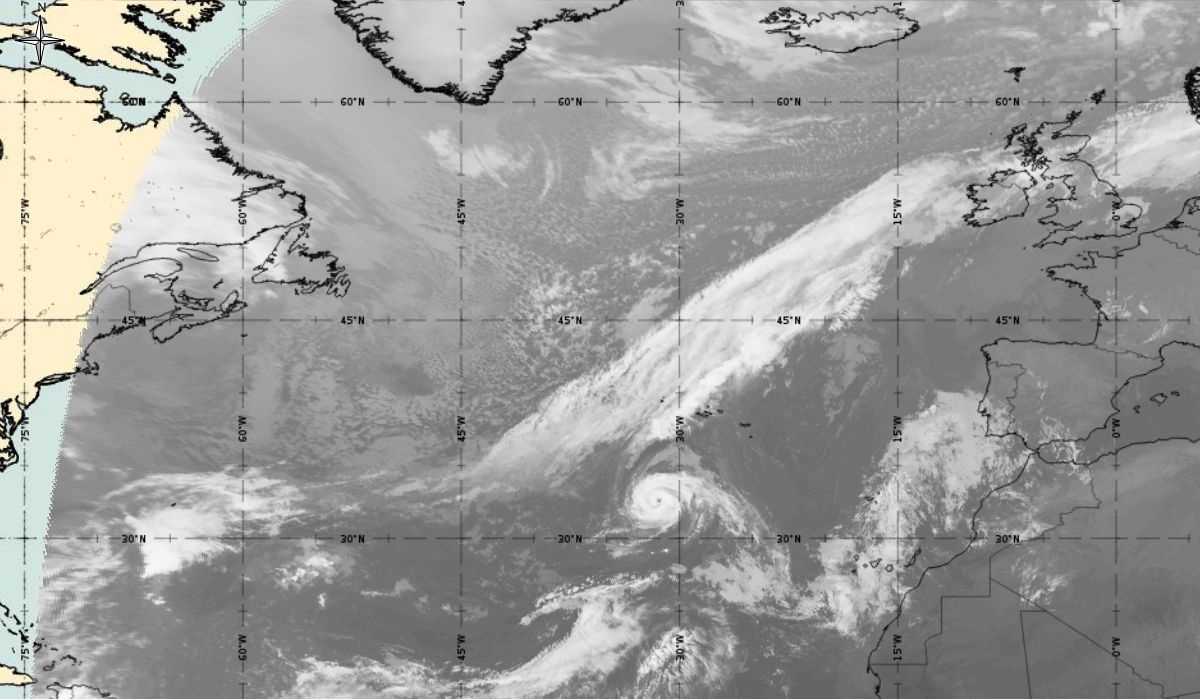
Tropical storm Ophelia was mostly stationary while steadily strengthening. It started to move slowly towards the southeast and became a Category 1 hurricane on the Saffir-Simpson scale after 18:00 UTC on 11th October 2017 (Figure 14.1 and 14.2). It was located 660 nautical miles (approx. 1200 km) southwest of the Azores (29.8 °N, 36.2 °W) with a wind speed of about 65 kt. The ASCAT data shows wind speed on the southwest part of the storm Figure 15.
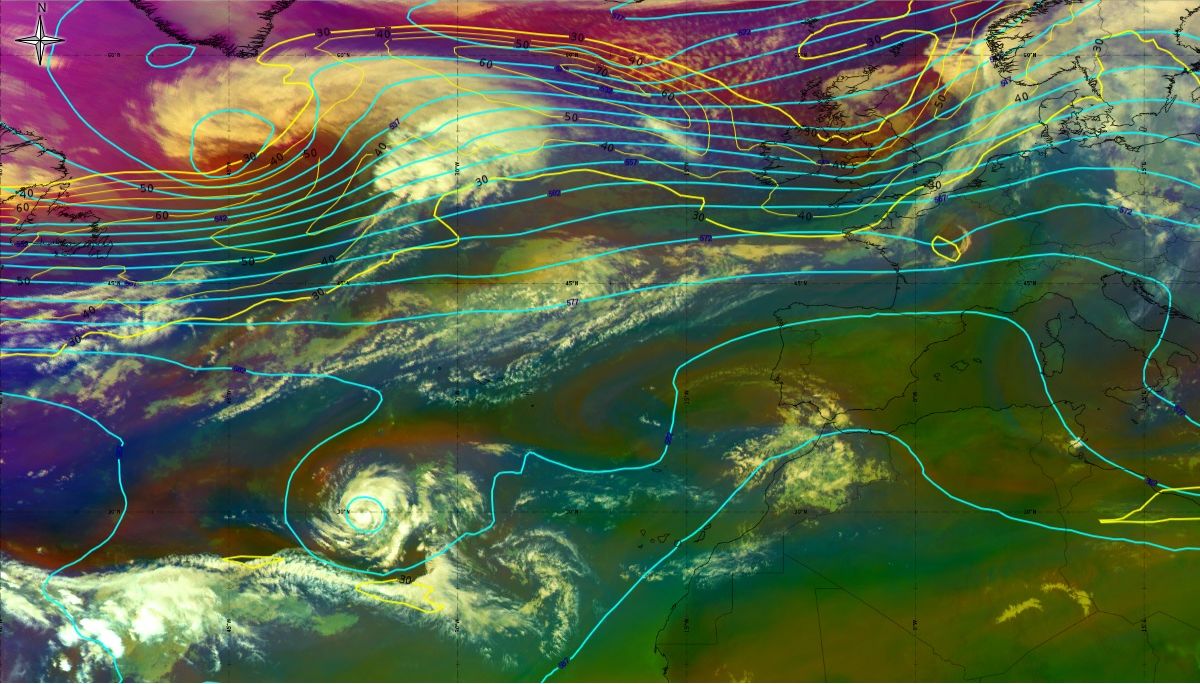
Figure 14-1: 11th October 2017 18:00 UTC - MSG Airmass RGB, geopotential height at 500 hPa (blue line), isotach at 300 hPa (yellow line - both ECMWF), source: EUMeTrain, ePort
Figure 14-2: 11th October 2017 18:00 UTC surface analyse, source DWD
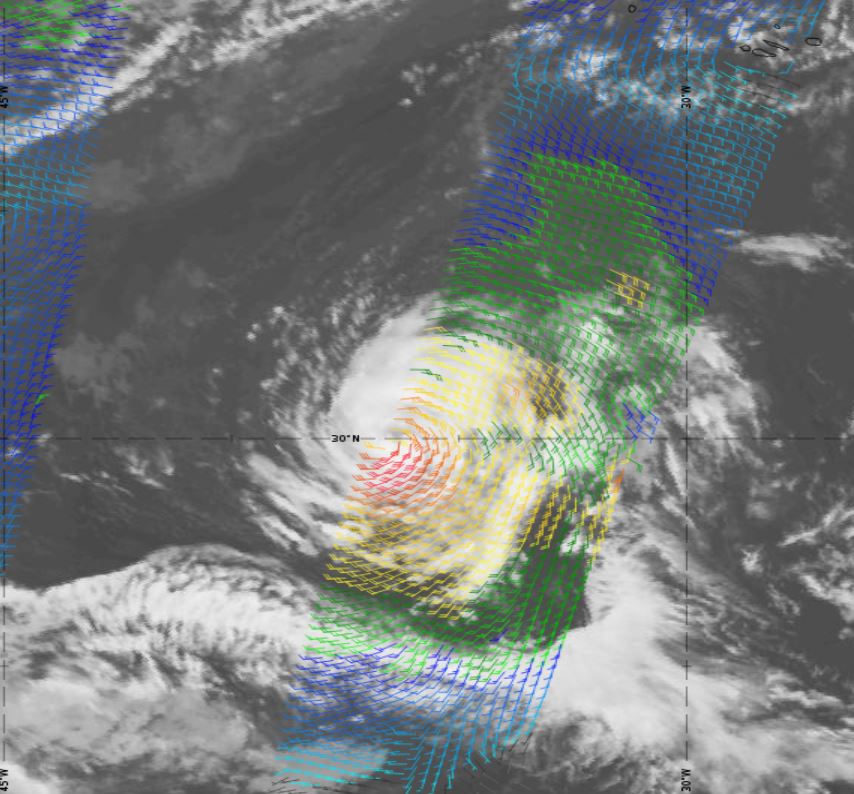
Figure 15: ASCAT wind (colour wind barbs) overlaid on Meteosat 10 IR 10.8 on 11th October 2017, 18:00 UTC (source: EUMeTrain, ePort) (click on the image to zoom in)
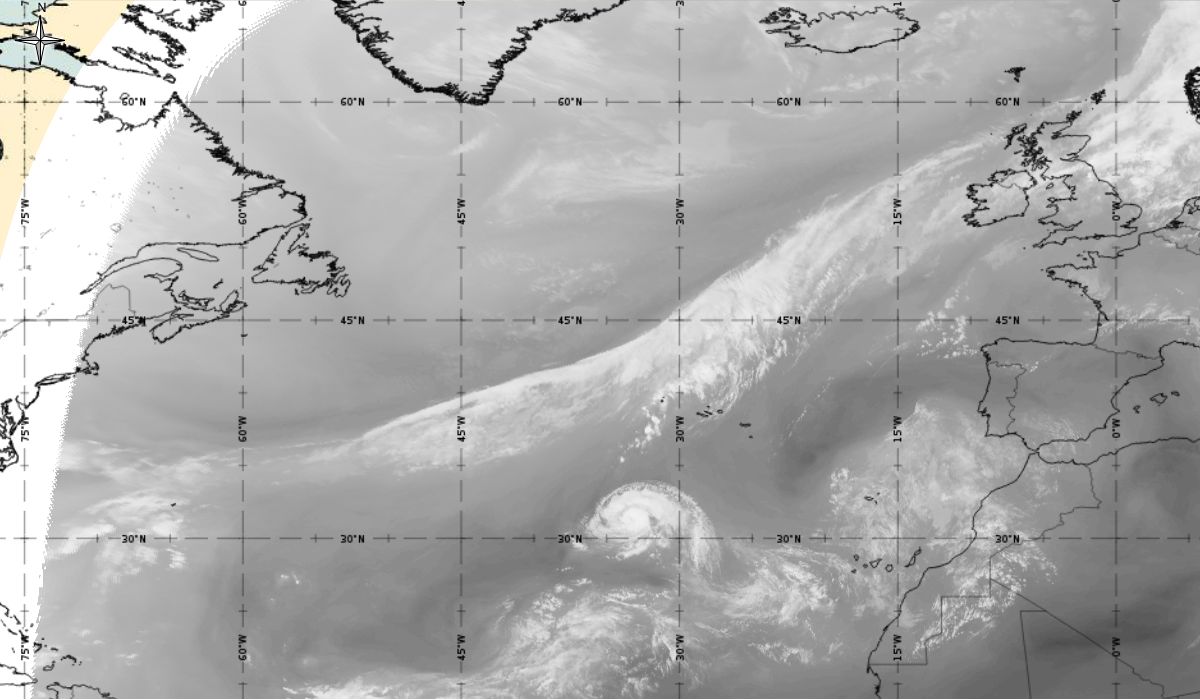
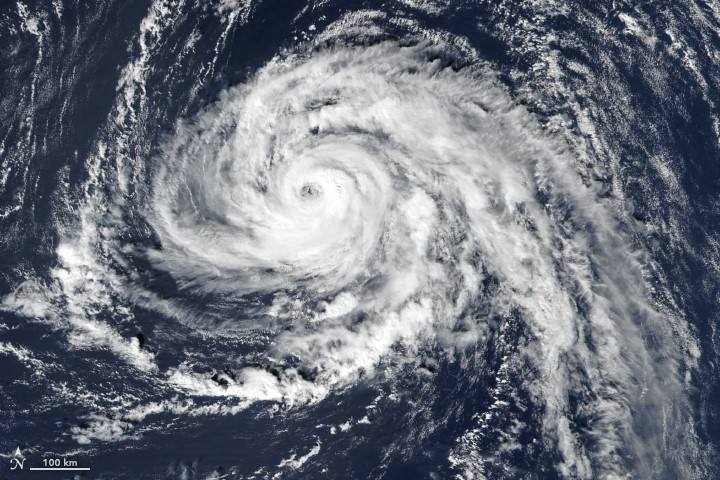
The favourable conditions for further development (SST, weak wind shear, conditional instability) were present, therefore, in the next 24 hours Ophelia strengthened to category 2 - MODIS satellite image. After another relatively stationary phase, Ophelia moved in a south-westerly flow, at the front of the trough approaching from the west (Figure 16.1 and 16.2). It was still moving through an area of low shear and this, combined with cooler than normal upper level temperatures, helped to maintain convection around the eye of the hurricane.
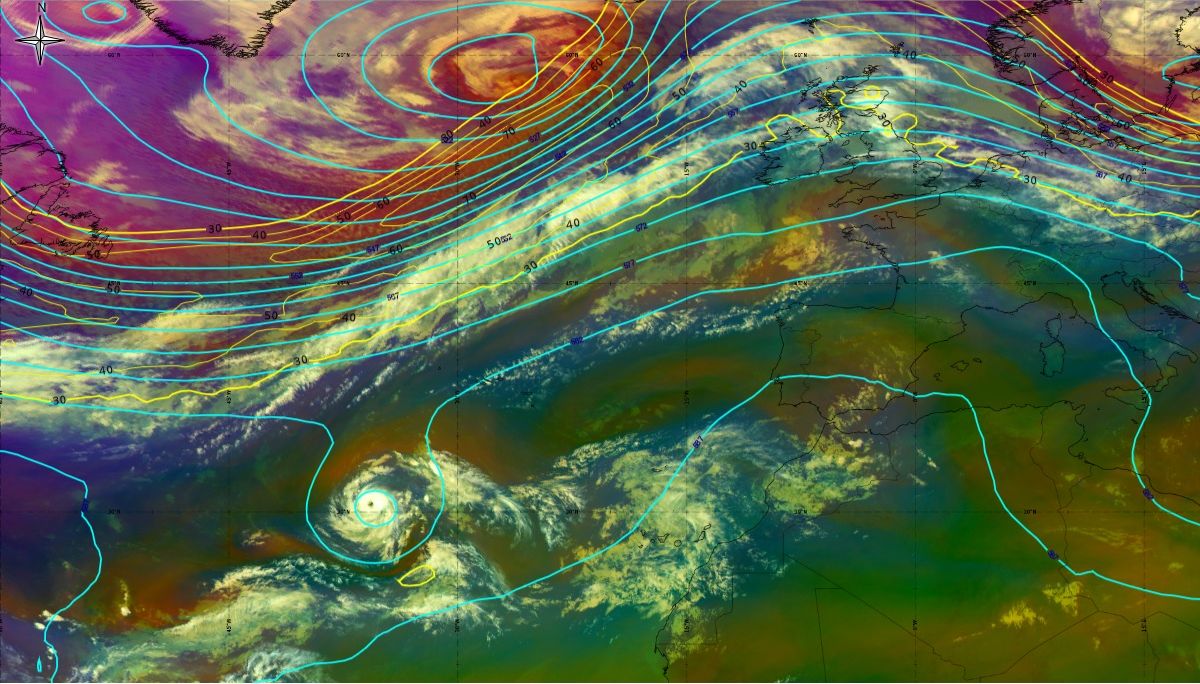
Figure 16-1: 12th October 2017 18:00 UTC - MSG Airmass RGB, geopotential height at 500 hPa (blue line), isotach at 300 hPa (yellow line - both ECMWF), source: EUMeTrain, ePort
Figure 16-2: 12th October 2017 18:00 UTC surface analyse, source DWD
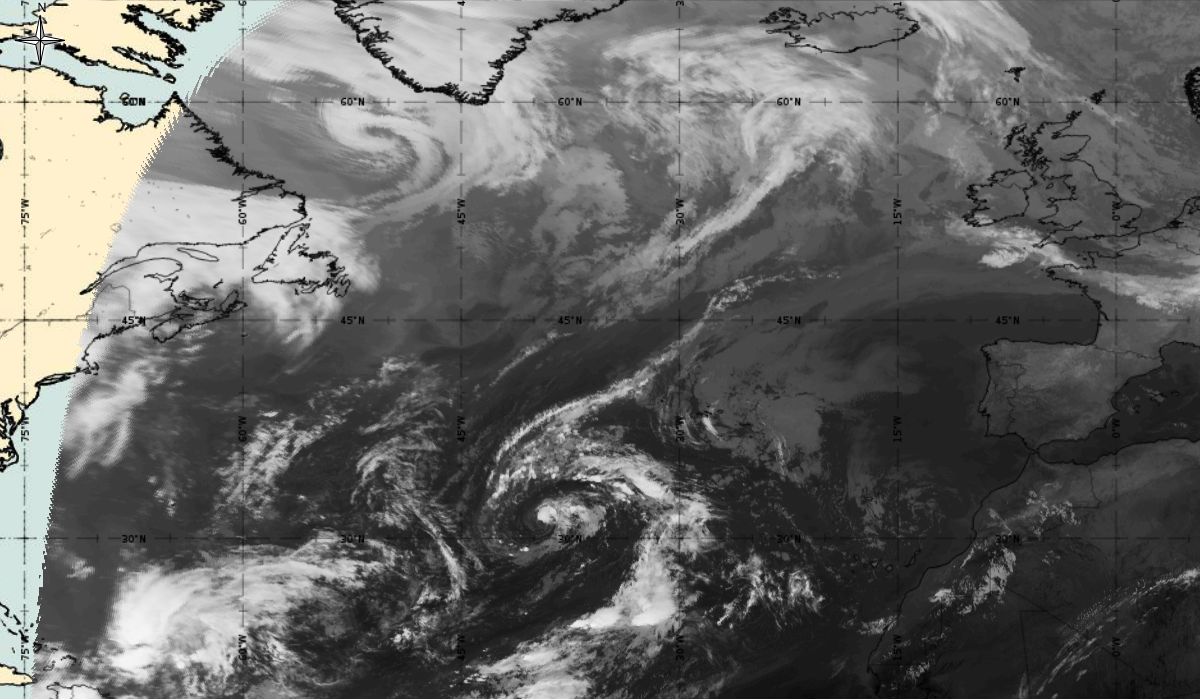
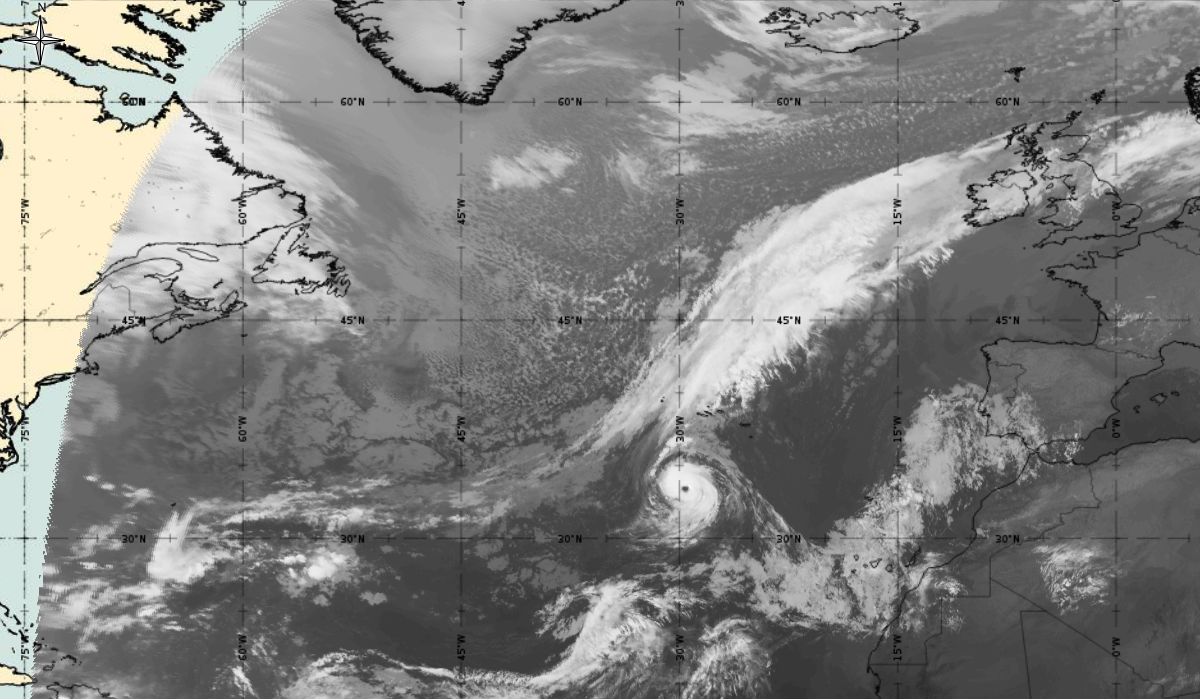
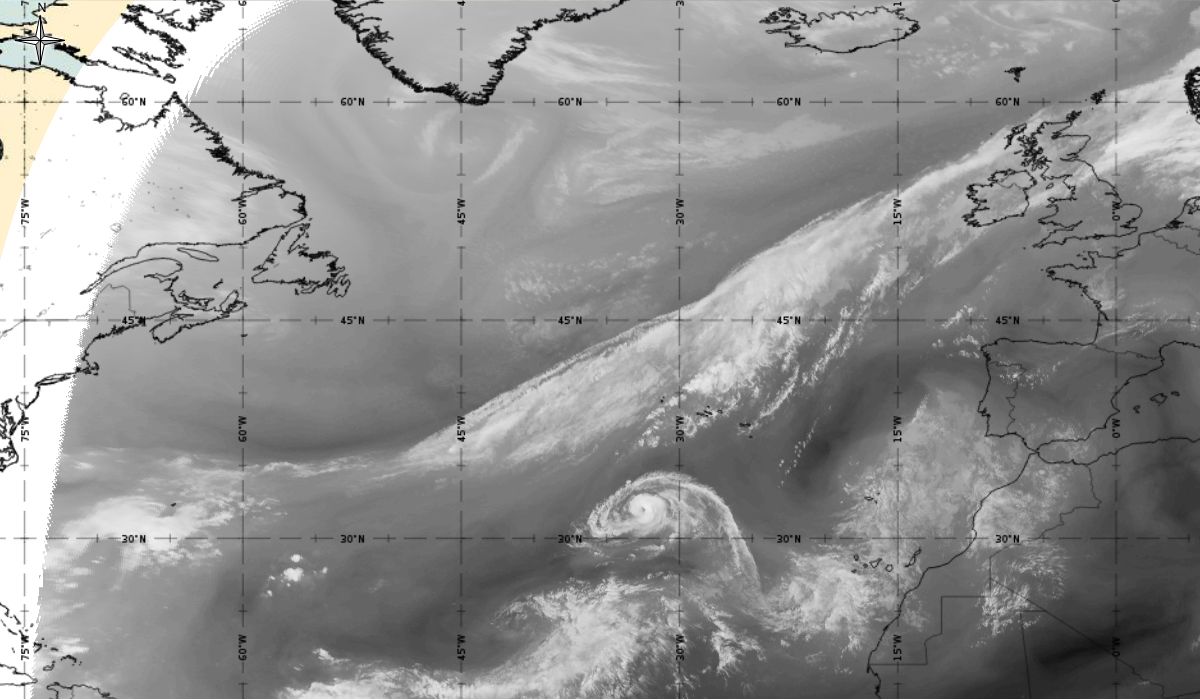
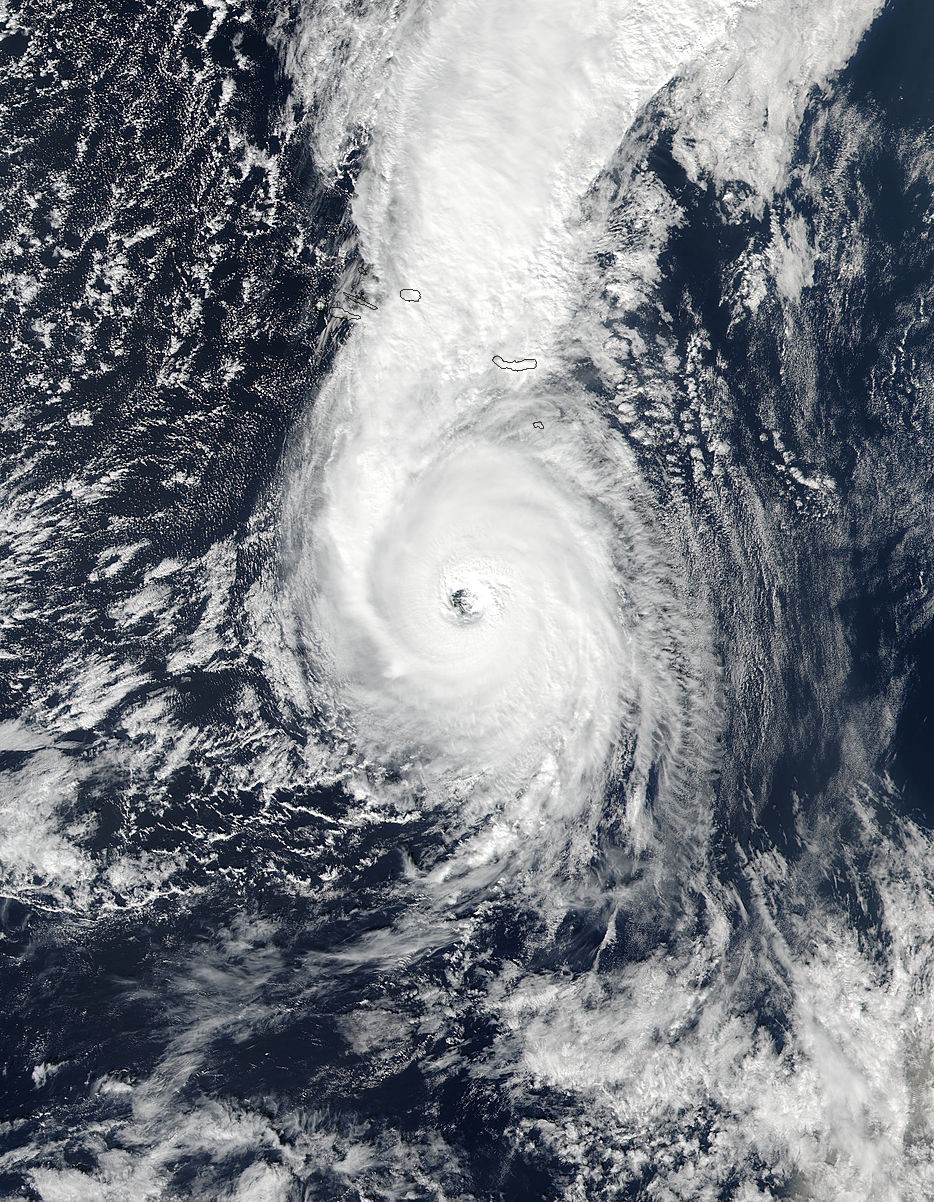
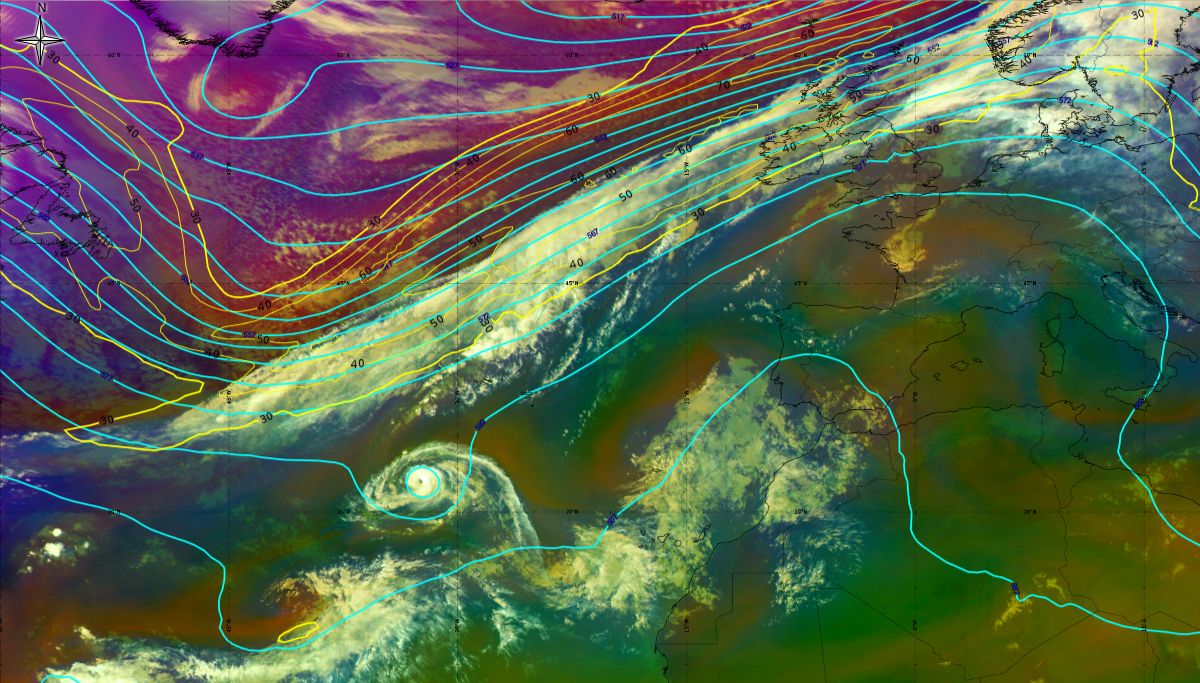
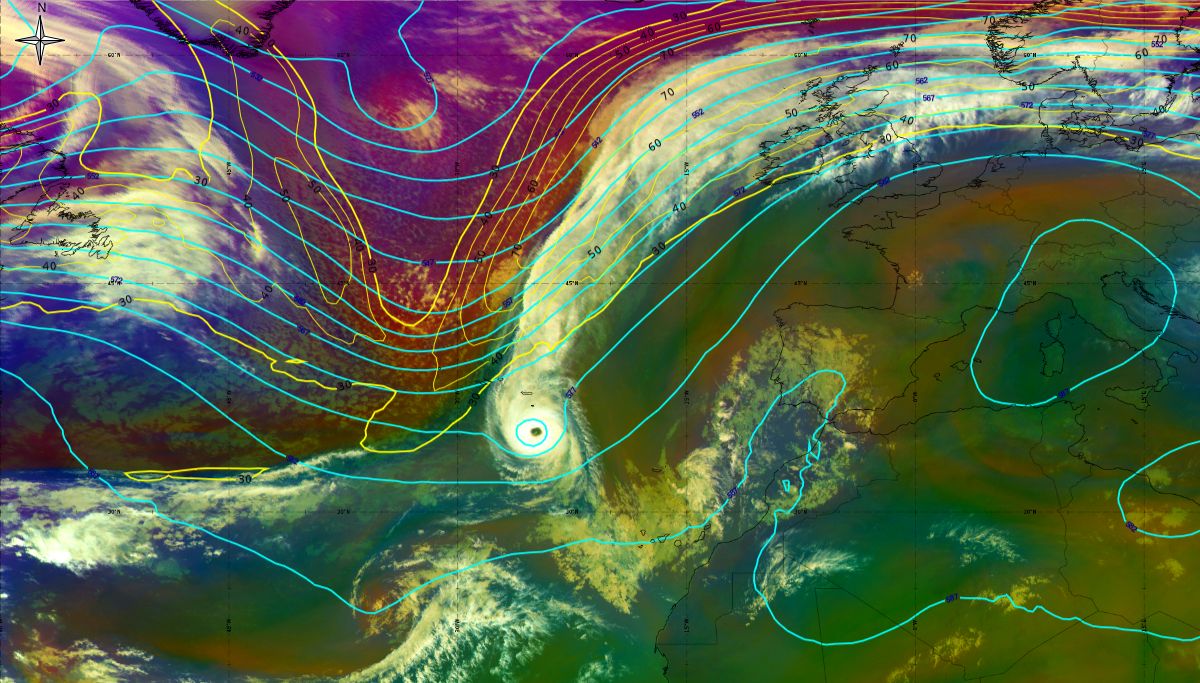
Ophelia moved slowly towards the northeast in the south-westerly flow. Due to another episode of decreasing of wind shear, and despite moving over relatively cooler sea surface temperatures (less than 26 °C), there was a new strengthening phase with Ophelia becoming a Category 3 hurricane on 14th October 12:00 UTC, when it was located 500 nautical miles (about 920 km) southwest of the Azores (Figure 17.1 and 17.2). Wind speed reached its highest peak intensity of 100 kt by the 15th October and lasted for 6 hours.
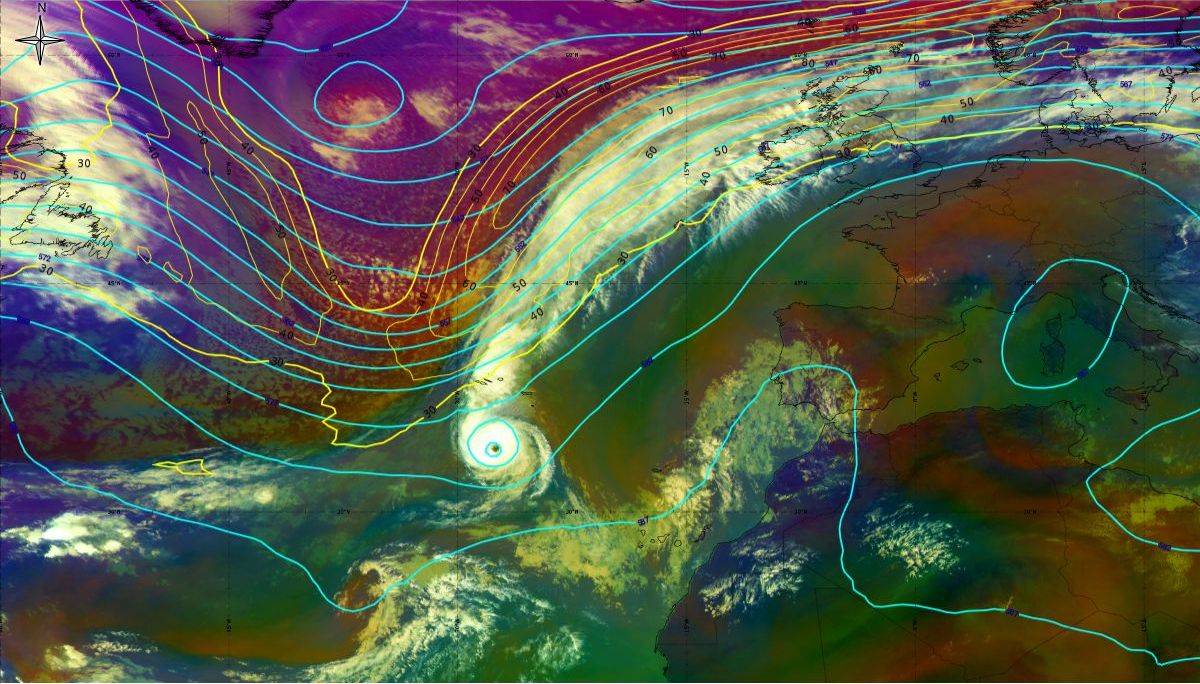
Figure 17-1: 14th October 2017 12:00 UTC - MSG Airmass RGB, geopotential height at 500 hPa (blue line), isotach at 300 hPa (yellow line - both ECMWF), source: EUMeTrain, ePort
Figure 17-2: 14th October 2017 12:00 UTC surface analyse, source DWD
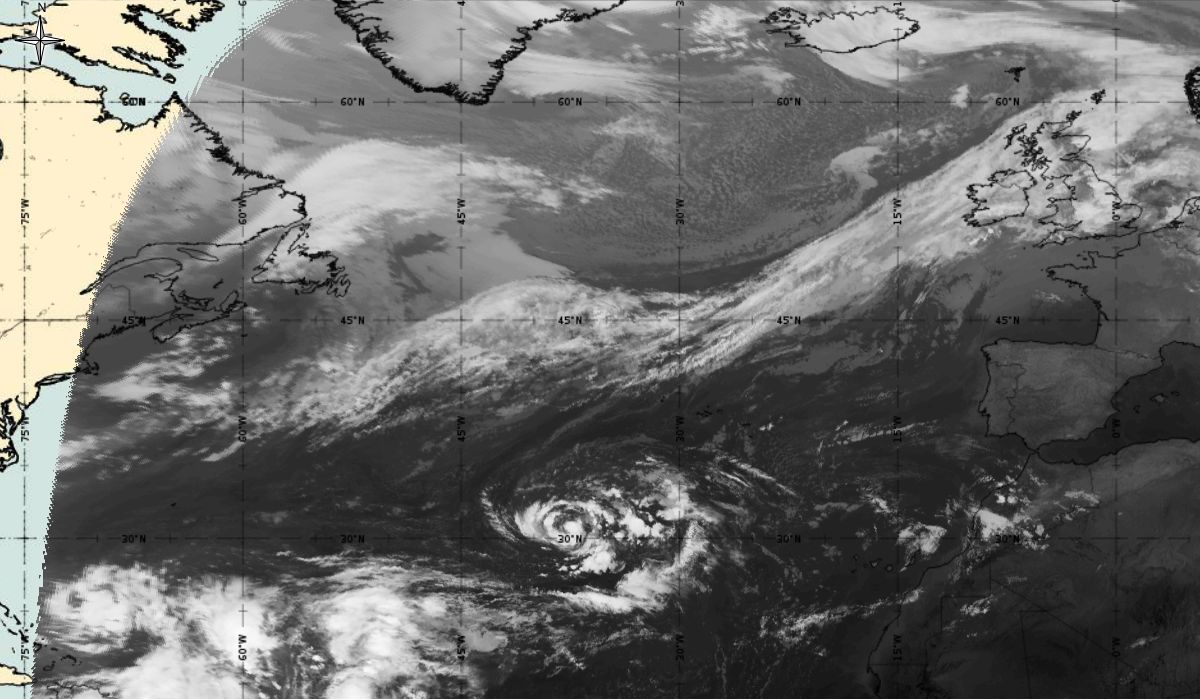
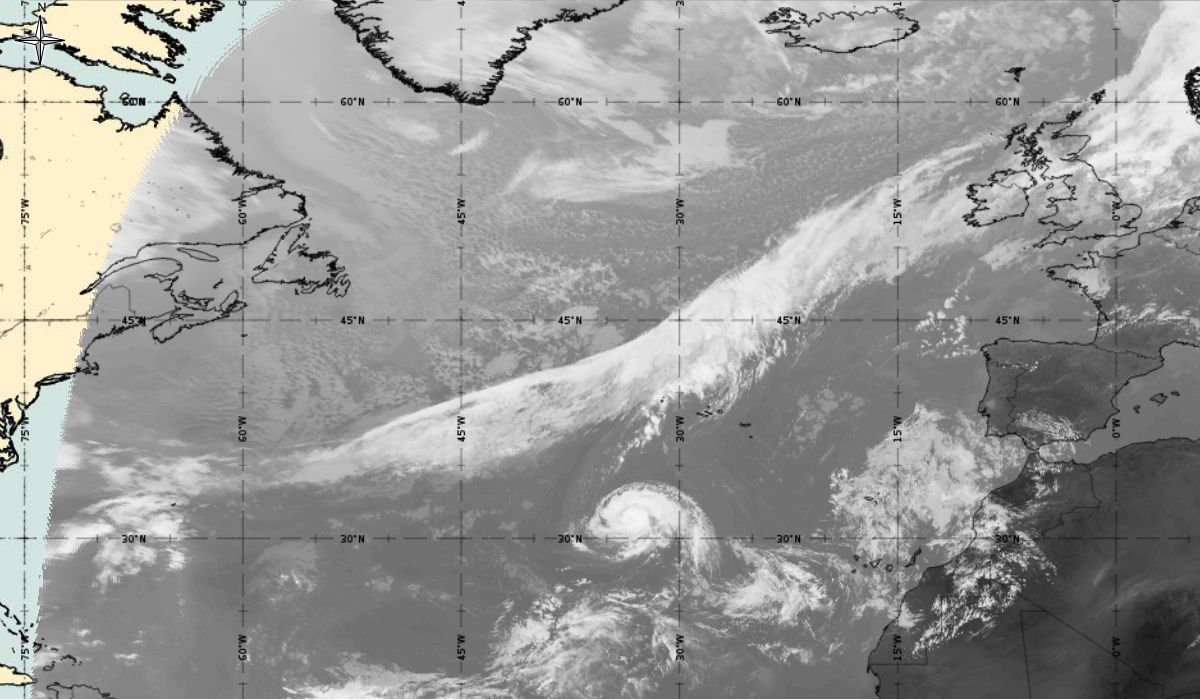
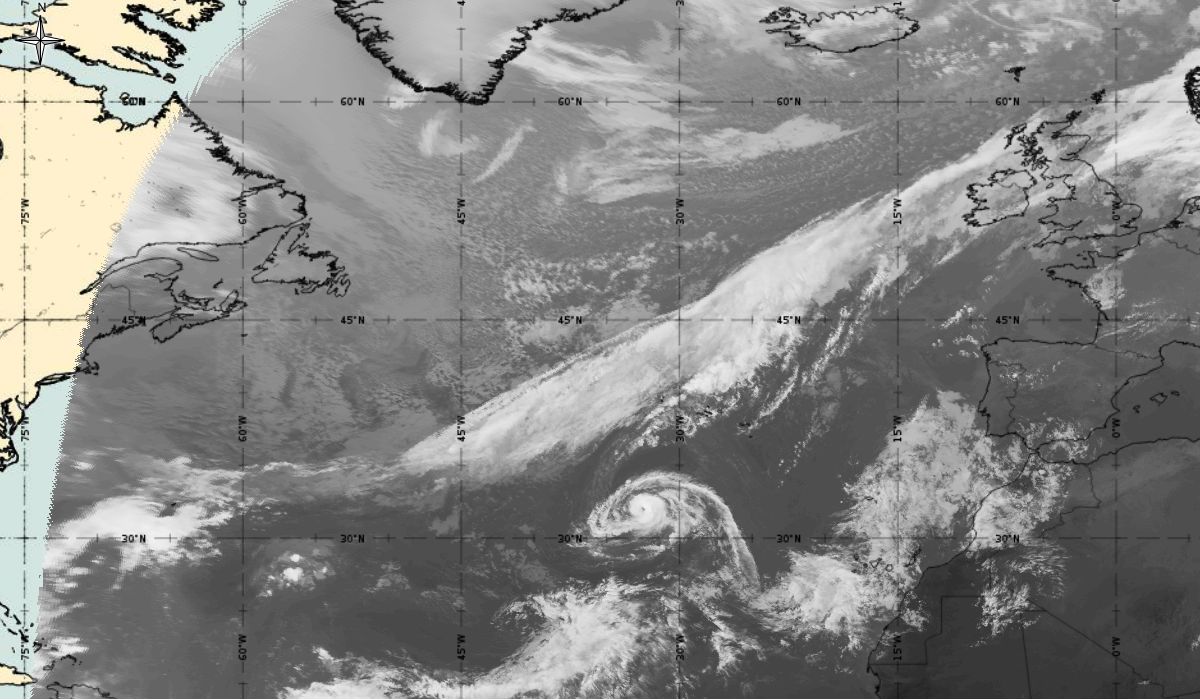
A well organised convection with cloud top temperature lower than -60°C around the eye of the hurricane is present. With a weakening of the hurricane, the temperature of the cloud tops increases, and convective development is less pronounced. (Figure 18)
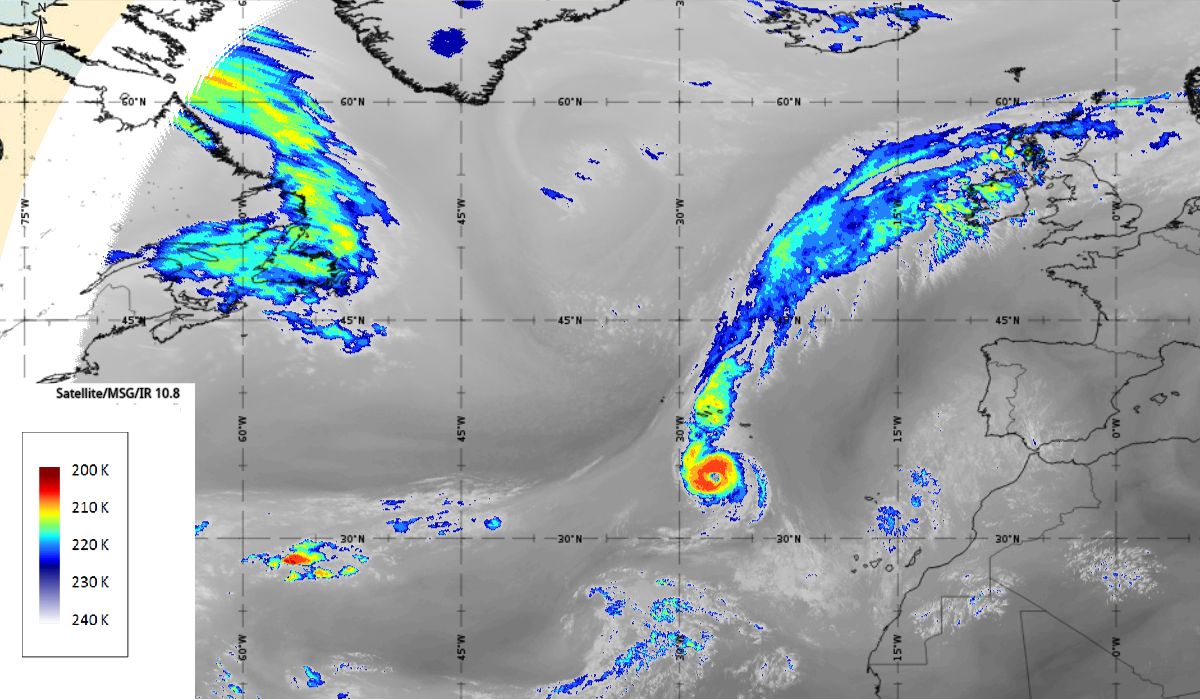
Figure 18: Meteosat 10 Enhanced IR10.8, 14th October 2017, 12:00 UTC/15th October 2017,00:00 UTC/15th October 2017,12UTC (source: EUMeTrain, ePort)
Note: Click on the image to go through the gallery
The yellow colour of clouds in Severe storm RGB (Figure 19) in the hurricane structure indicate thick ice cloud with small ice crystals on the top which is a sign of a strong updraft. Even stronger convection with cold cloud top can be noticed north of the centre of the hurricane as a part of the cold front stretching from northeast to the southwest. At the same time on the 24-hour microphysics RGB, dark red colour, represents thick, high, and cold ice clouds and black stripes on the outer sides of the hurricane representing cirrus clouds.
|
|
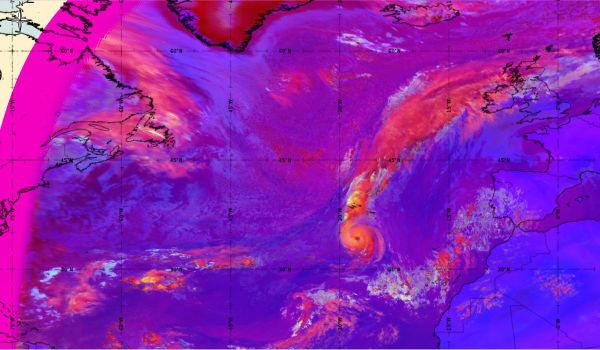
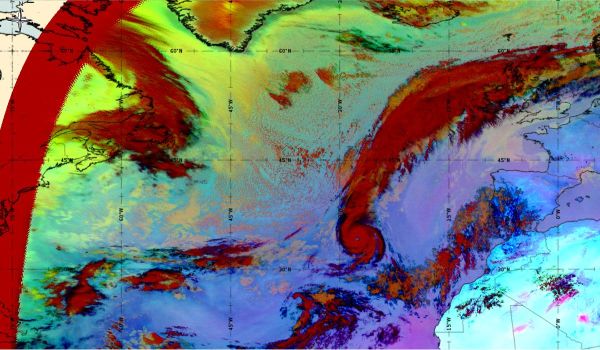
Figure 19: Severe storm RGB 14th October 2017, 12:00 UTC/24-hour Microphysics RGB (source: EUMeTrain, ePort)
Geopotential height at 500 hPa and Jets at 300 hPa (Airmass RGB)
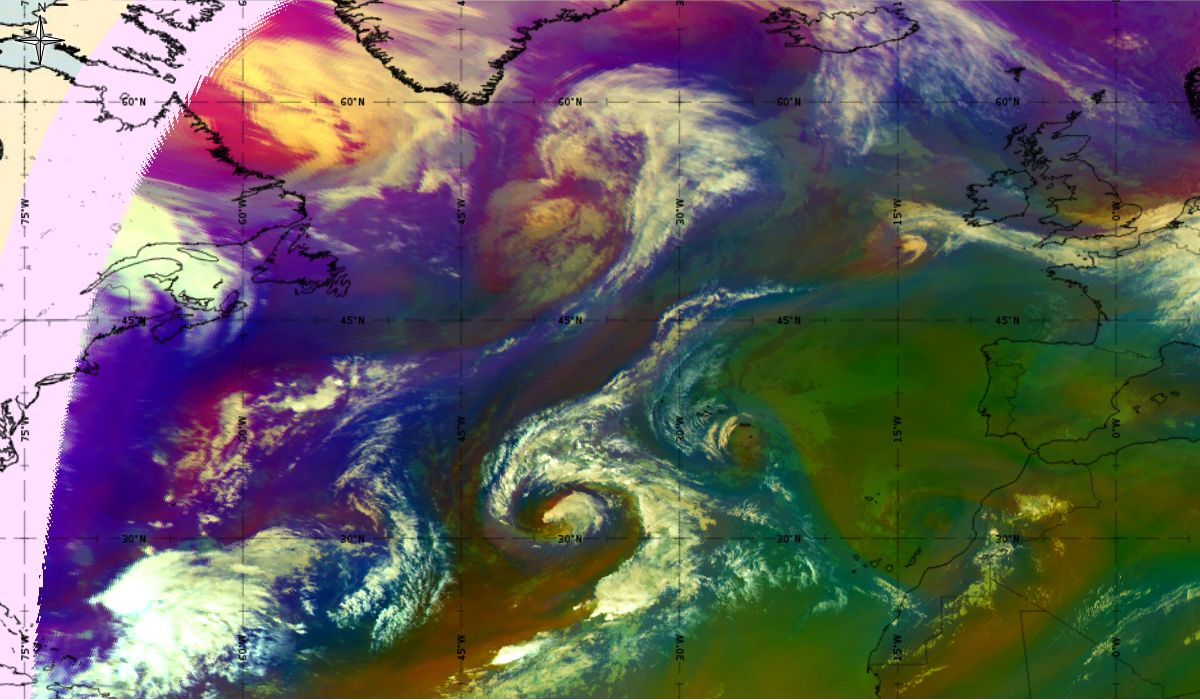
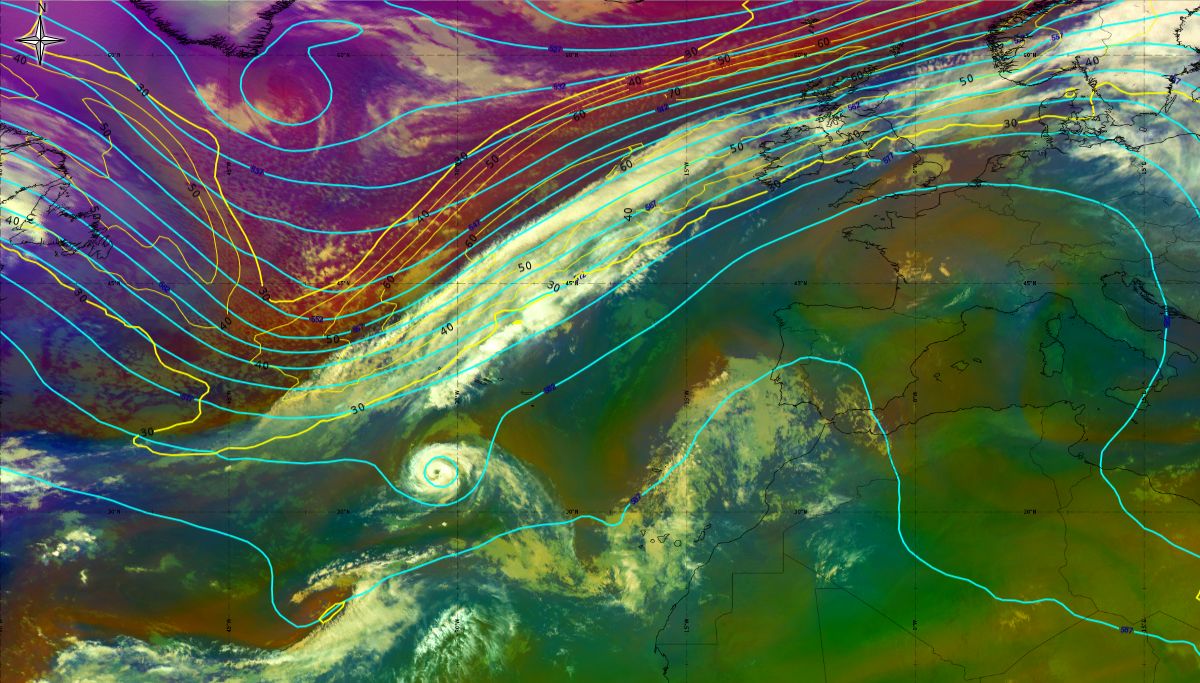
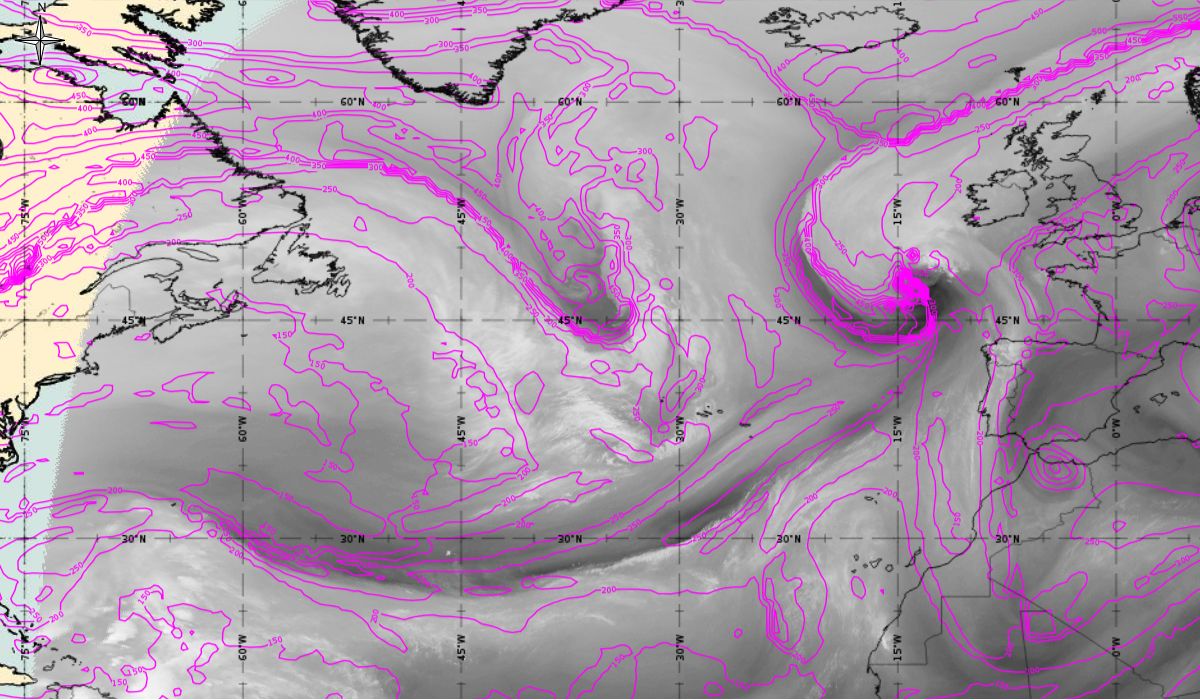
As we can see in this section, the jet stream plays a role in the second part of the lifetime of Ophelia (Figure 20). After Ophelia reached its maximum strength (14 October 12 UTC), the interaction with the strong upper level trough (visible in isolines of geopotential height at 500 hPa) and jet stream flow caused a gradual weakening of the hurricane. The jet stream is clearly visible in the satellite images, in transition from blue to red colours, like a pinstripe at the rear side of the cloud band. The jet (yellow lines - wind speed up to 70 m/s) is coming from behind/above cold front.
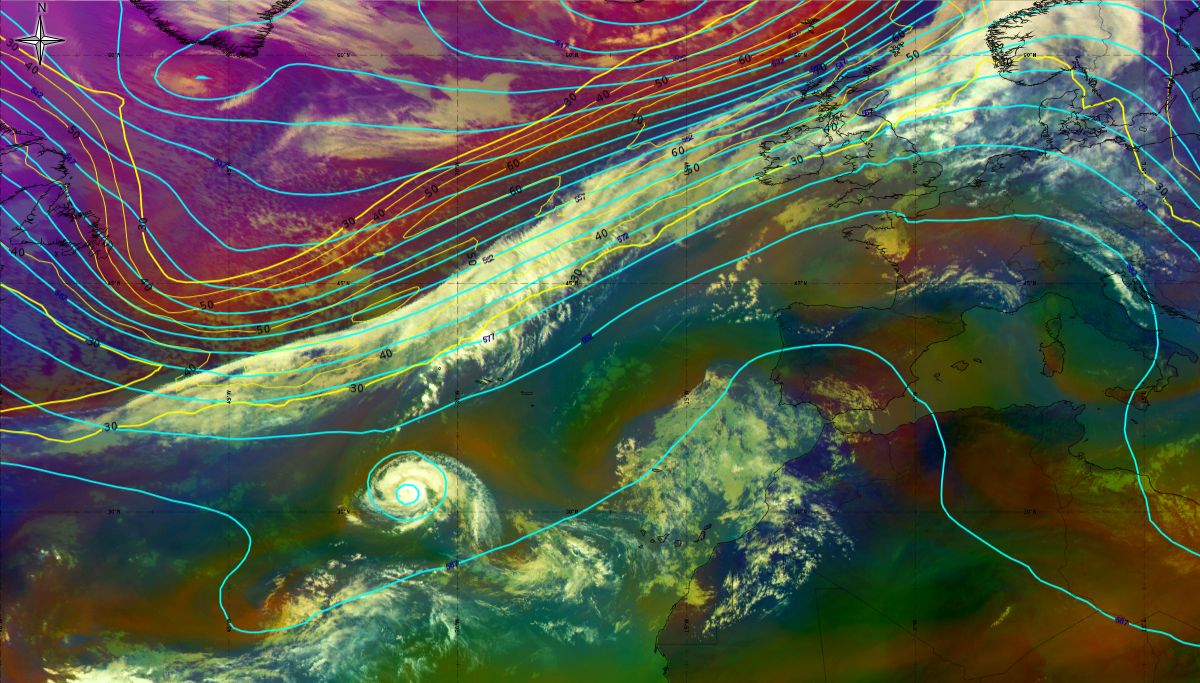
Figure 20: Geopotential height at 500 hPa (blue lines) and Jet at 300 hPa (yellow lines), Airmass RGB from 13th October 2017, 12:00 UTC to 15th October 2017, 06:00 UTC (source: EUMeTrain, ePort)
Note: Click on the image to go through the gallery
Temperature advection at 700 hPa (IR images)
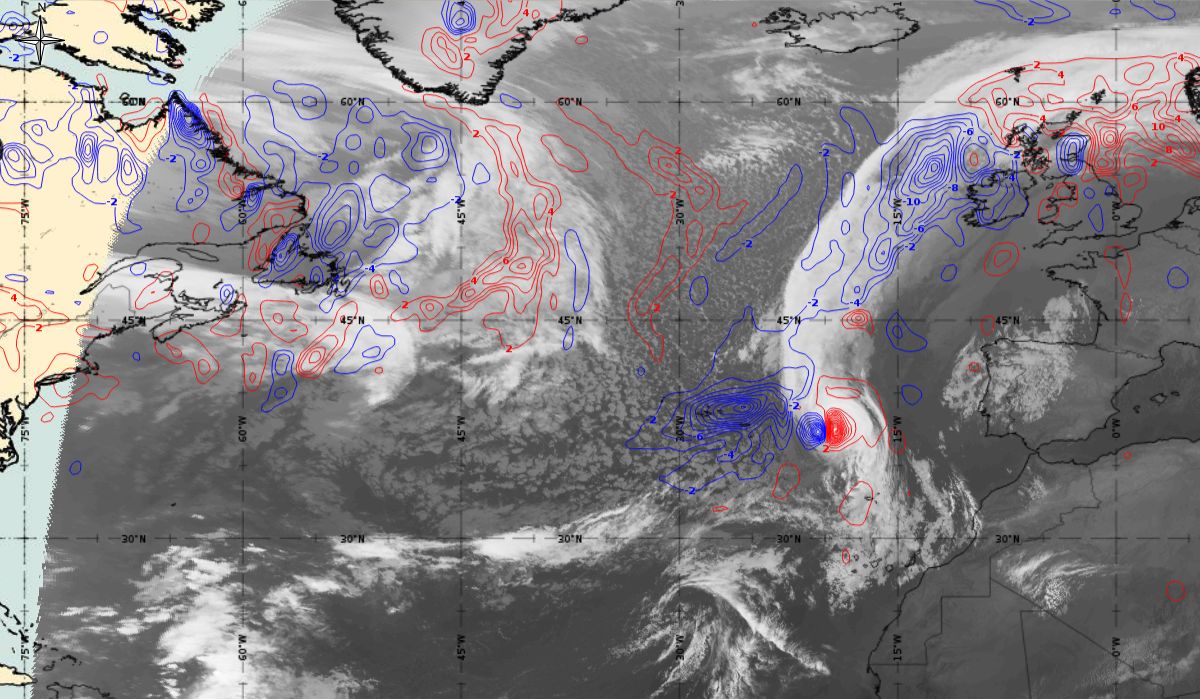
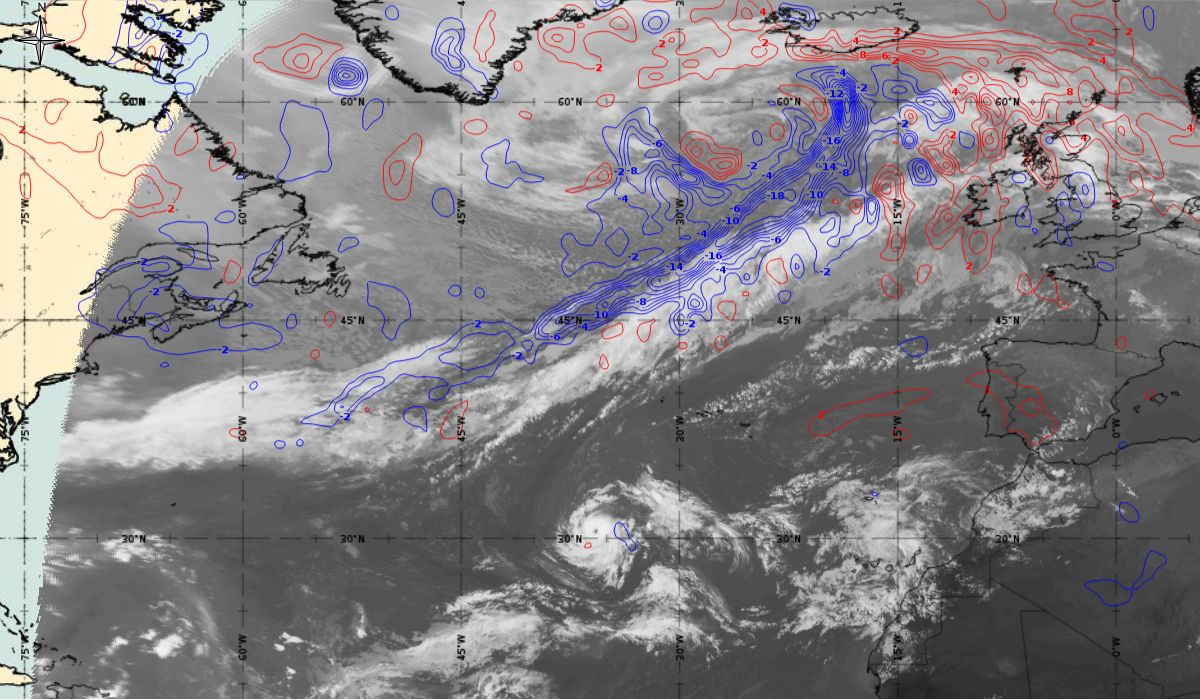
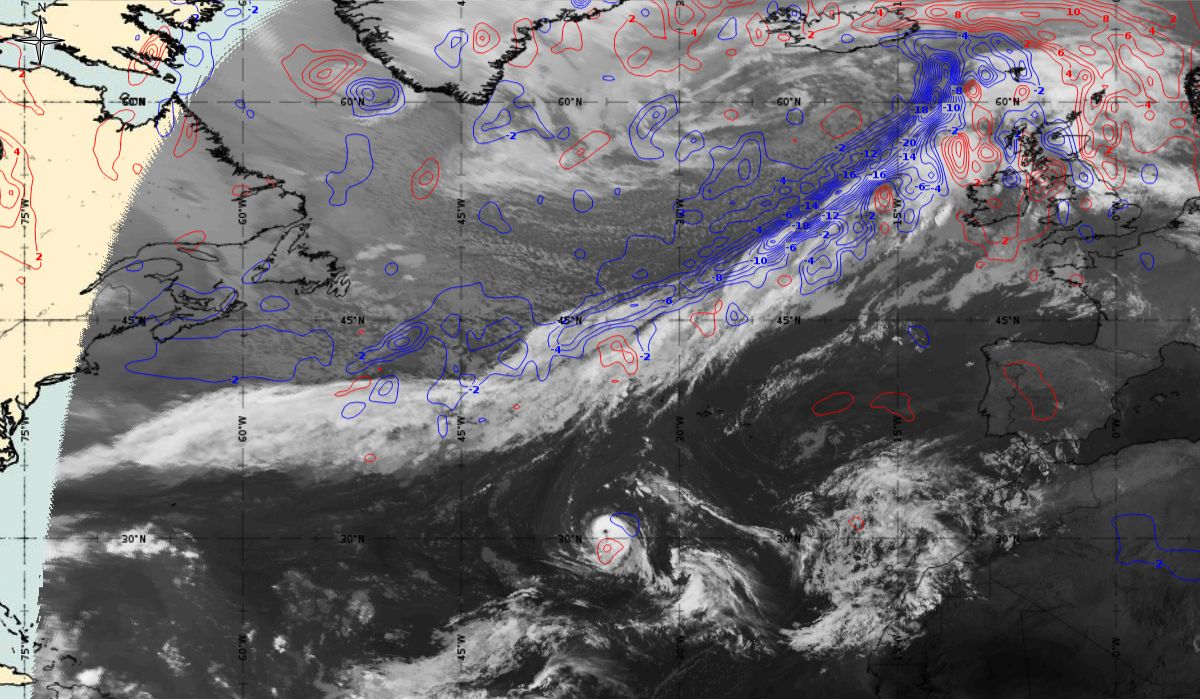
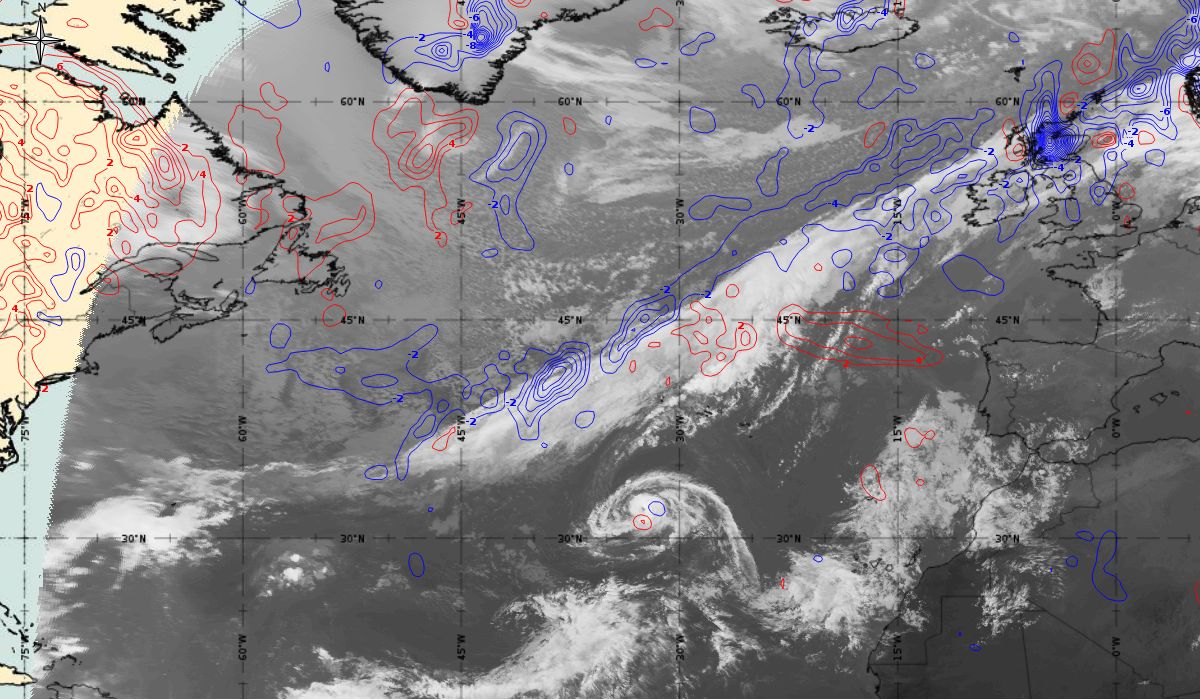
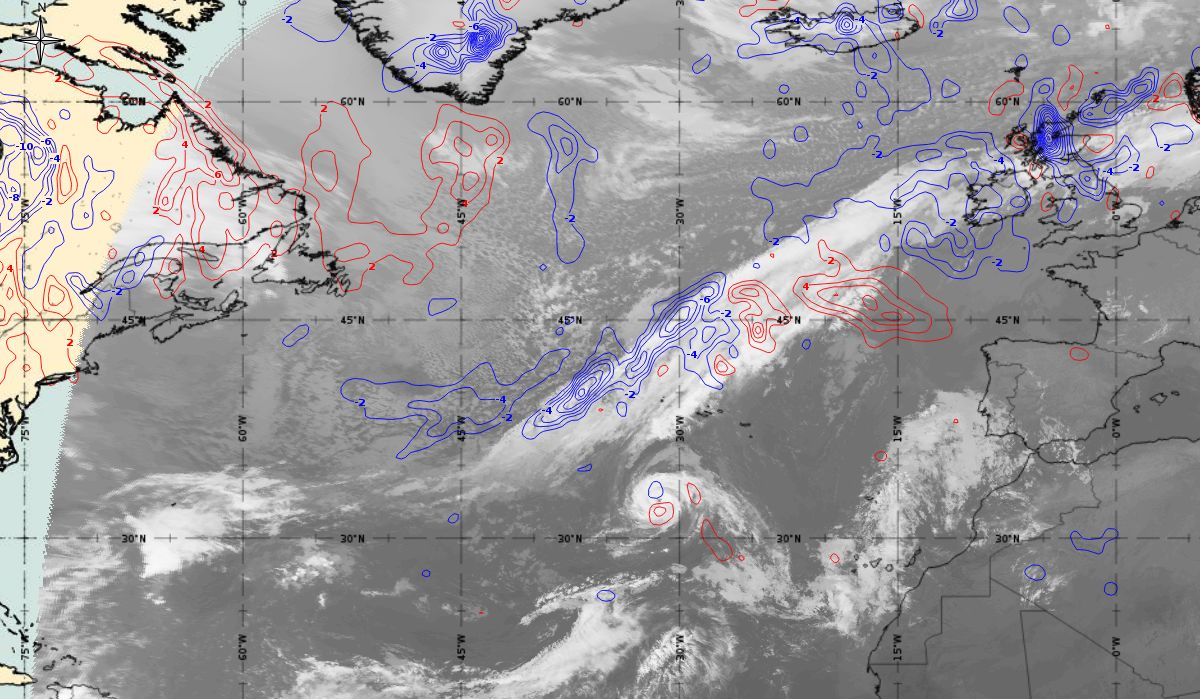
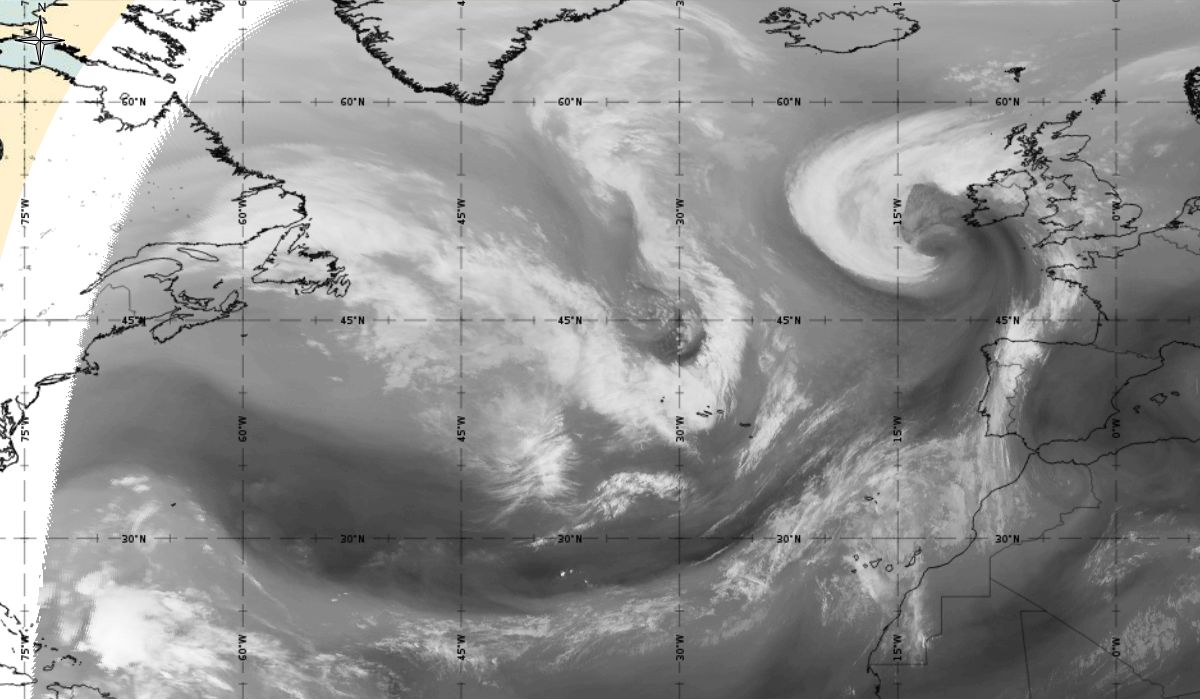
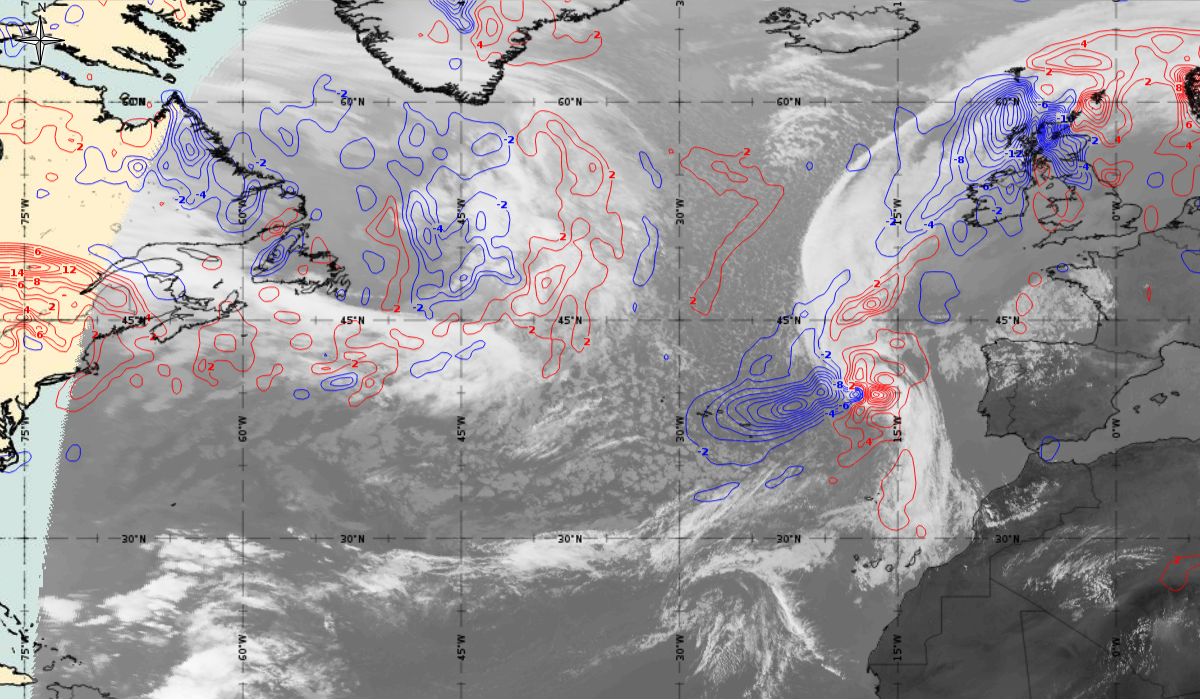
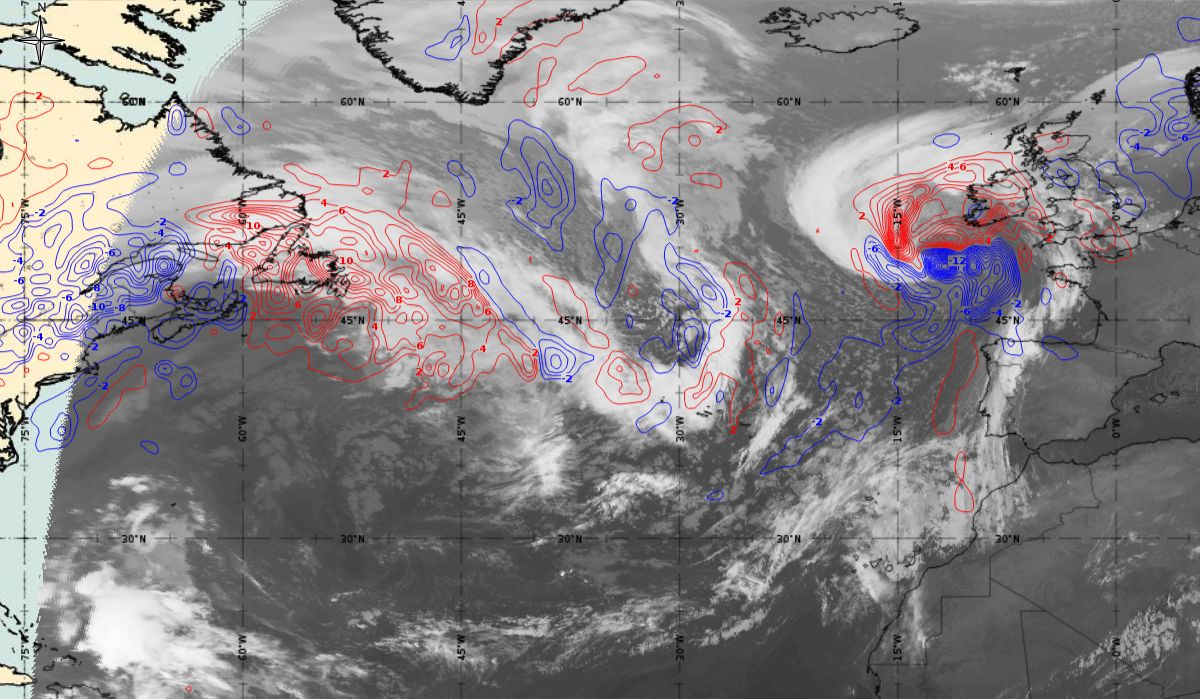
As mentioned before, the tropical storm, Ophelia, which evolved into a hurricane, derives its energy through latent heat from the warm ocean, making it a warm-core low. A warm core low has no temperature advection into it (Figure 21). A mostly symmetrical cloud structure of category 1 hurricane Ophelia could be seen separated from the frontal system located far north with expressive thermal advection. In the next two days, when Ophelia grew stronger and became a hurricane category 3, there was very little to no temperature advection at 700 hPa. Once the hurricane is embedded in the strong upper level flow (15th October 00:00 UTC), at the leading edge of the upper level trough, the temperature advection become more pronounced.
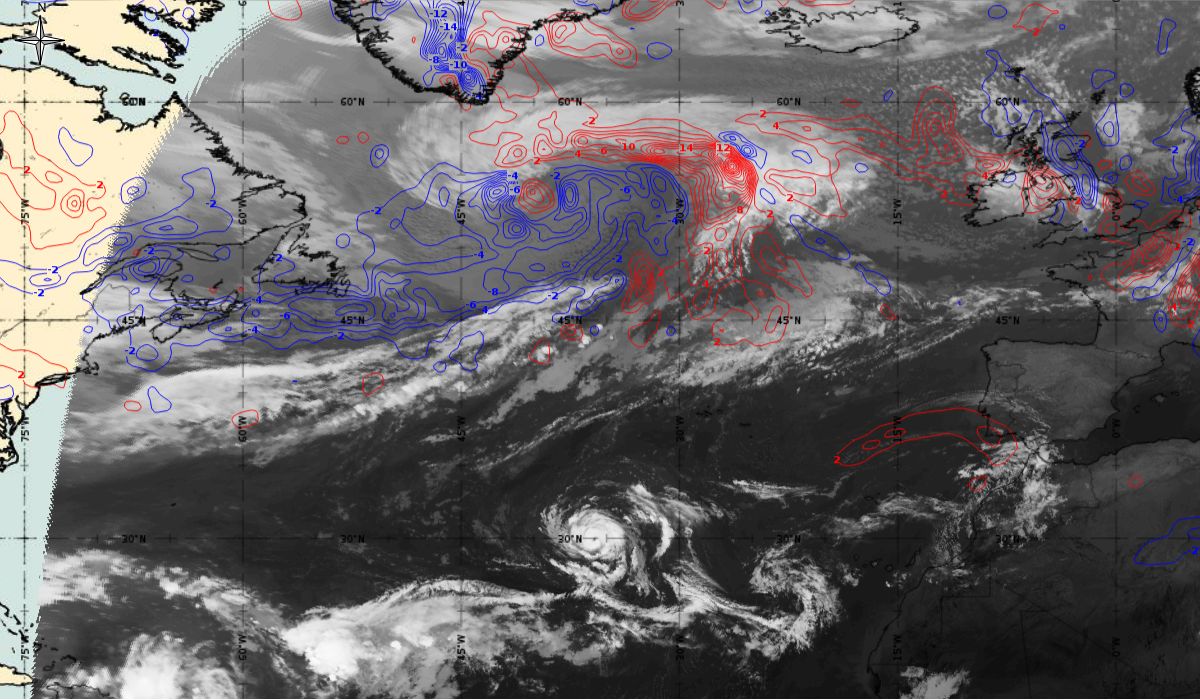
Figure 21: Temperature advection at 700 hPa (blue lines - cold advection, red lines - warm advection), Meteosat 10 IR 10.8 from 12th October 2017, 00:00 UTC to 15th October 2017, 00:00 UTC (source: EUMeTrain, ePort
Note: Click on the image to go through the gallery
Extratropical cyclone
Extratropical transition from hurricane Ophelia to extratropical depression
Loop 7 and 8: Meteosat 10 IR 10.8 and Airmass RGB animation from 15th October 2017, 06:00 UTC to 16th October 2017, 06:00 UTC (source: EUMeTrain, ePort)
Note: To go through individual images, click Loop 7 or
Loop 8
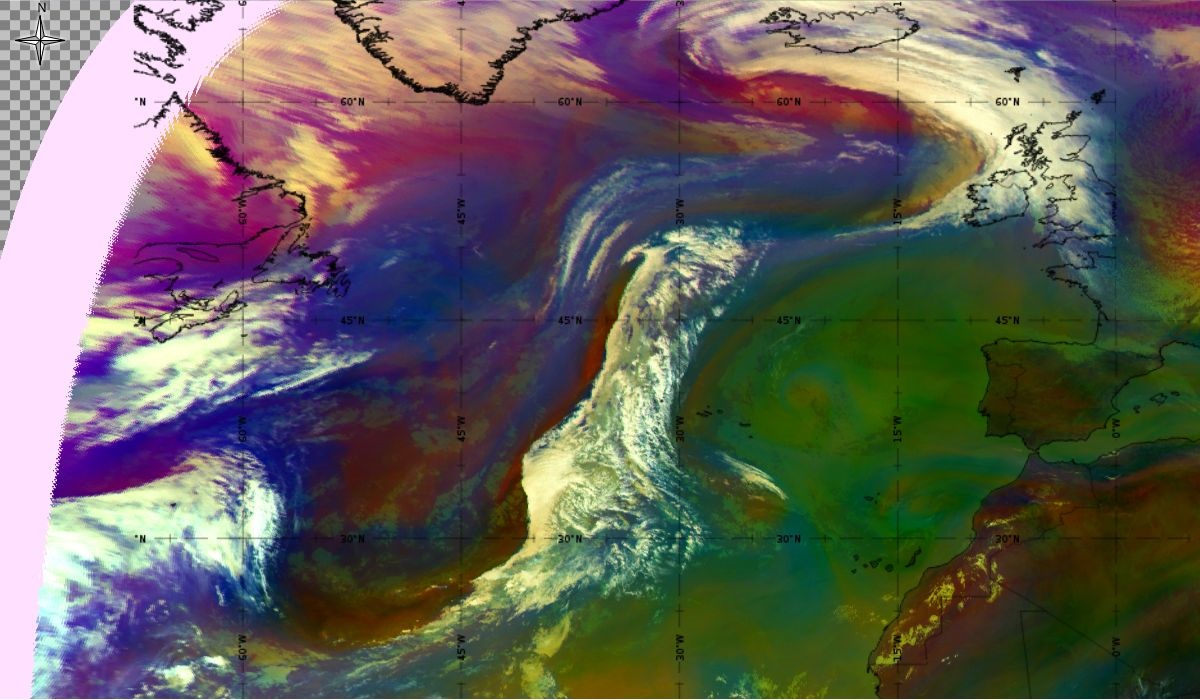
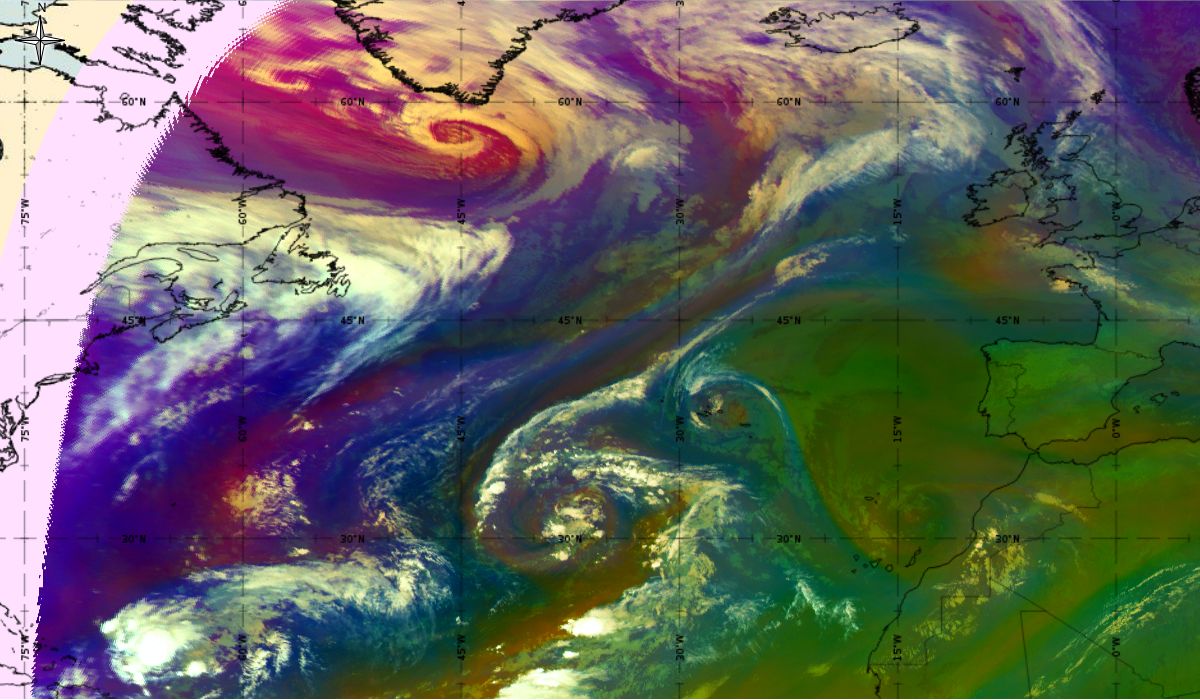
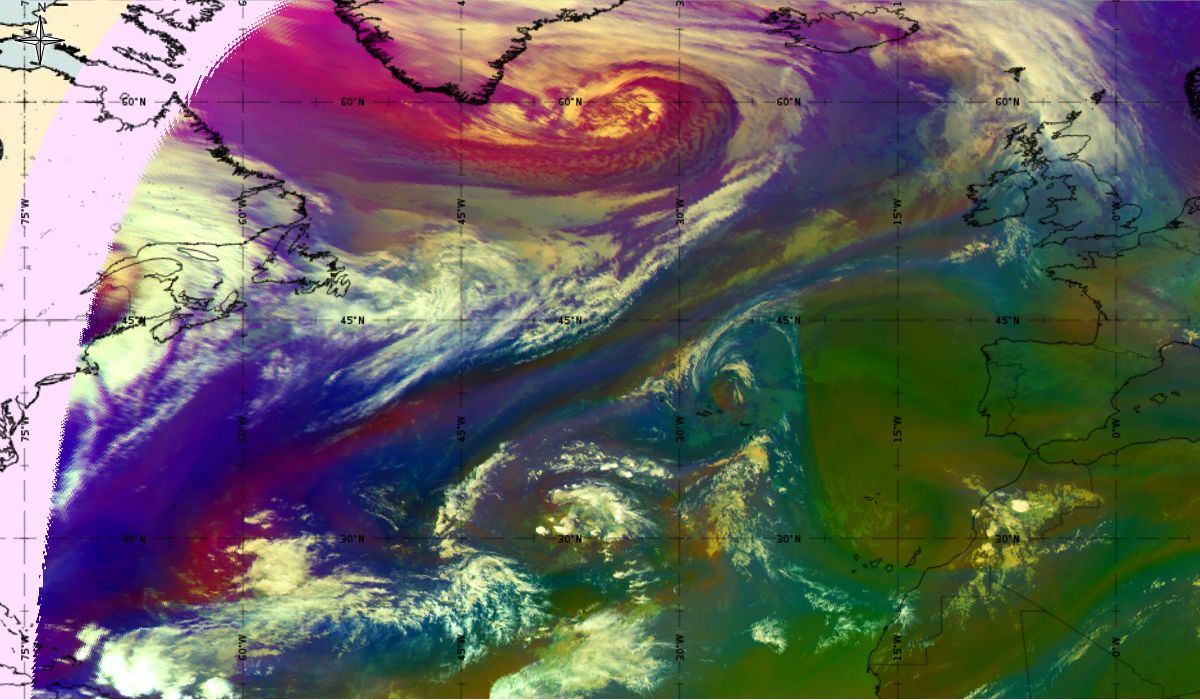
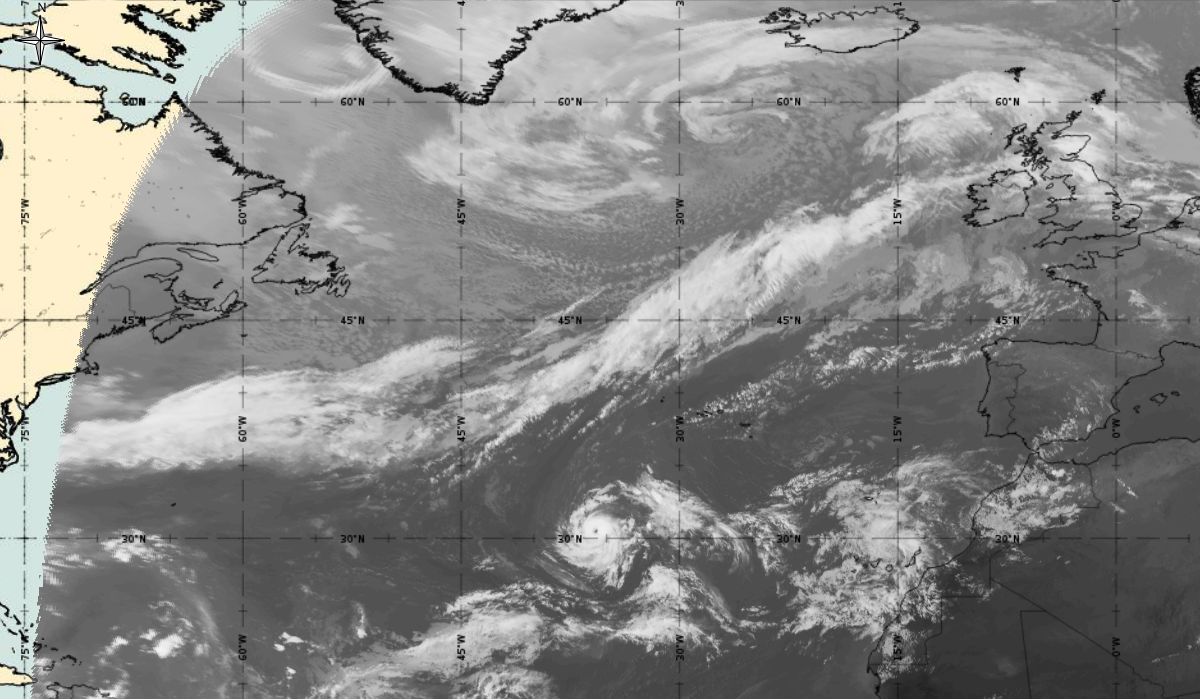
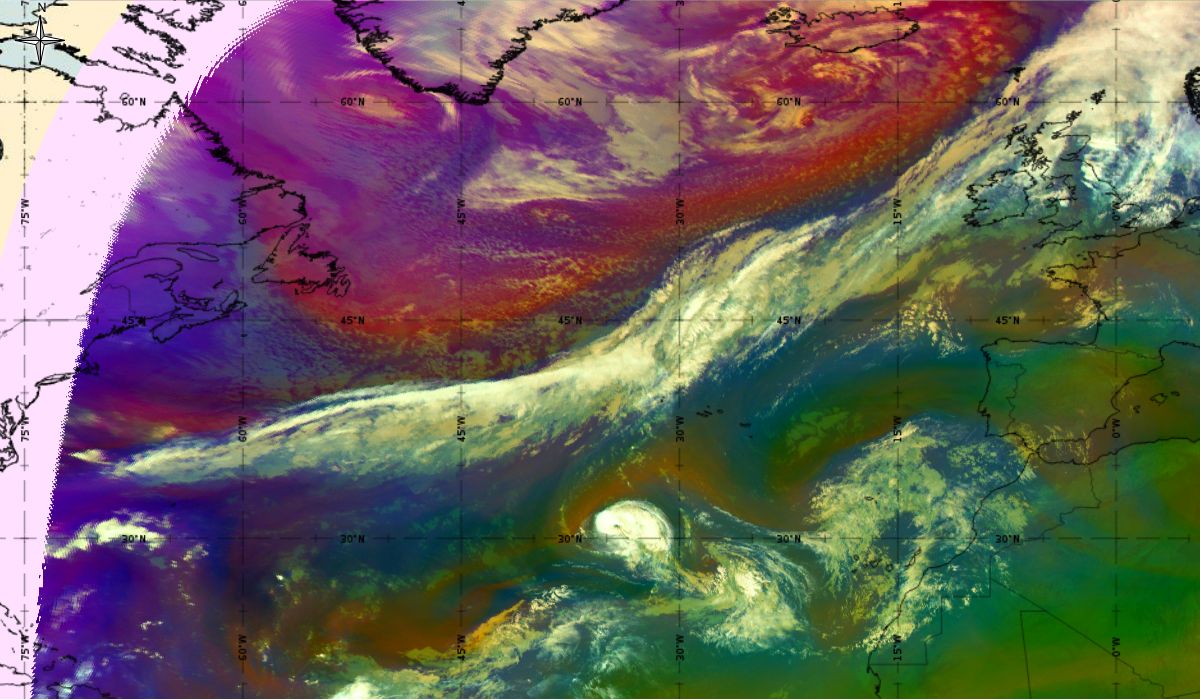
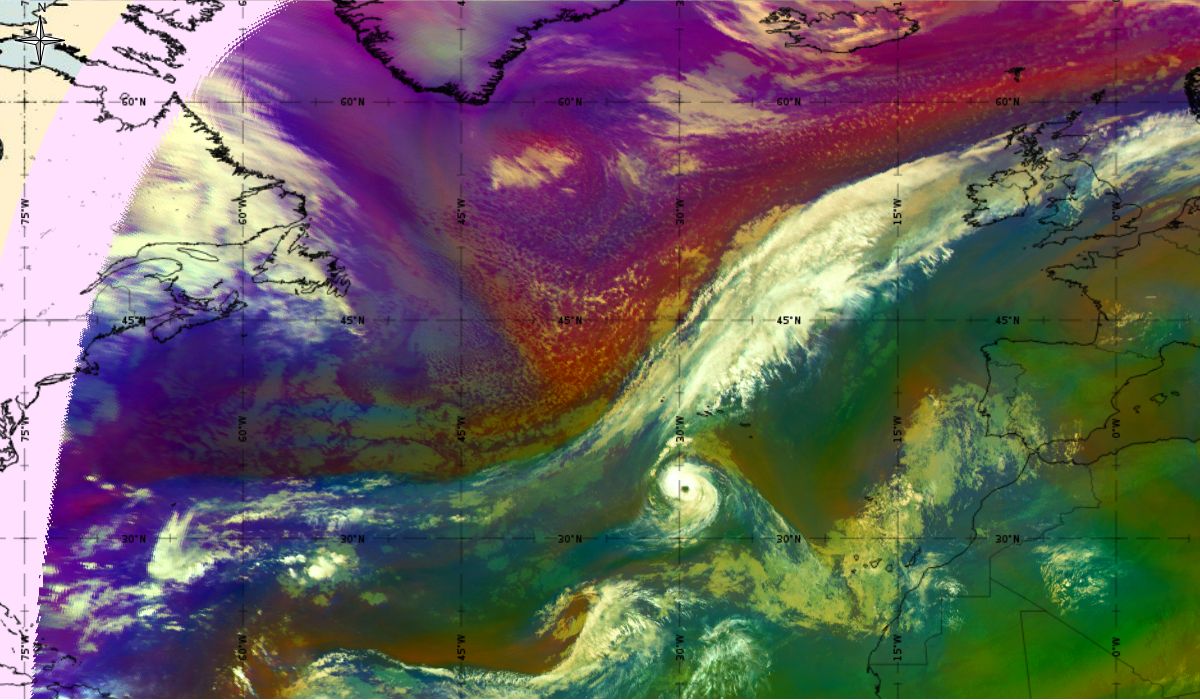
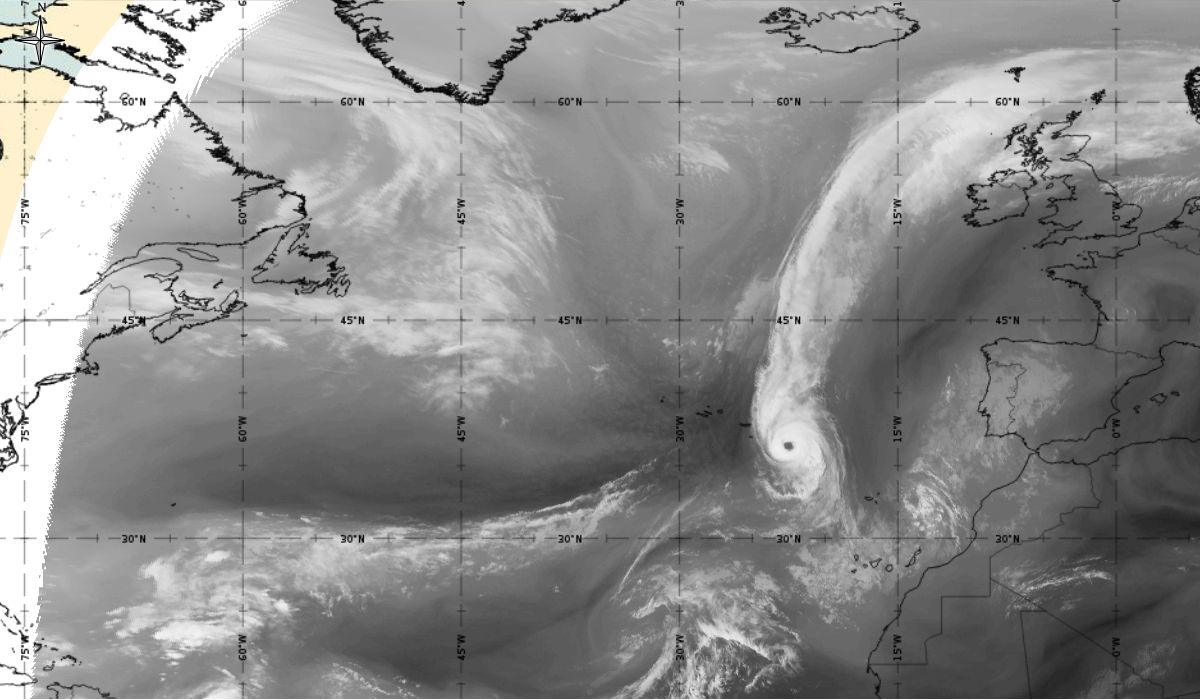
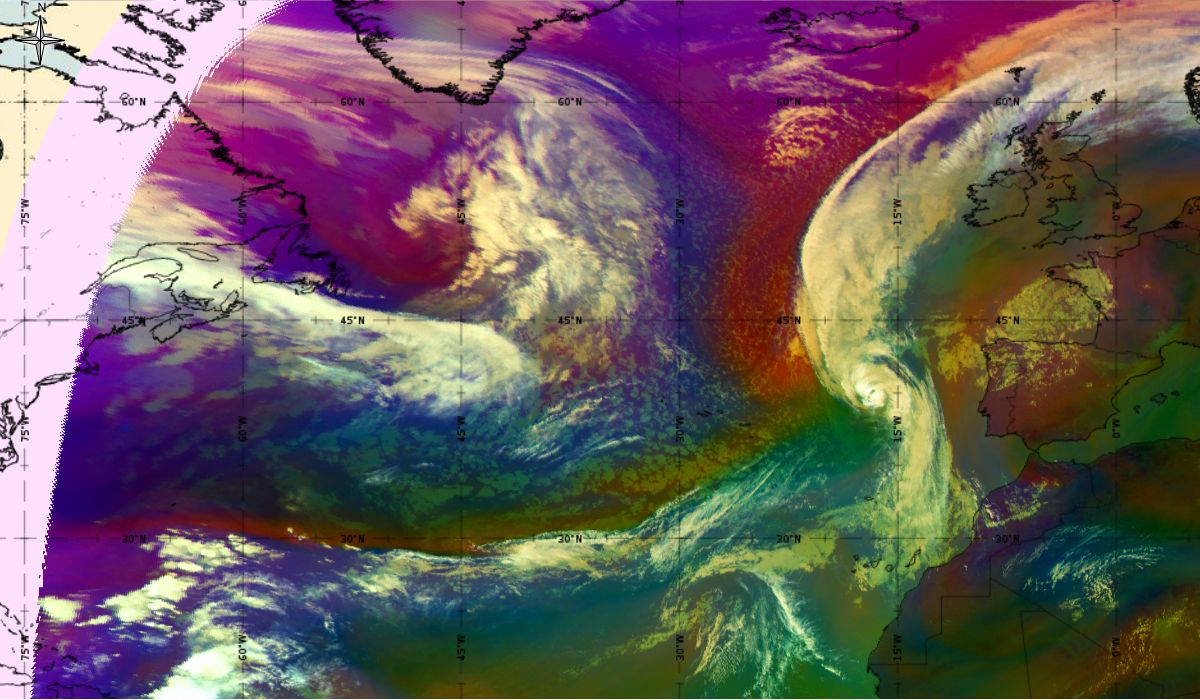
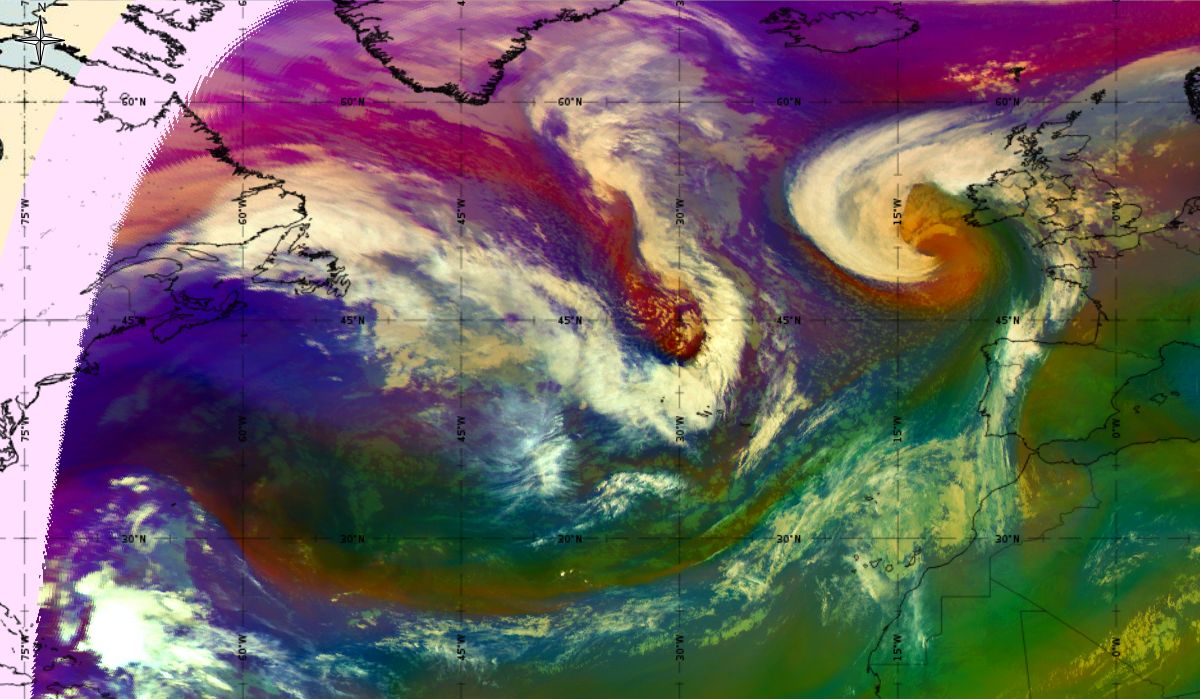
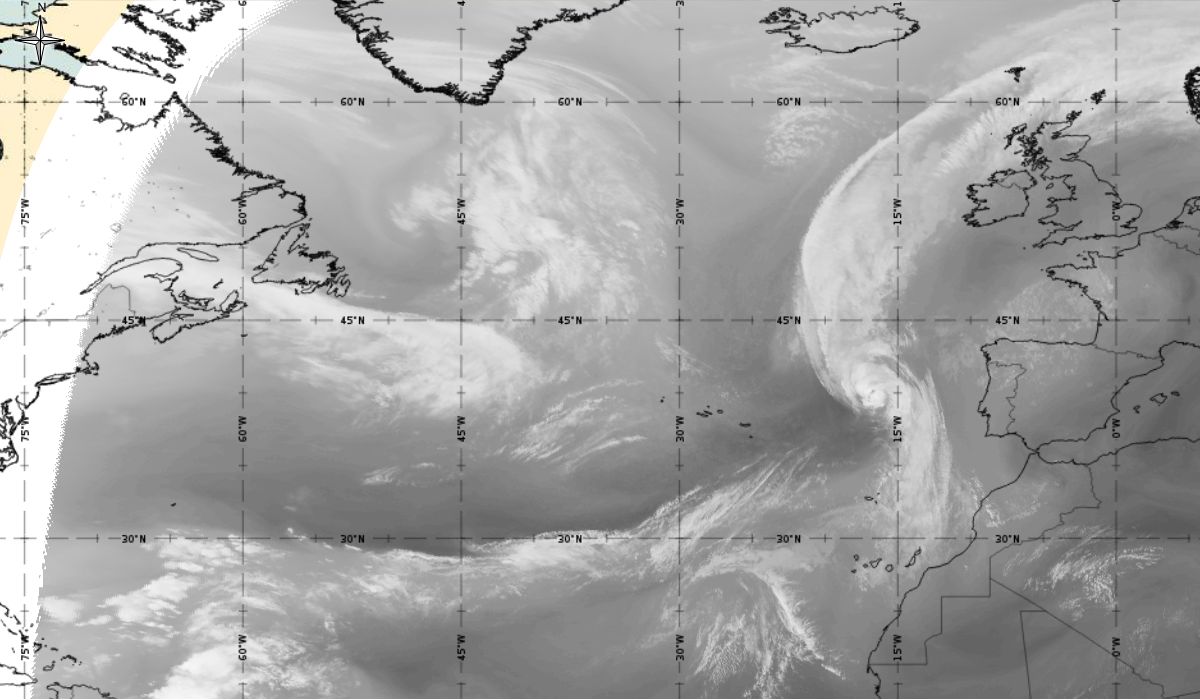
In the beginning, hurricane Ophelia is still in a relatively warm environment, however in the last phase of the transition, stratospheric air at the rear side of the cloud band (red colour) coincides with the upper level trough. The jet stream is clearly visible in transition from blue to red colours, like a pinstripe at the rear side of the cloud band. The jet is coming from behind/above the cold front. The moving to the northeast and development of a comma cloud took place in the left exit region of a jet.
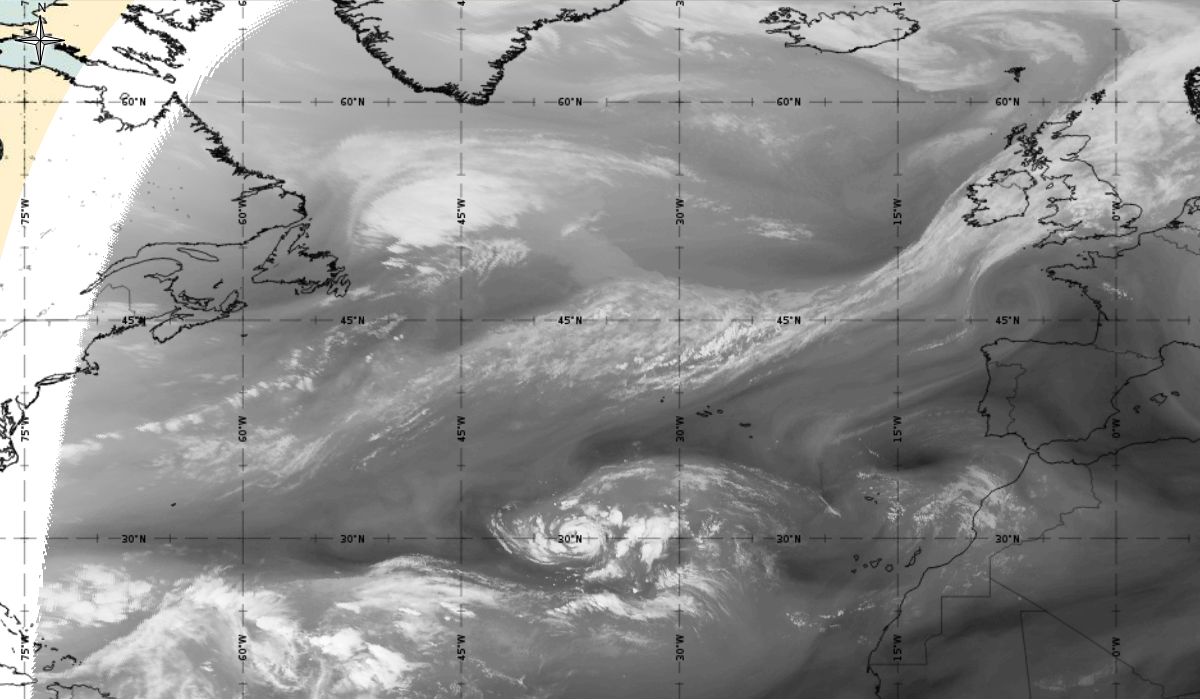
Loop 9: Meteosat 10 WV 7.3 animation from 15th October 2017, 06:00 UTC to 16th October 2017, 06:00 UTC (source: EUMeTrain, ePort)
Note: To go through individual images, click Loop 9
In the water vapor channel the dark area which represents dry air in the upper levels can be seen behind the cloud structure. At the same time, the development of the comma structure in the cold air behind the front can be followed.
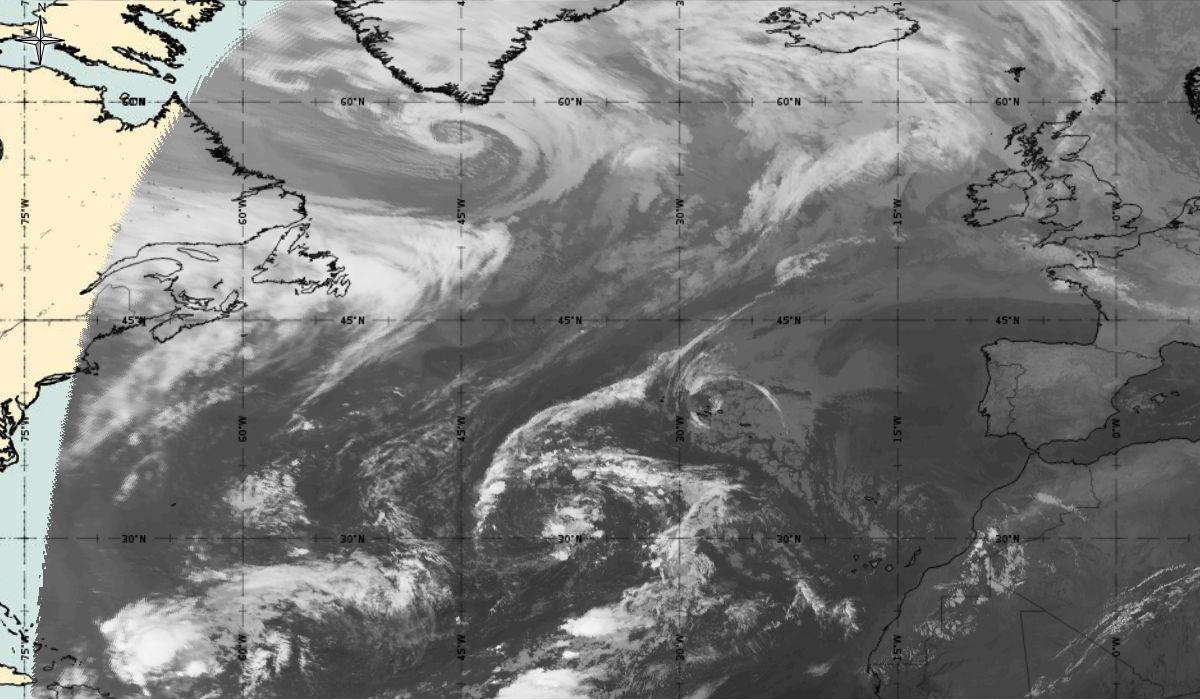
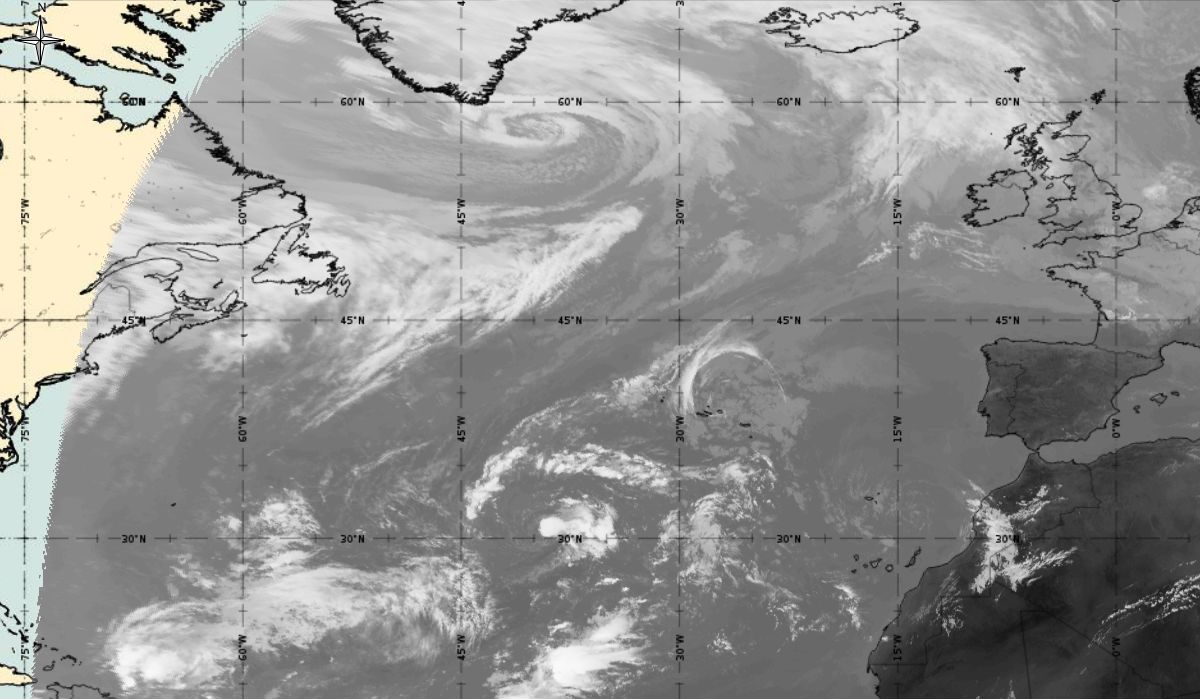
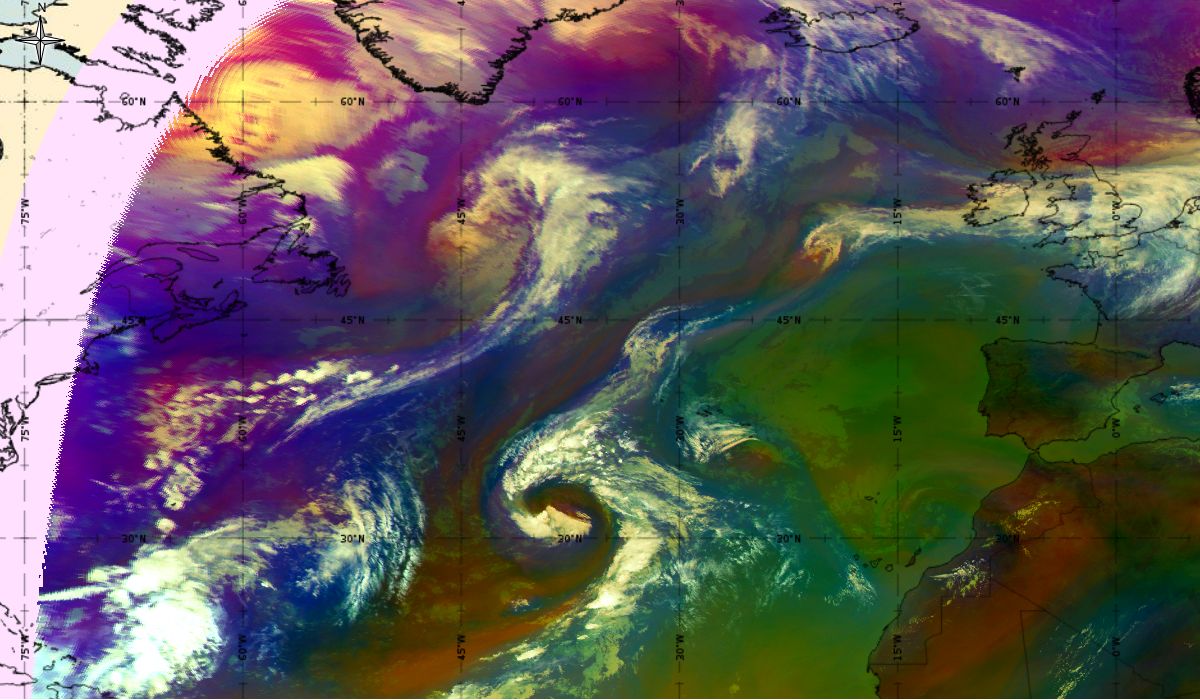
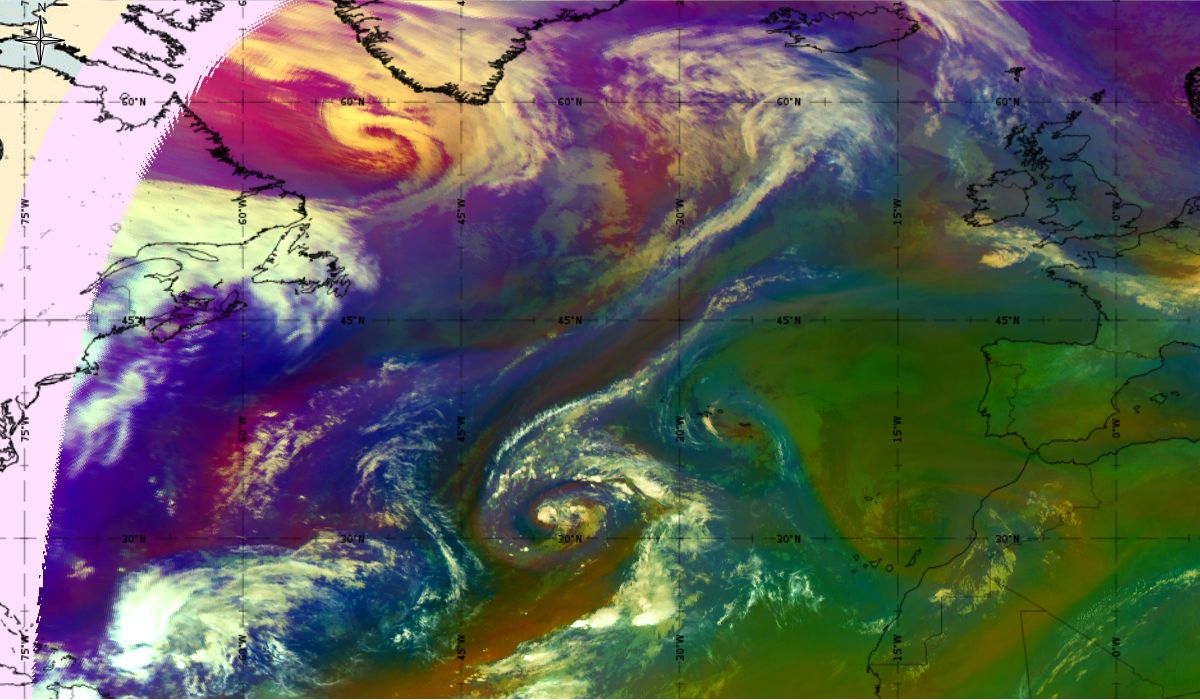
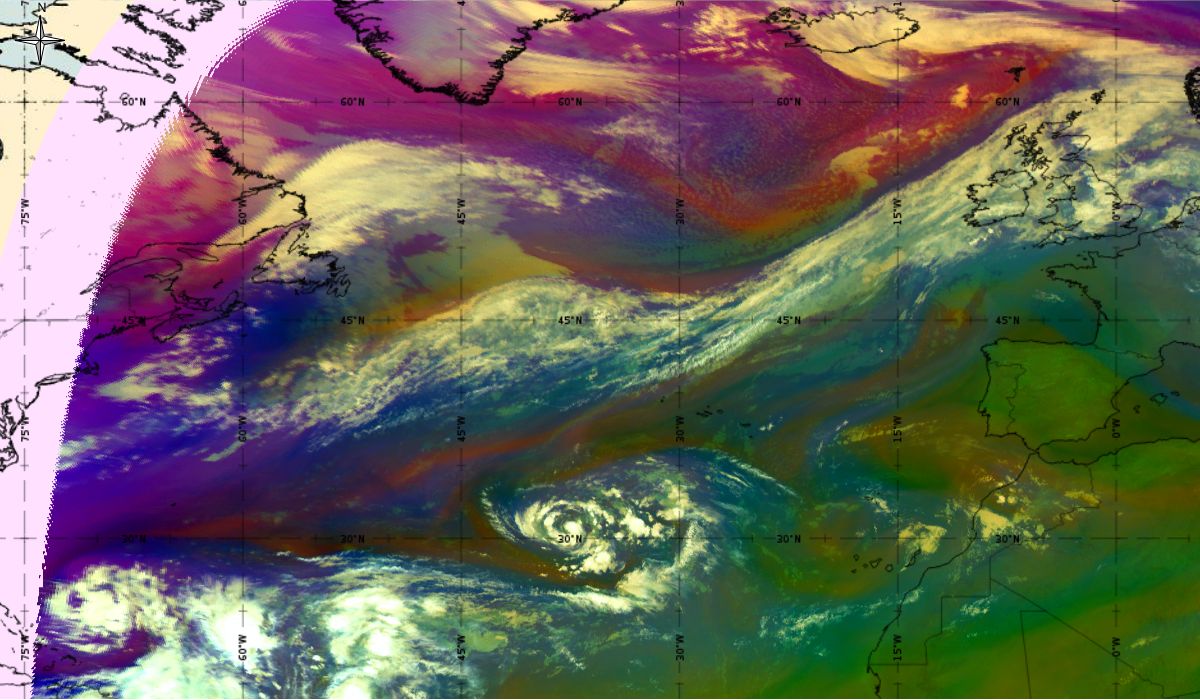
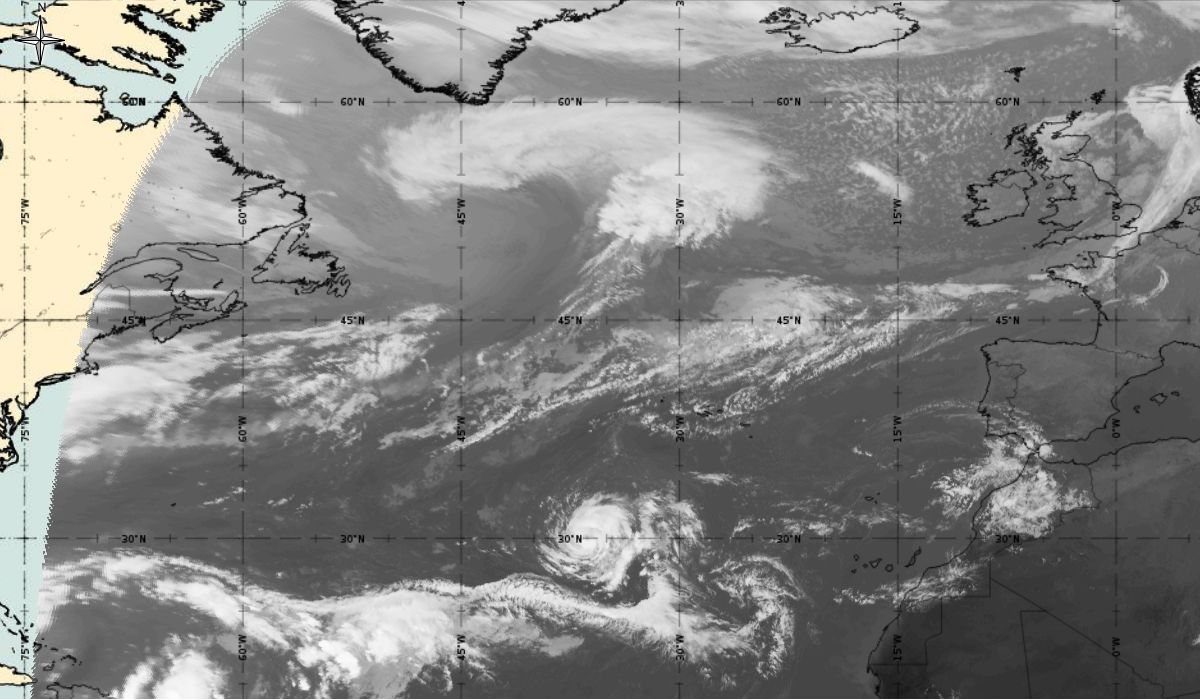
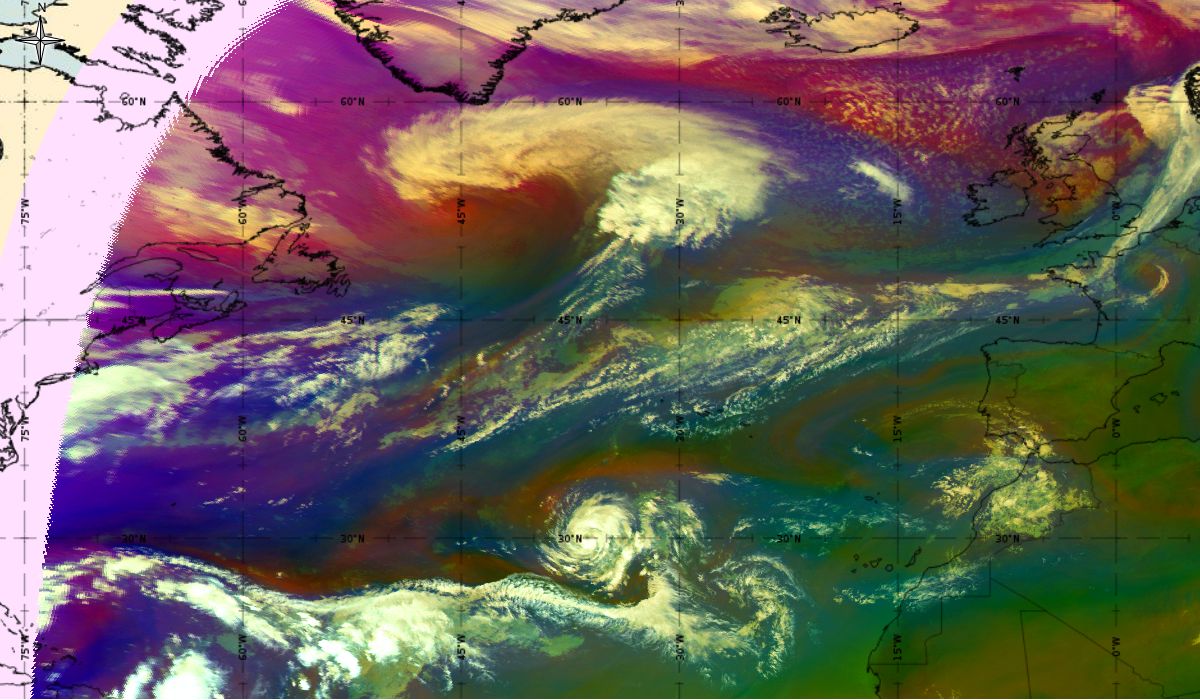
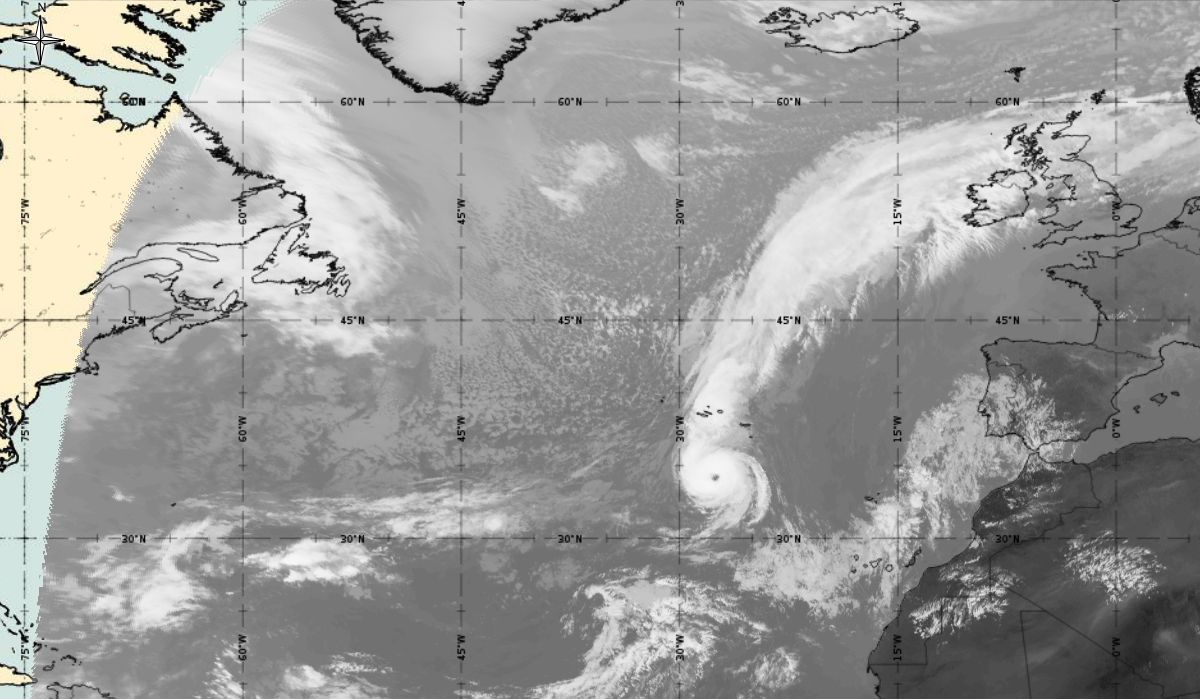
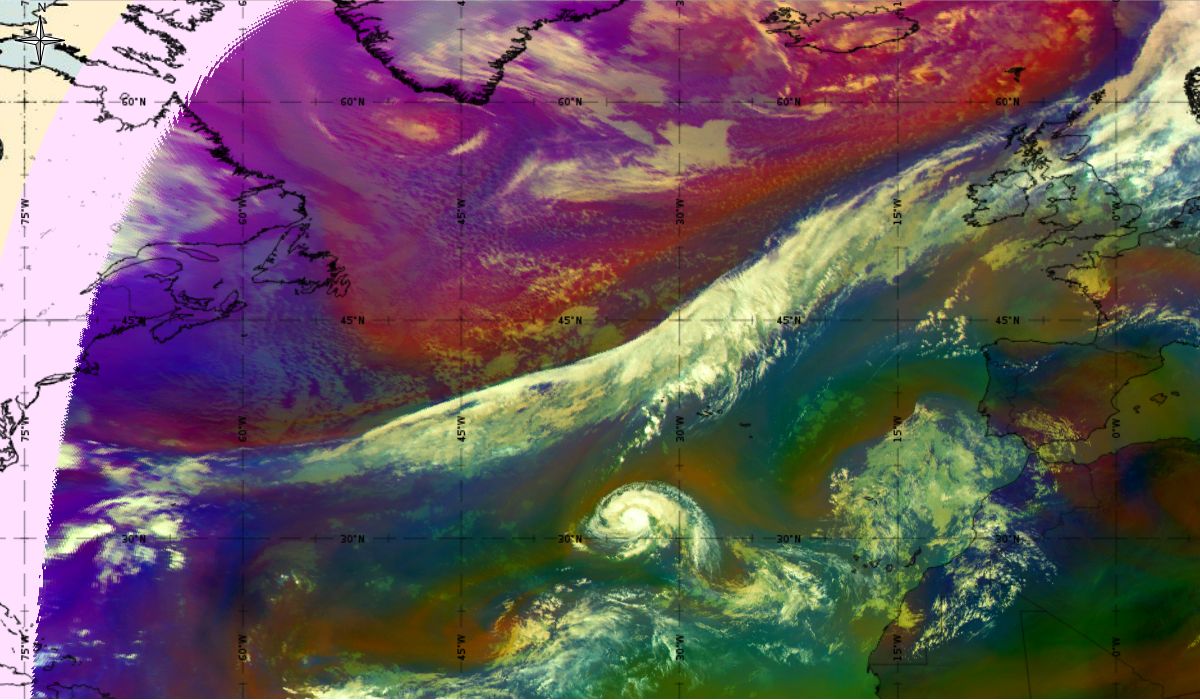
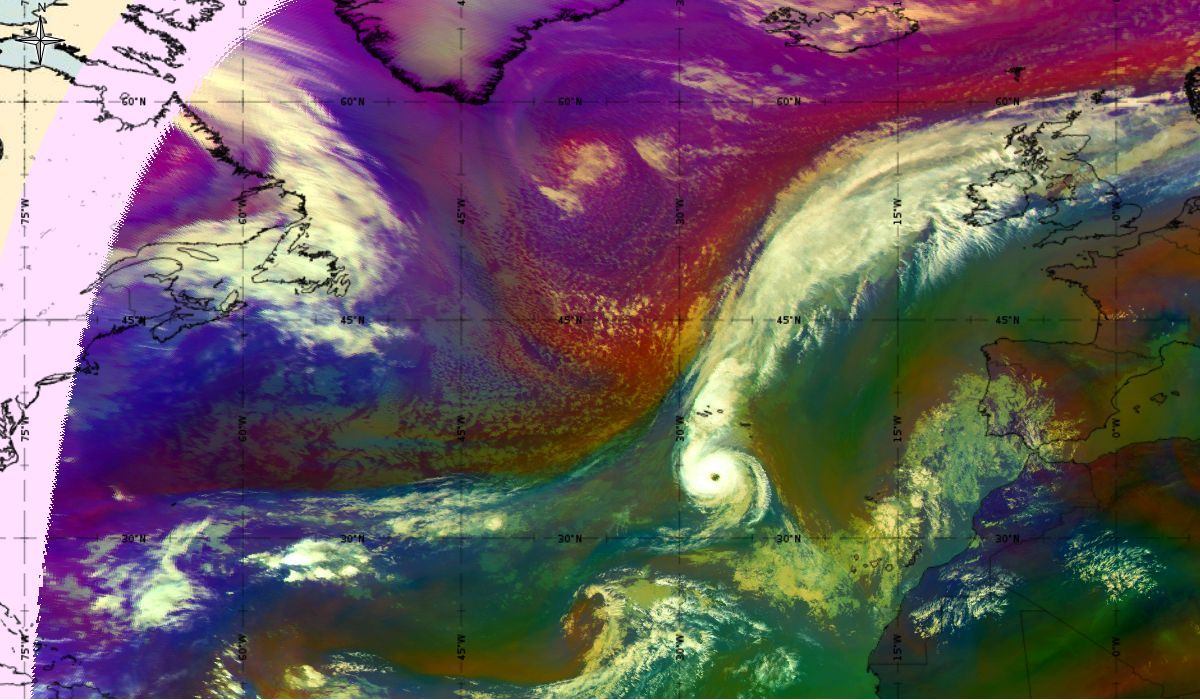
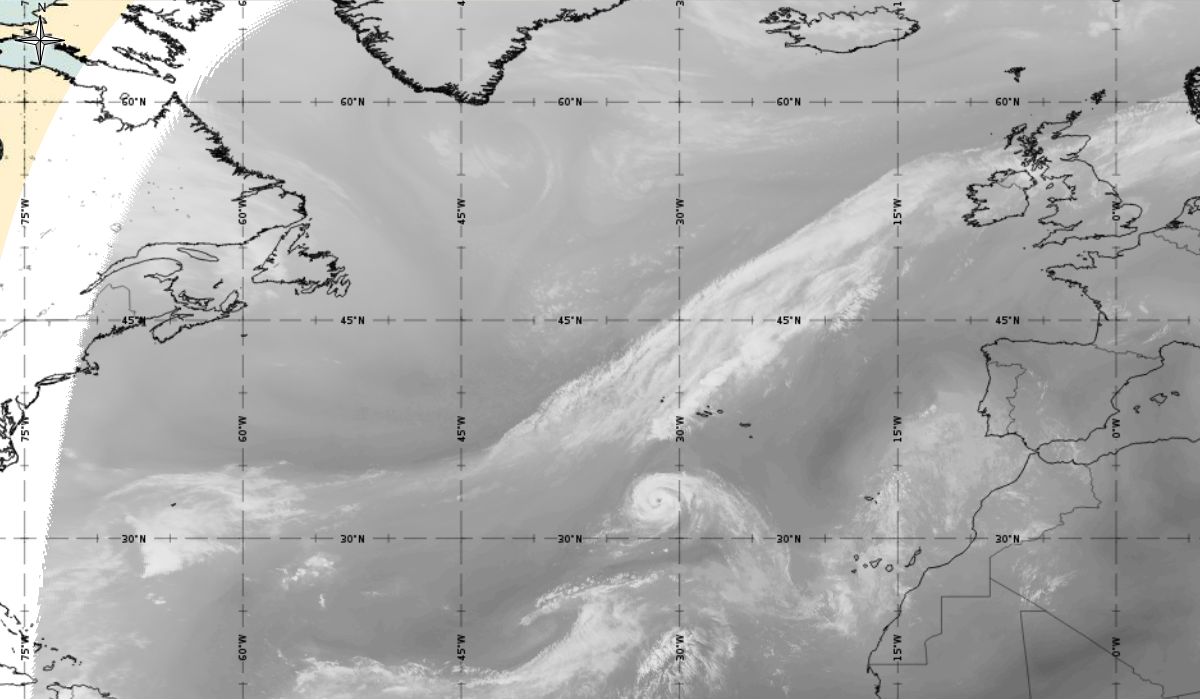
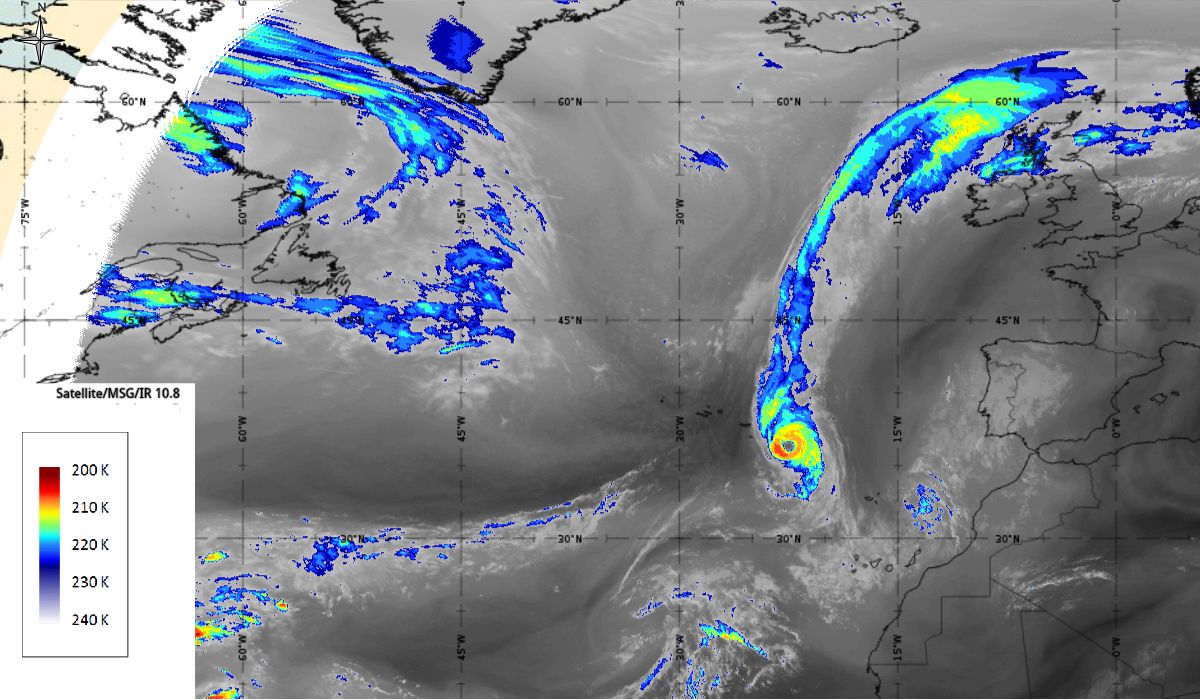
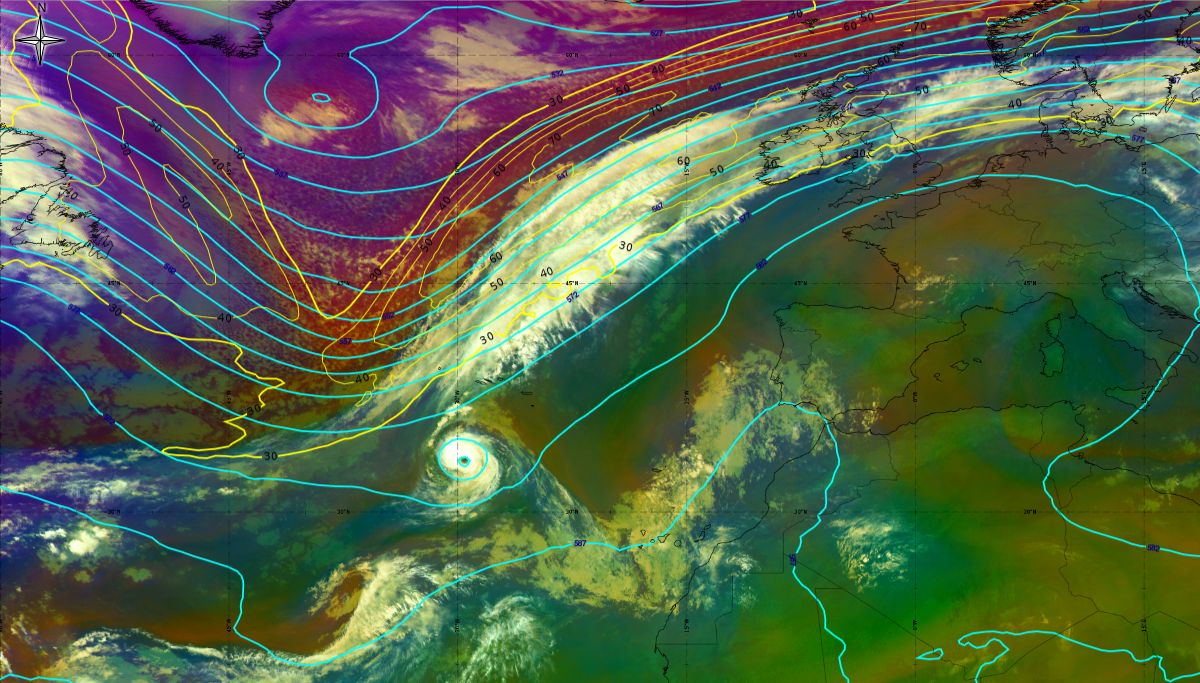
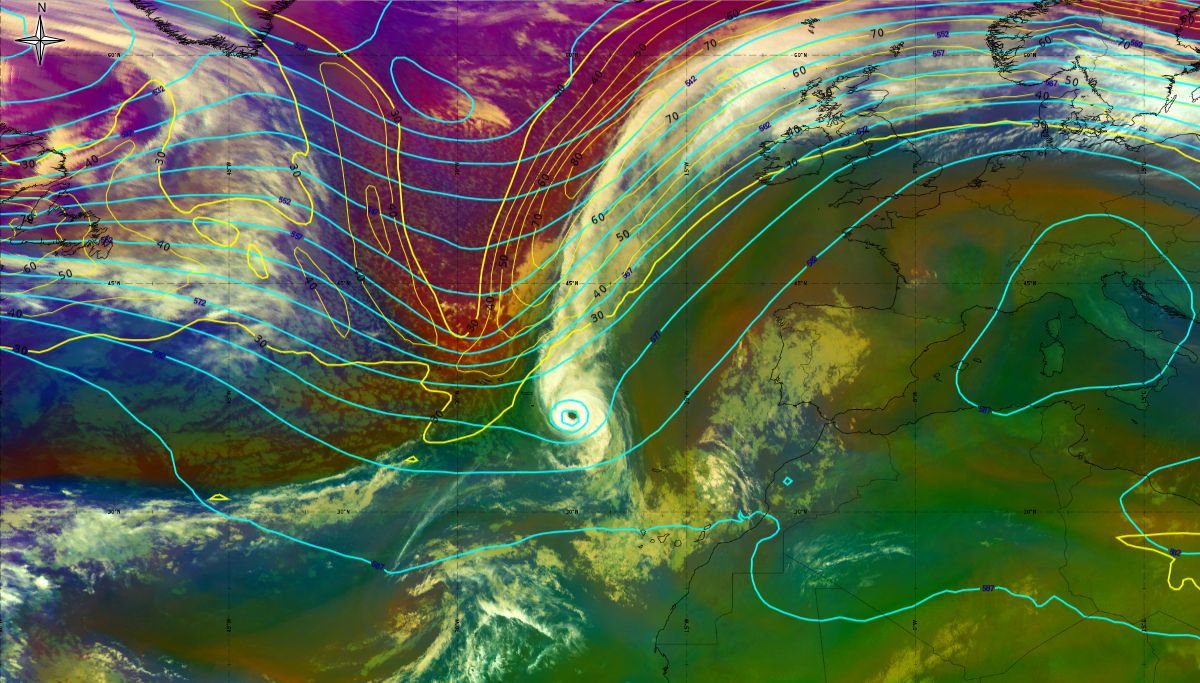
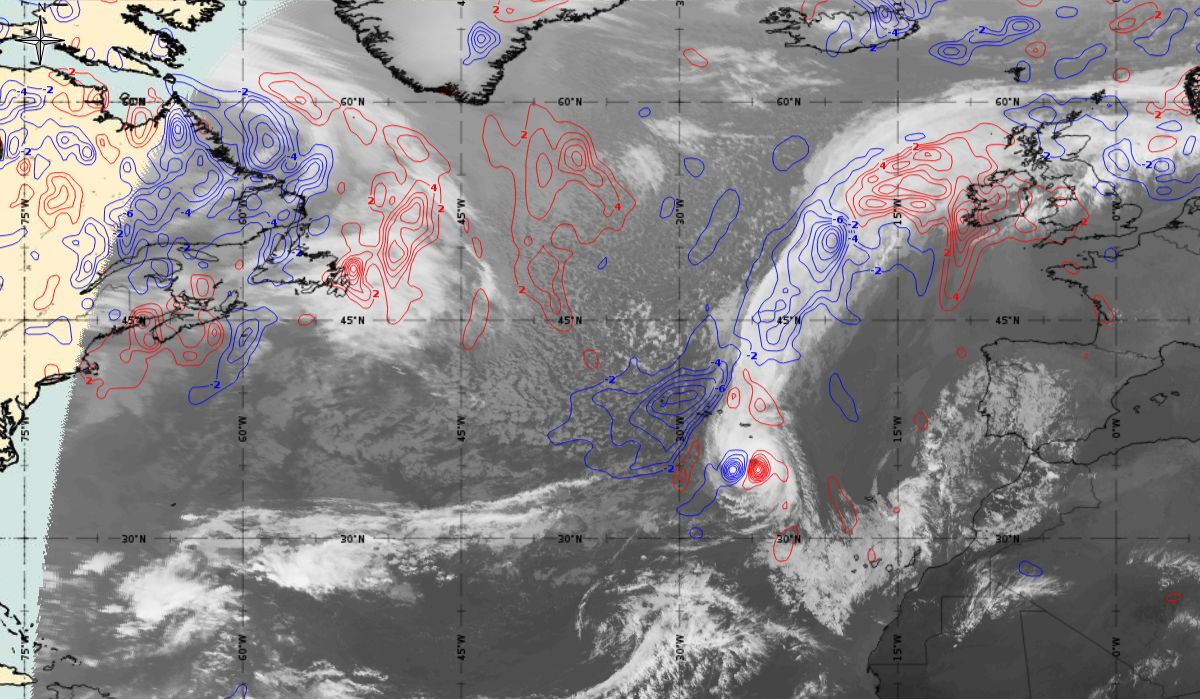
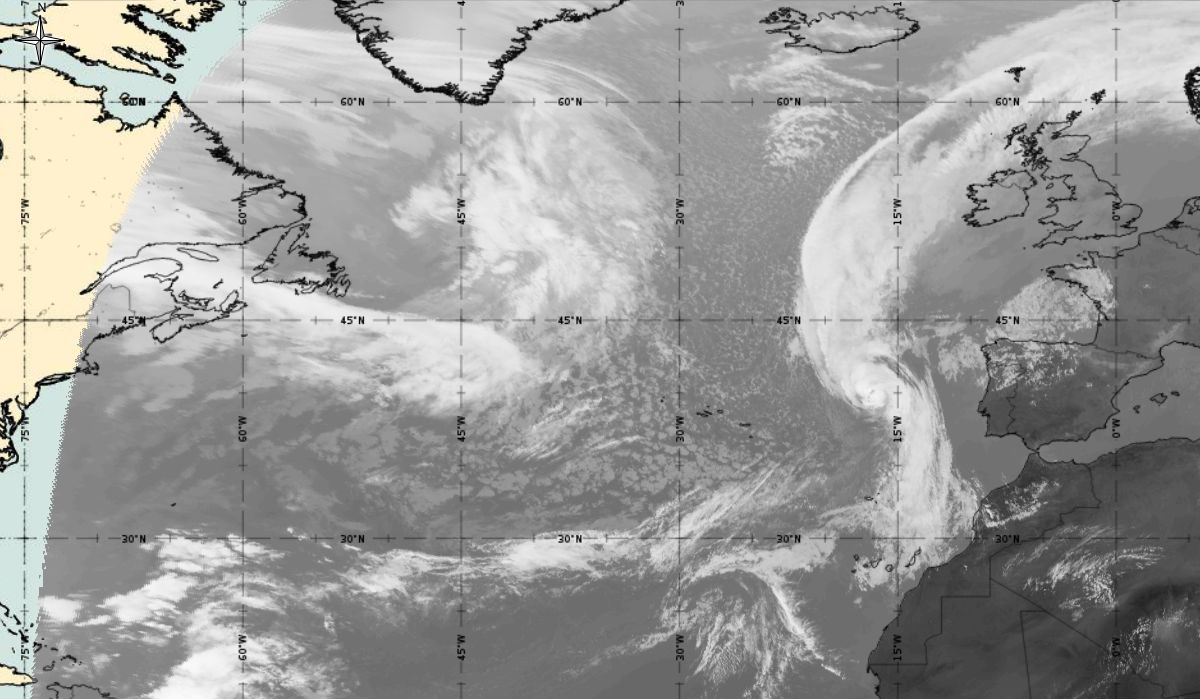
On 15th October 00:00 UTC Ophelia moved north eastward over SST less than 23 °C, which induced a steady weakening trend. It became well embedded within the fast flow of another large mid-latitude trough moving eastwards over the Atlantic. An interaction with the strong upper-level trough and jet stream flow caused the hurricane to begin losing its tropical characteristics and become an extratropical cyclone. It can be seen by comma cloud appearance in the satellite image (Figure 22) - a classical shape of an extratropical cyclone. The comma is located at the left exit of one of the brunches of the jet streak. The cold and dry stratospheric air (red colour) is located on the west and south side of the cyclone, while warm, moist air (greenish colour) is located behind the frontal cloud cover.
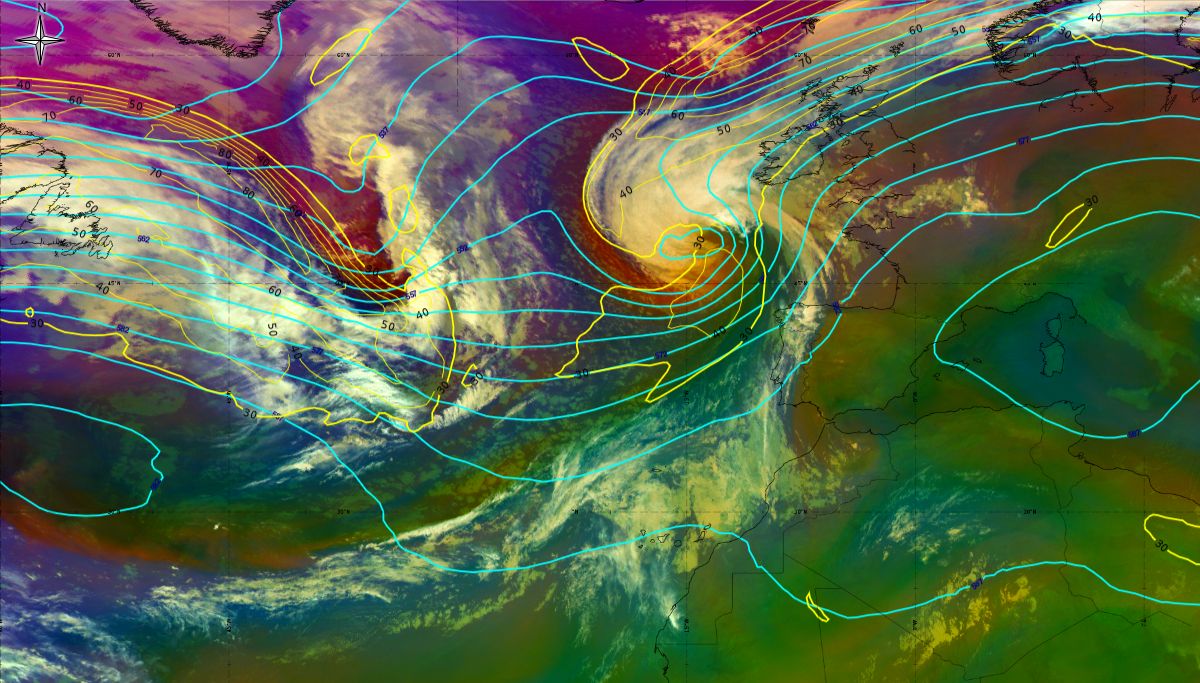
Figure 22: 16th October 2017 00:00 UTC - MSG Airmass RGB, geopotential height at 500 hPa (blue line), isotach at 300 hPa (yellow line - both ECMWF), source: EUMeTrain, ePort.
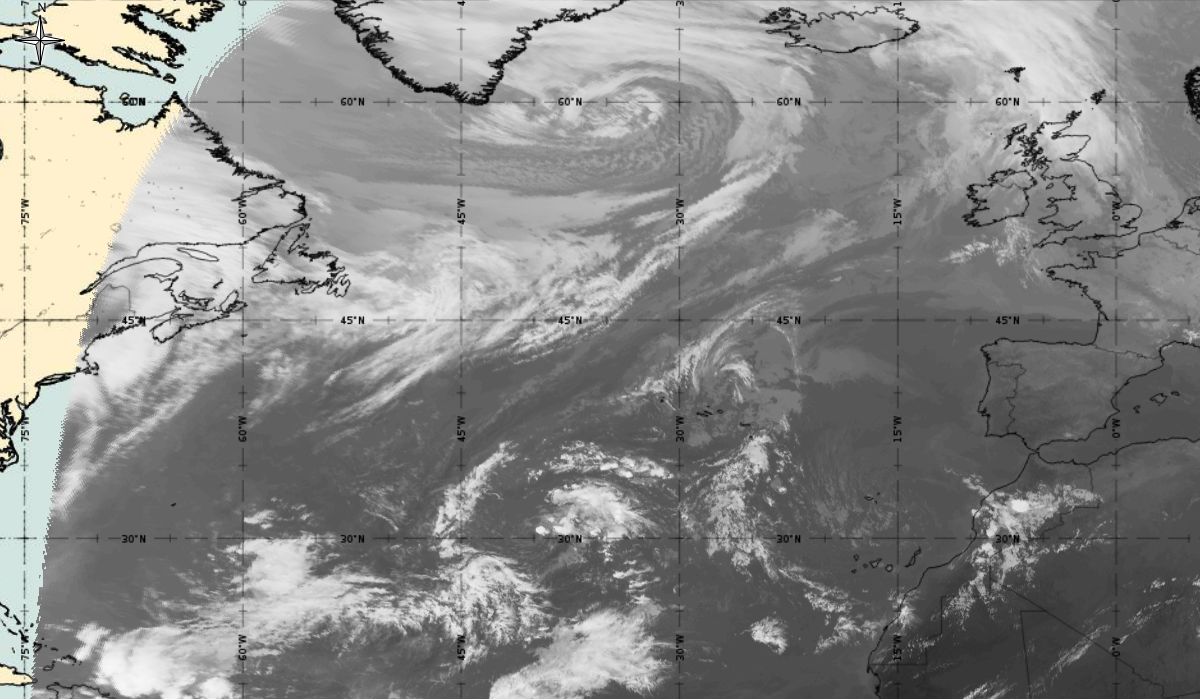
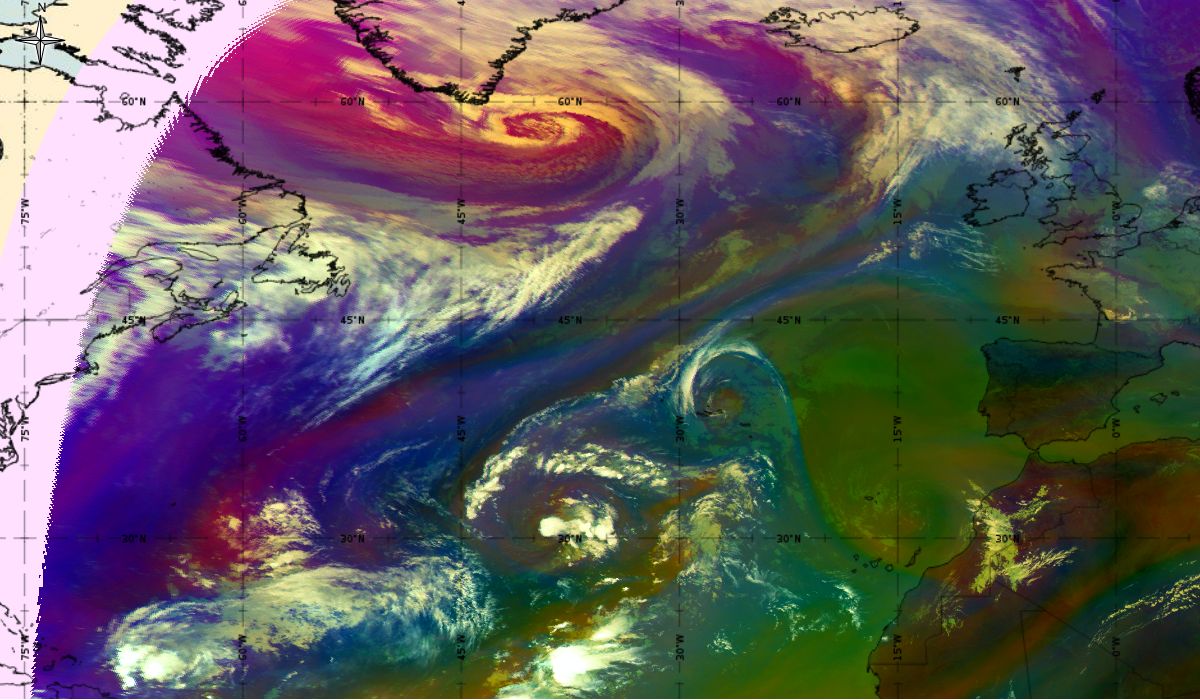
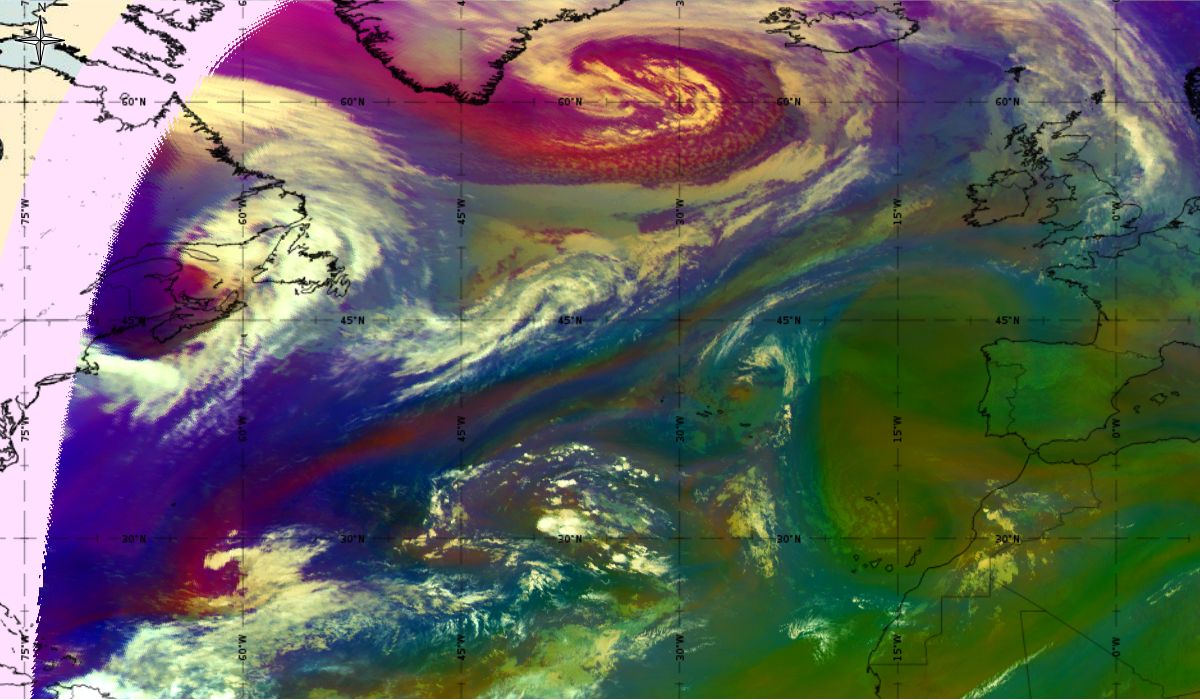
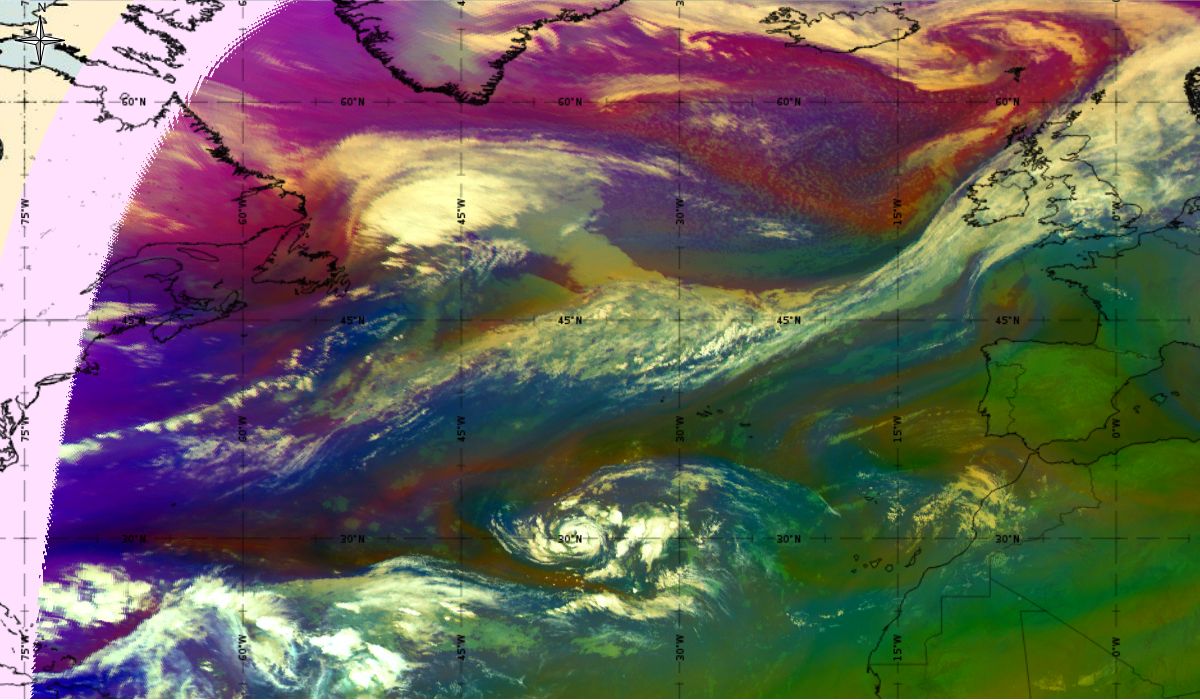
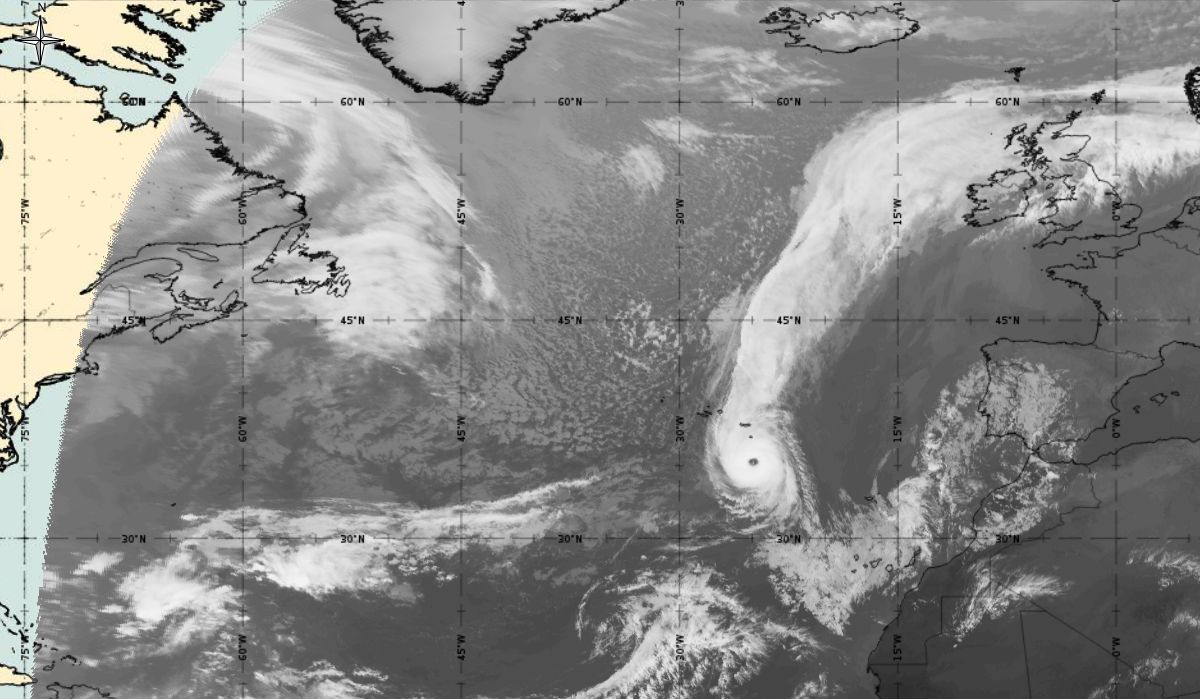
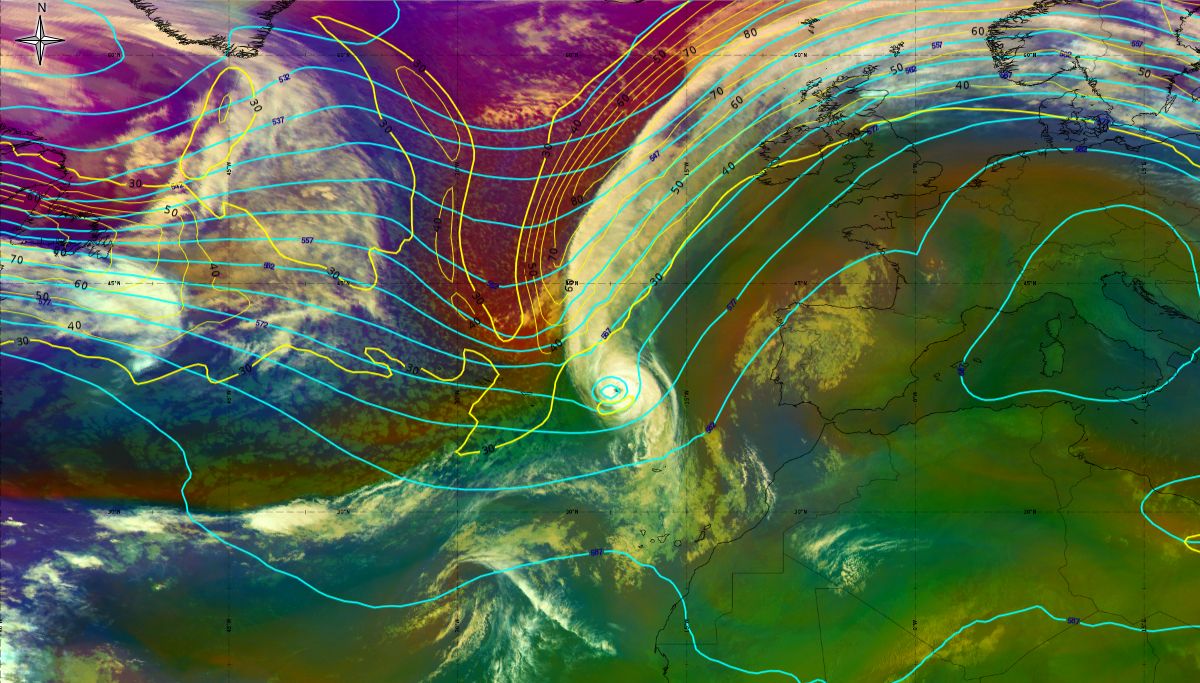
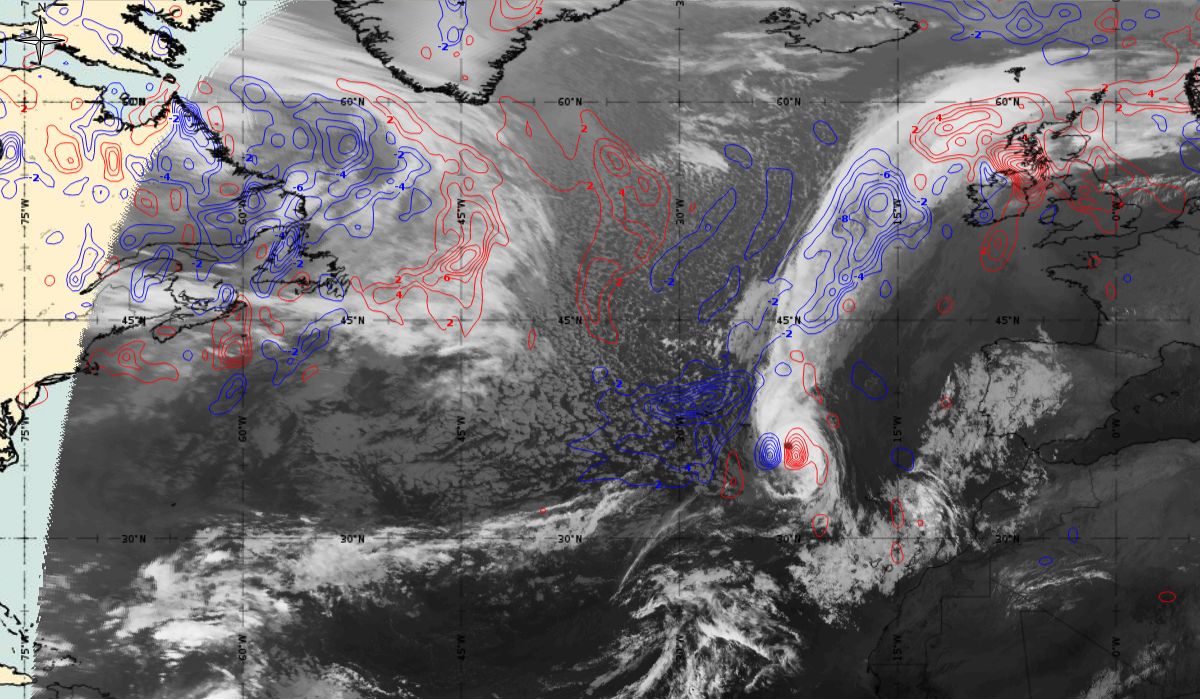
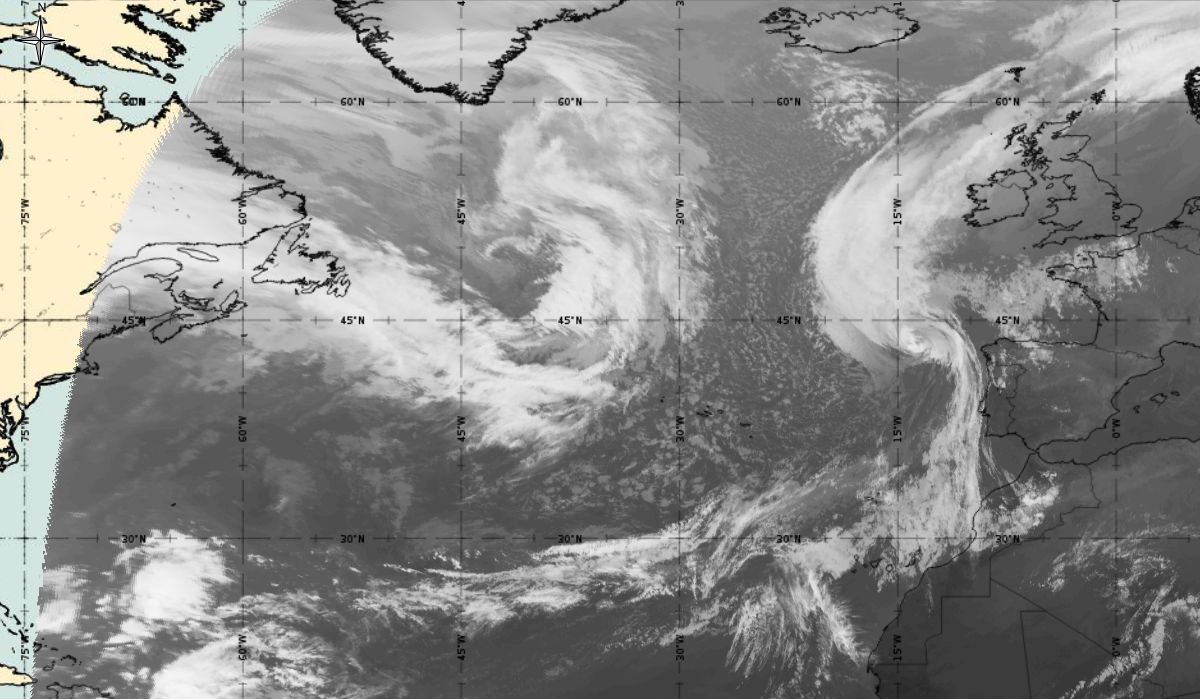
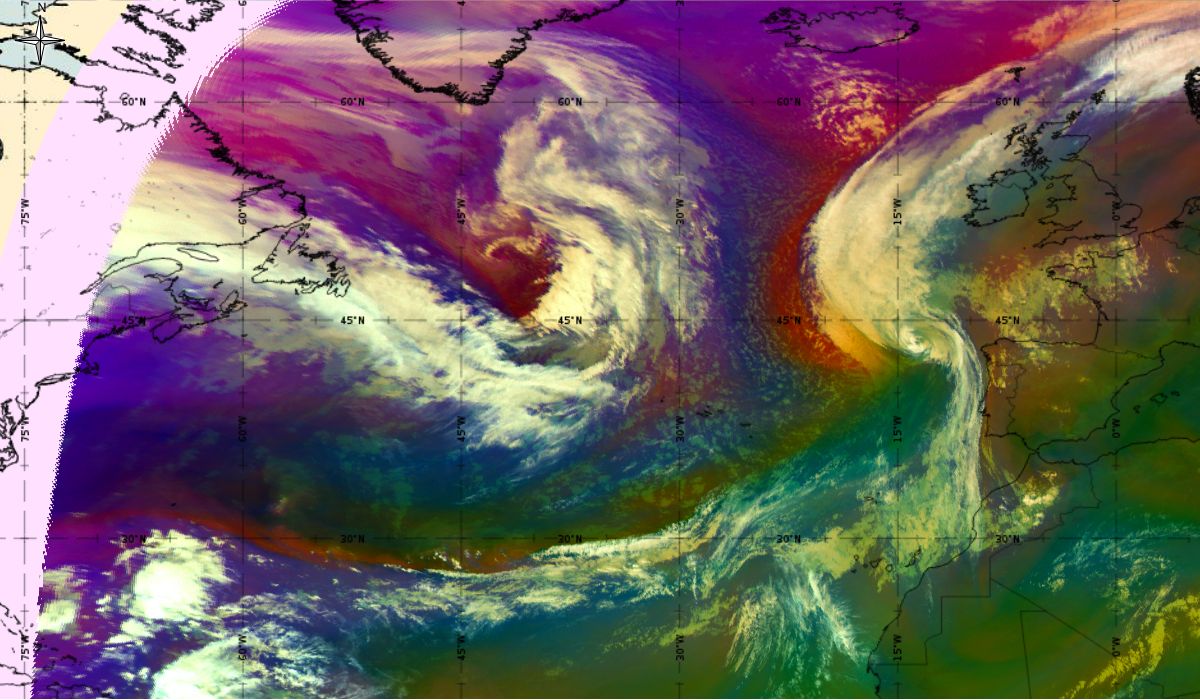
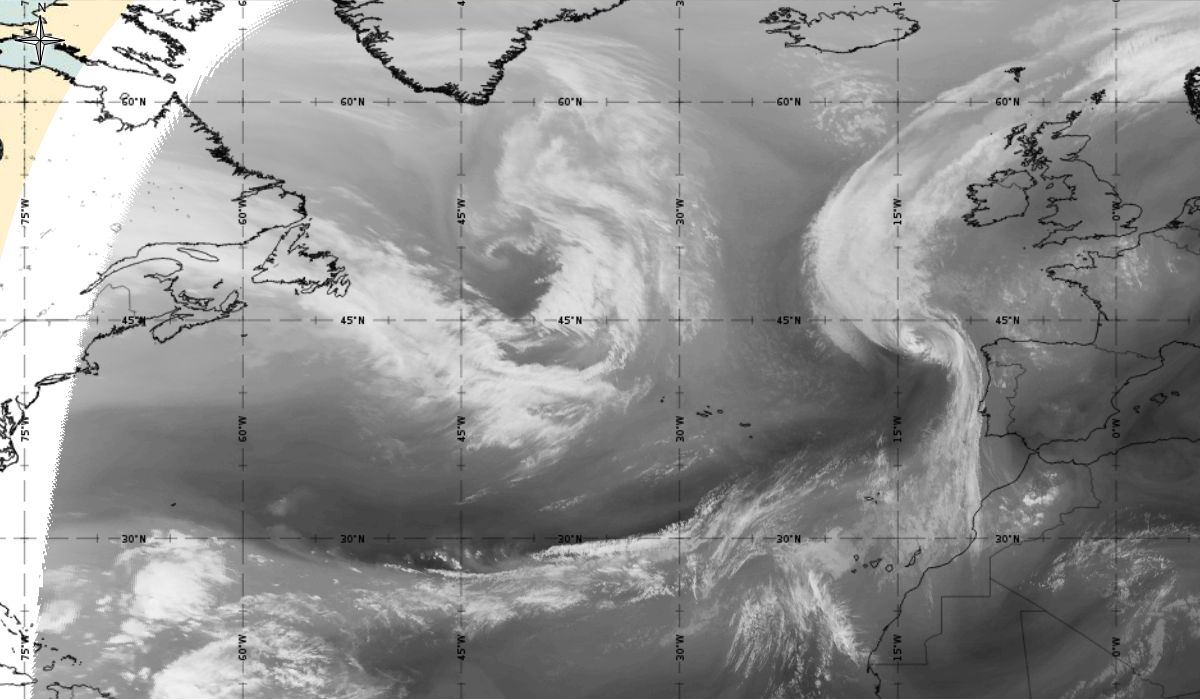
Extratropical cyclone Ophelia approached Ireland, traveling ahead in a strong, south-westerly flow at the front side of the upper level trough, it merged with the cold front. It made landfall along the southwestern coast of Ireland at around 11:00 UTC on 16th October 2017 (Figure 23.1 and 23.2).
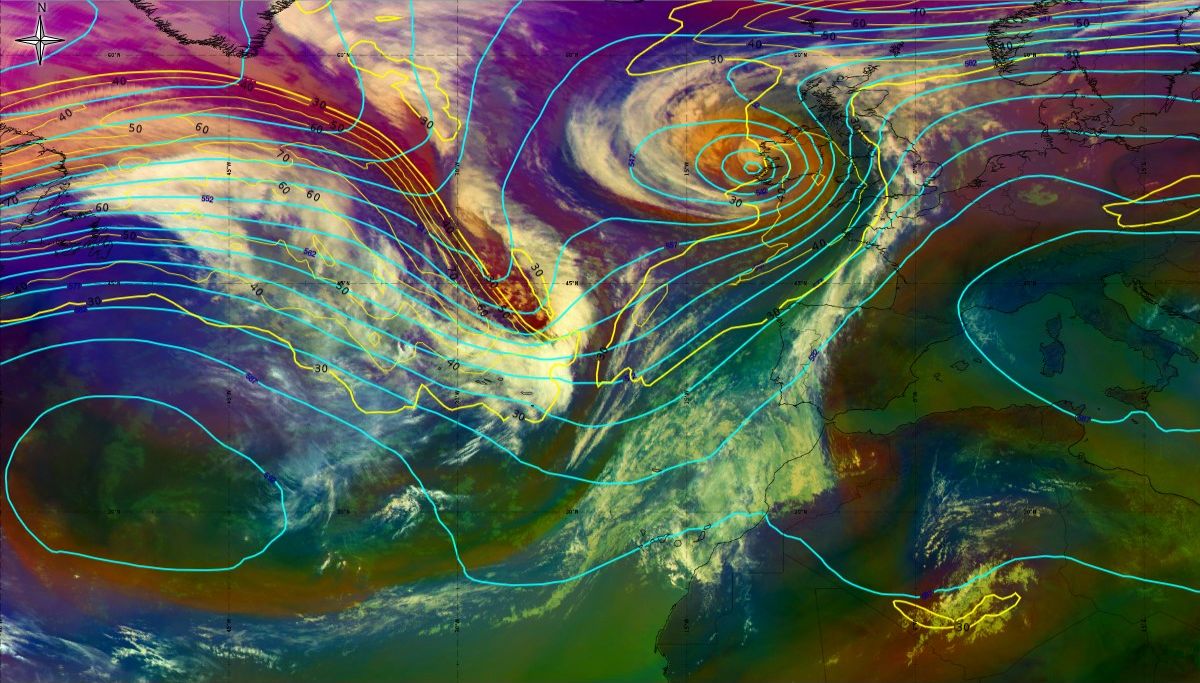
Figure 23-1: 16th October 2017 12:00 UTC - MSG Airmass RGB, geopotential height at 500 hPa (blue line), isotach at 300 hPa (yellow line - both ECMWF), source: EUMeTrain, ePort.
Figure 23-2: 16th October 2017 12:00 UTC surface analyse, source DWD
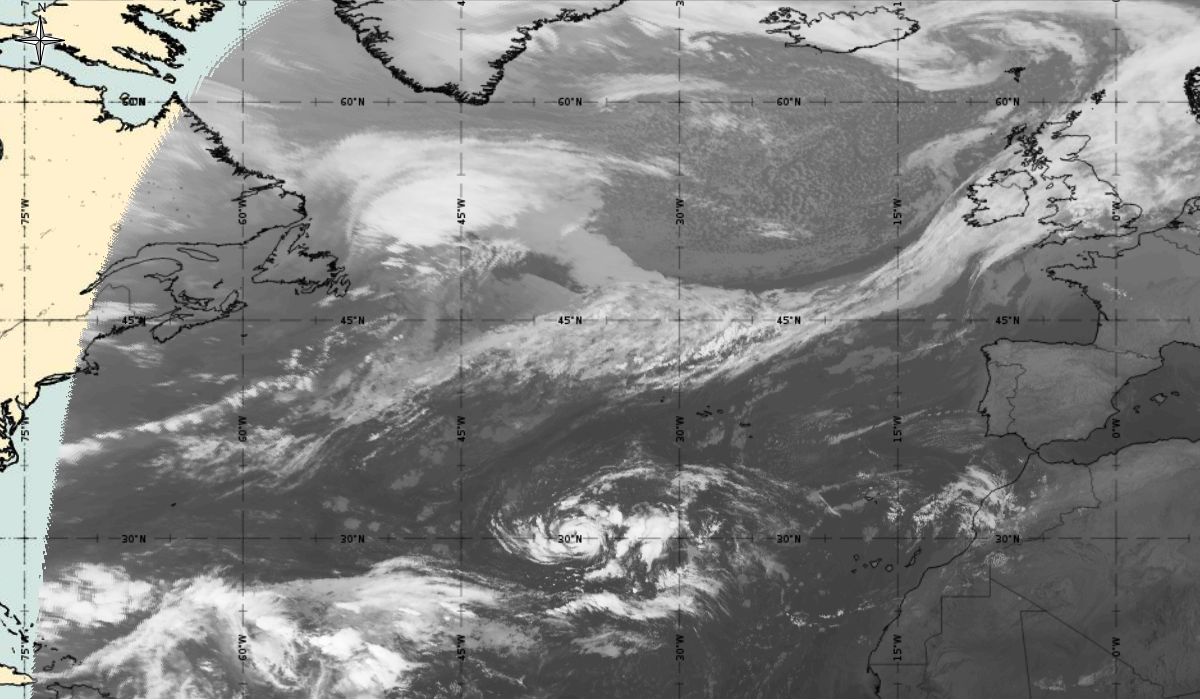
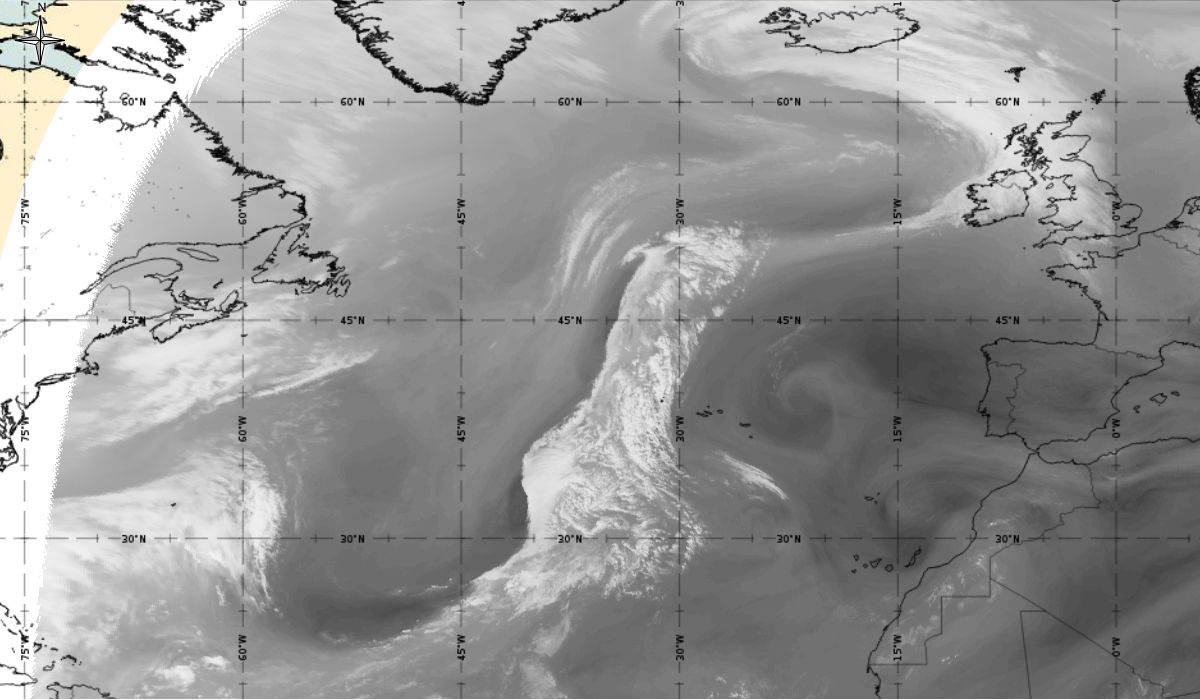
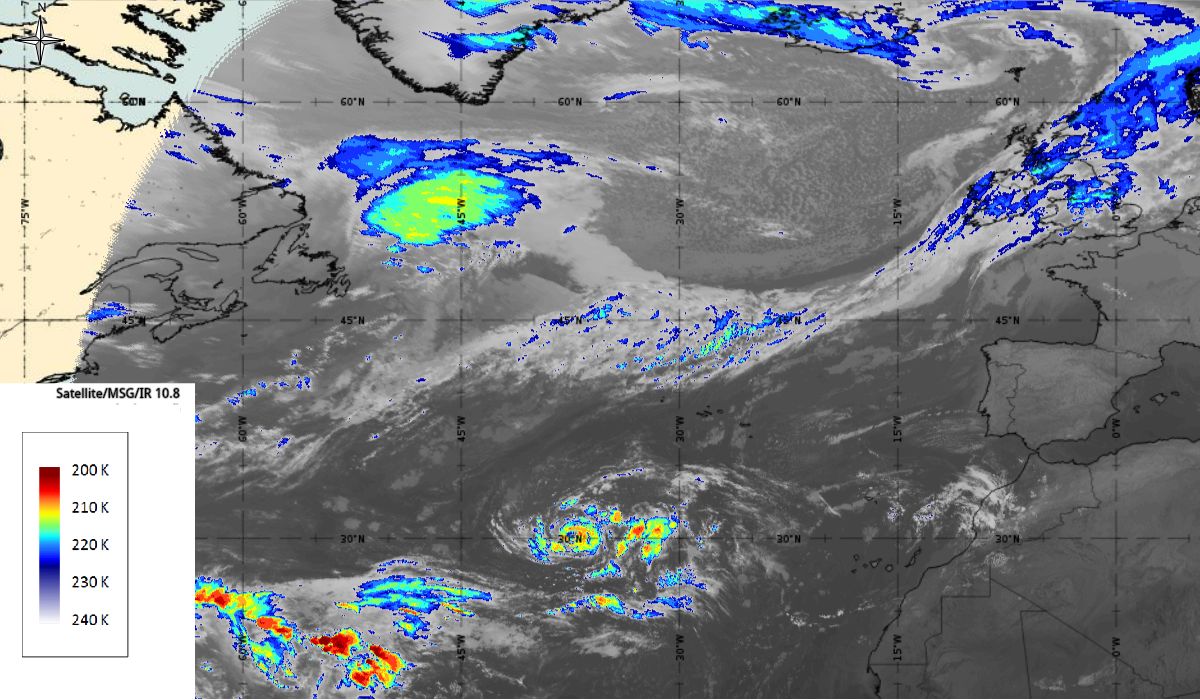
In the enhanced infrared satellite image (Figure 24) we can see that in the comma head, convective cloud intensifies with cloud top temperature around or even lower than -60°C. The comma tail still consists of lower cloud tops but shows some enlargement of the cloud band.
On the 24-hour Microphysics RGB, the comma cloud head consists of thick, high, and cold ice clouds; presented in a dark red colour. Thick, mid-level water cloud appears in a yellow/orange colour.
|
|
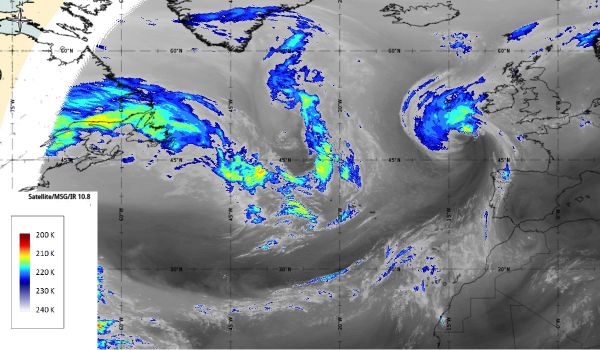
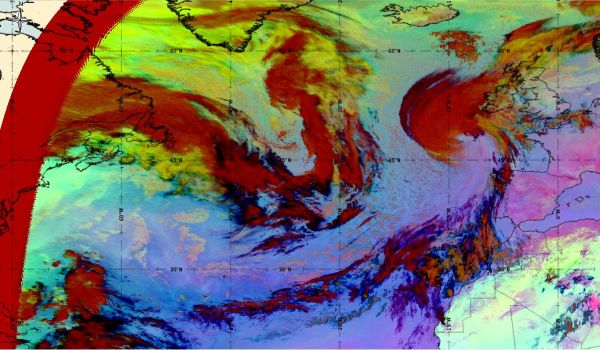
Figure 24: Meteosat 10 Enhanced IR10.8/24-hour Microphysics RGB, 16th October 2017, 00:00 UTC (source: EUMeTrain, ePort)
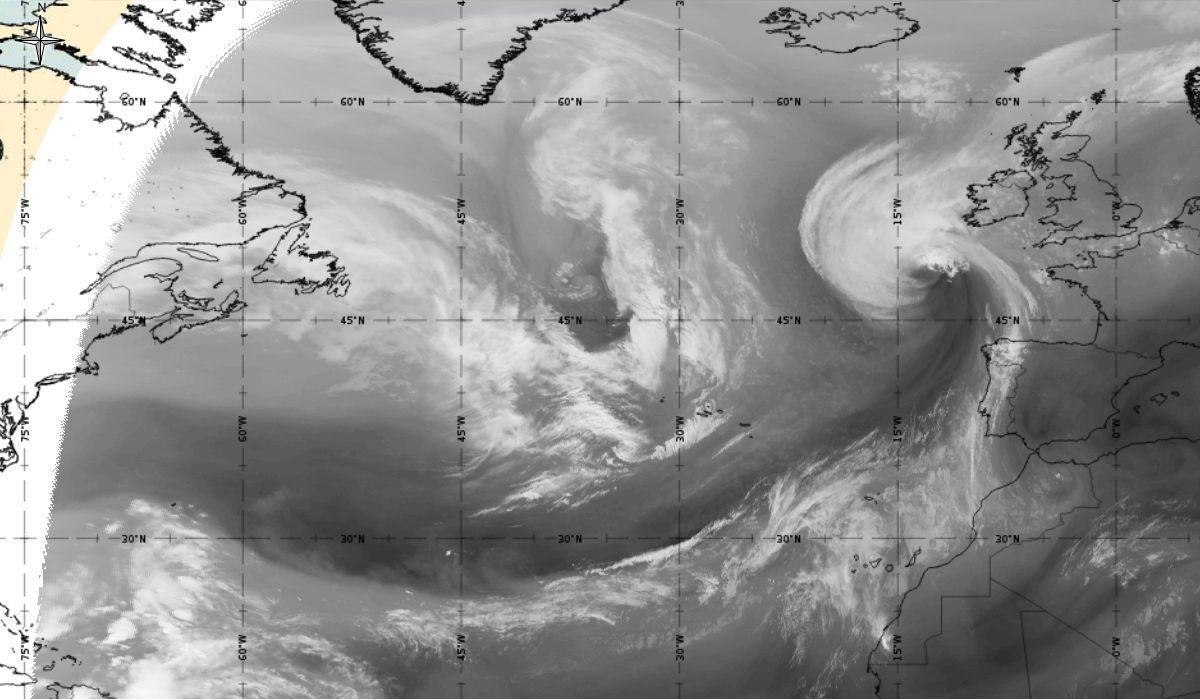
Extratropical cyclone Ophelia continued its north-eastward path across Ireland, north Scotland, and Norway, steadily weakened before dissipating by 18th October 00:00 UTC.
Temperature advection at 700 hPa (IR images)
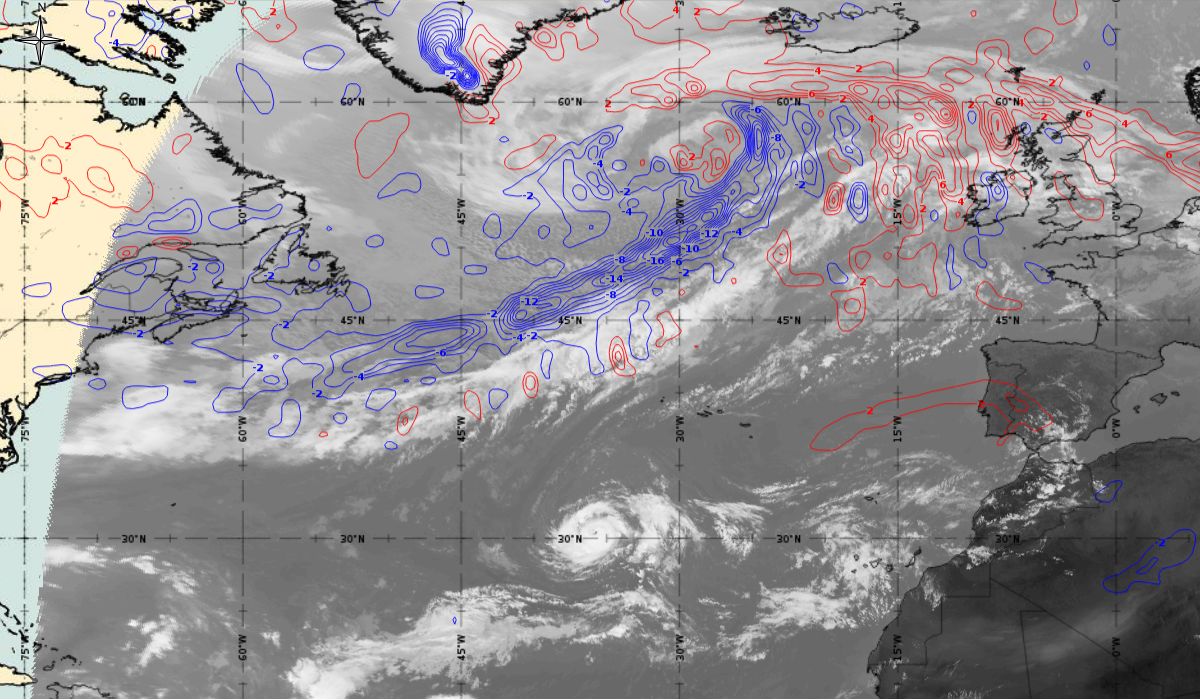
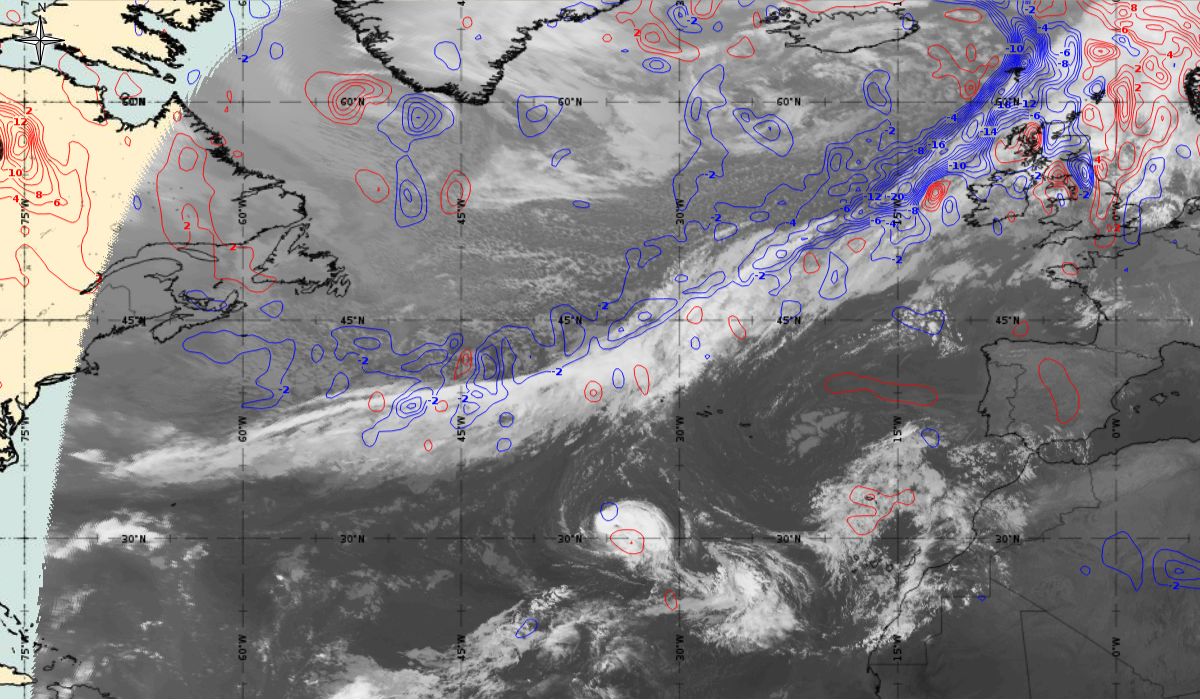
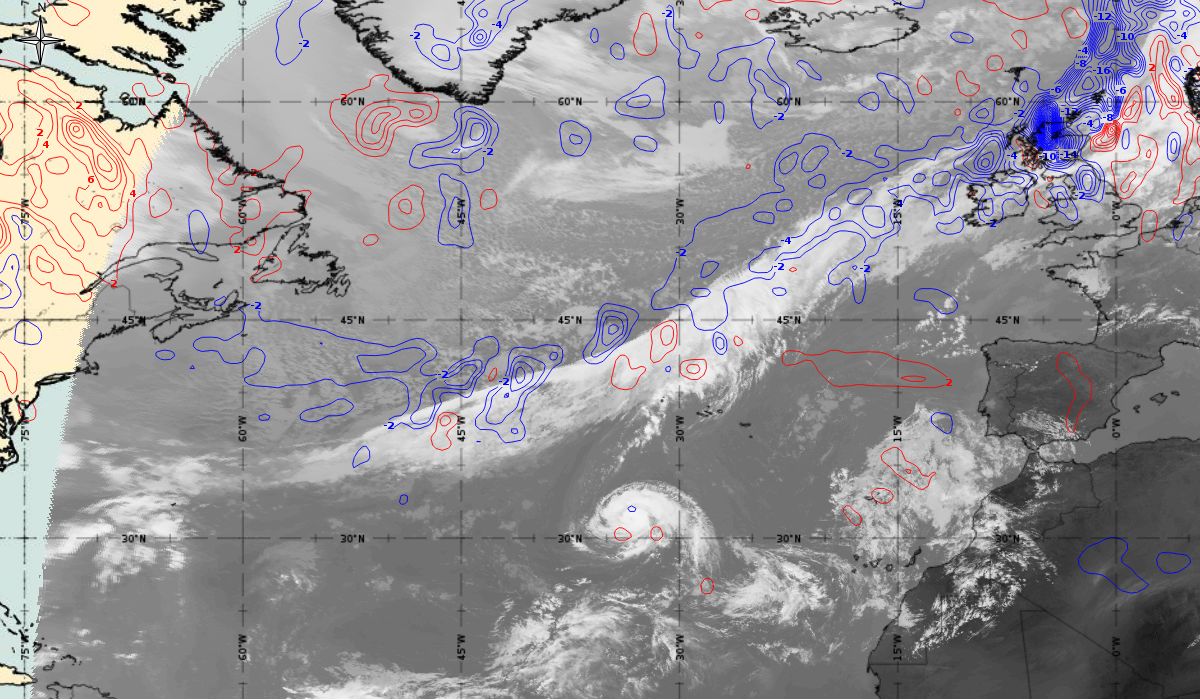
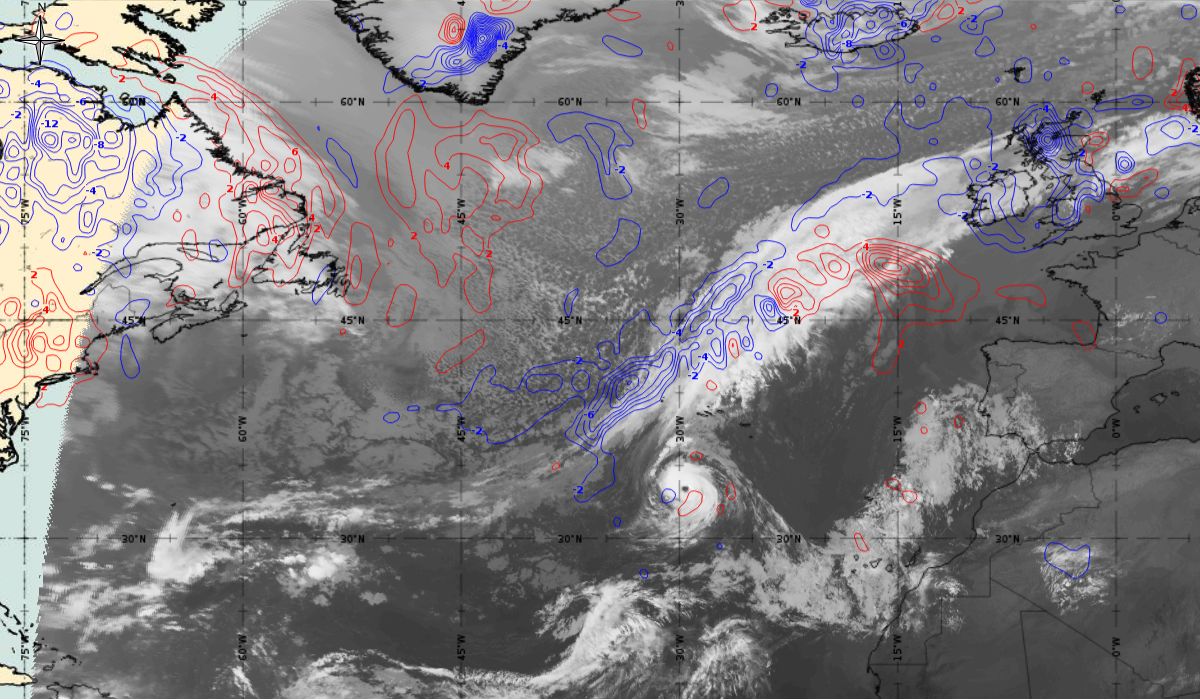
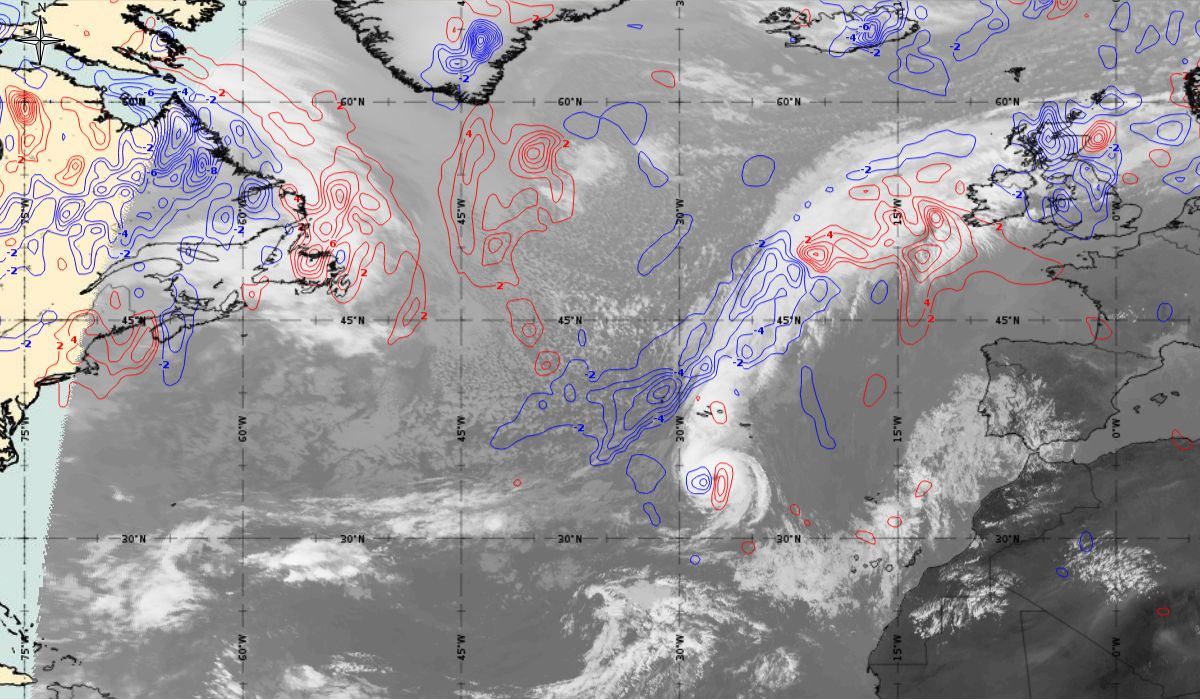
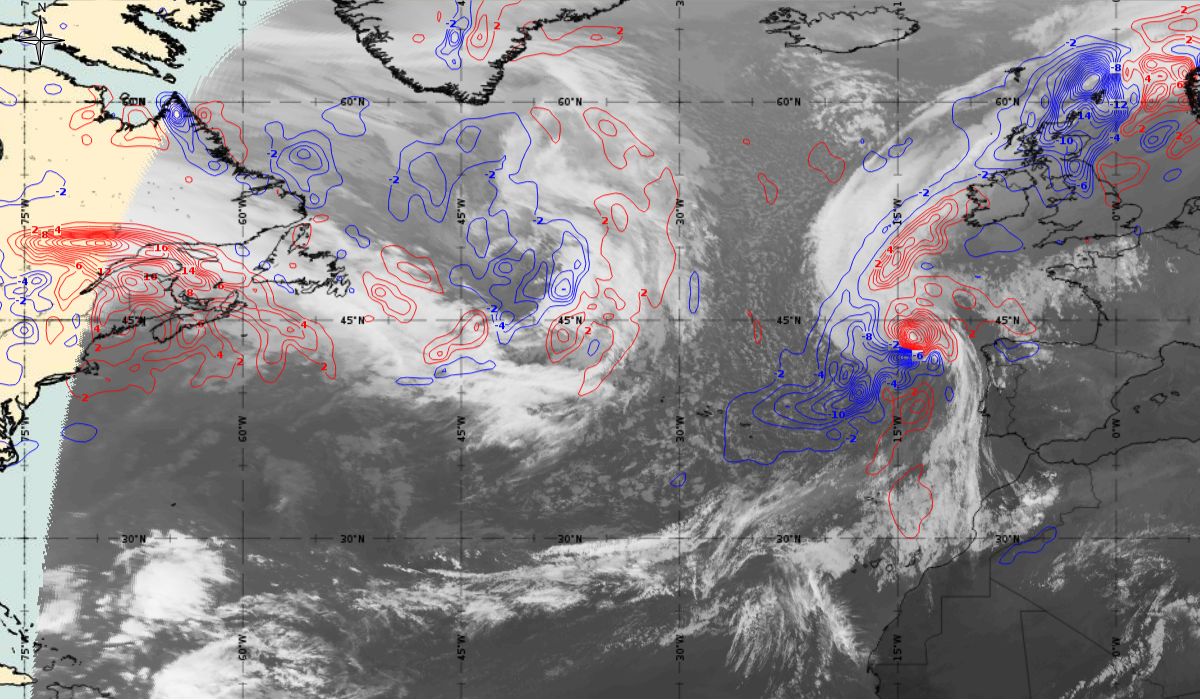
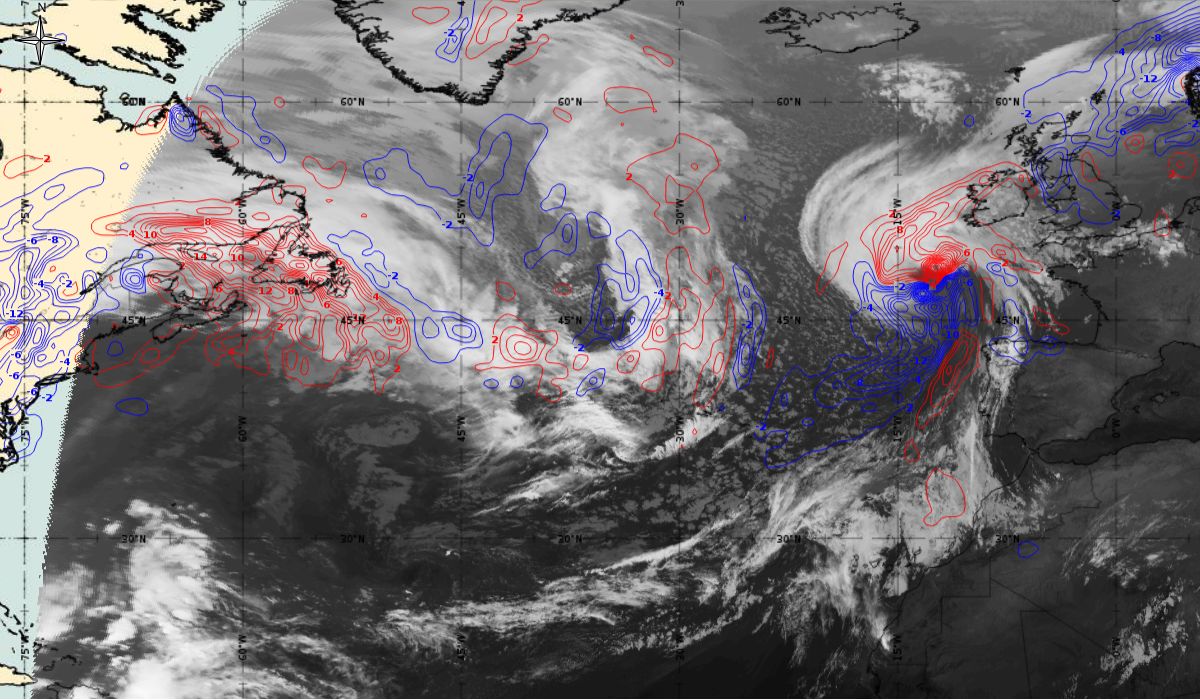
The hurricane becomes extratropical (Figure 25) with strong cold advection behind the comma cloud and warm advection over cloud head. For extratropical lows, we can say that they are former warm-core lows that have transitioned into a cold-core low.
Cold core storms derive their energy from baroclinic sources, i.e., they derive their energy from the difference of temperature in air masses.
Figure 25: Temperature advection at 700 hPa (blue lines - cold advection, red lines - warm advection), Meteosat 10 IR 10.8 from 15th October 2017, 06:00 UTC to 16th October 2017, 06:00 UTC (source: EUMeTrain, ePort)
Note: Click on the image to go through the gallery
Height of PV=1,5; WV images
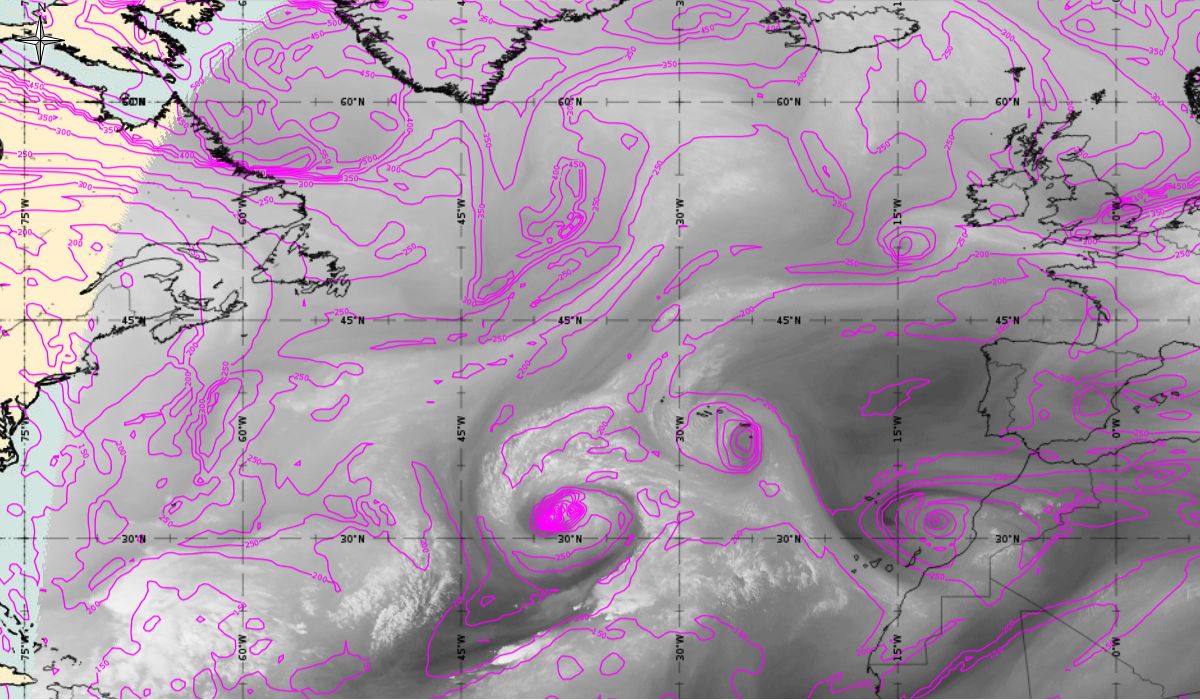
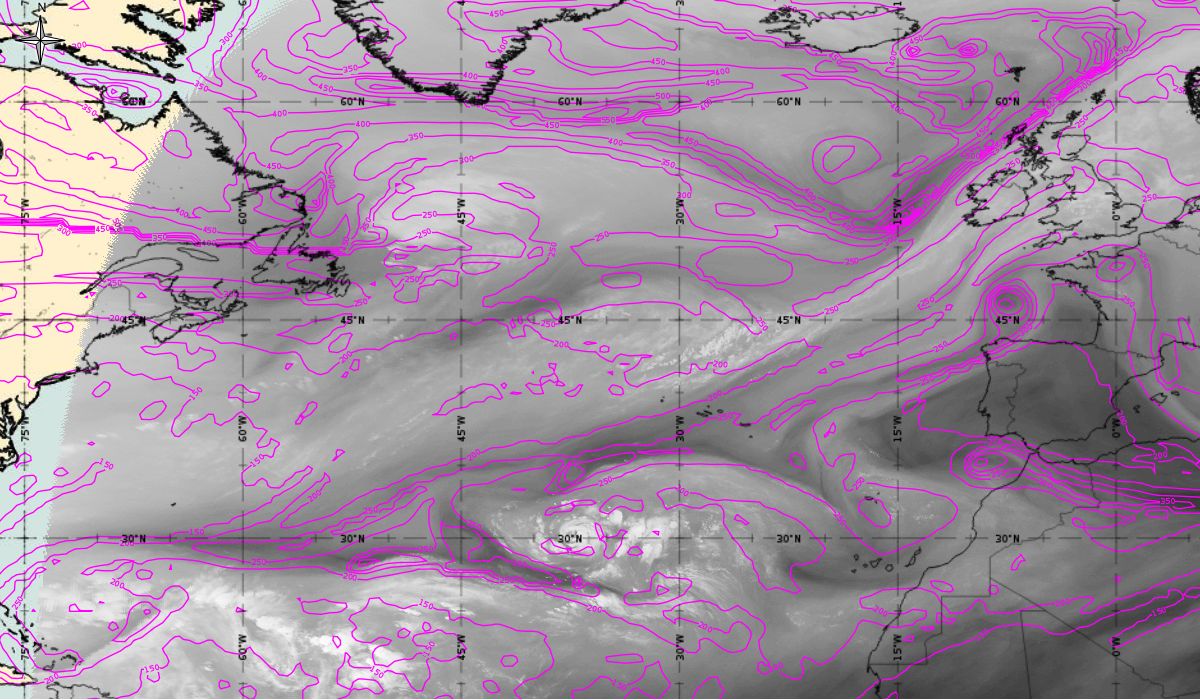
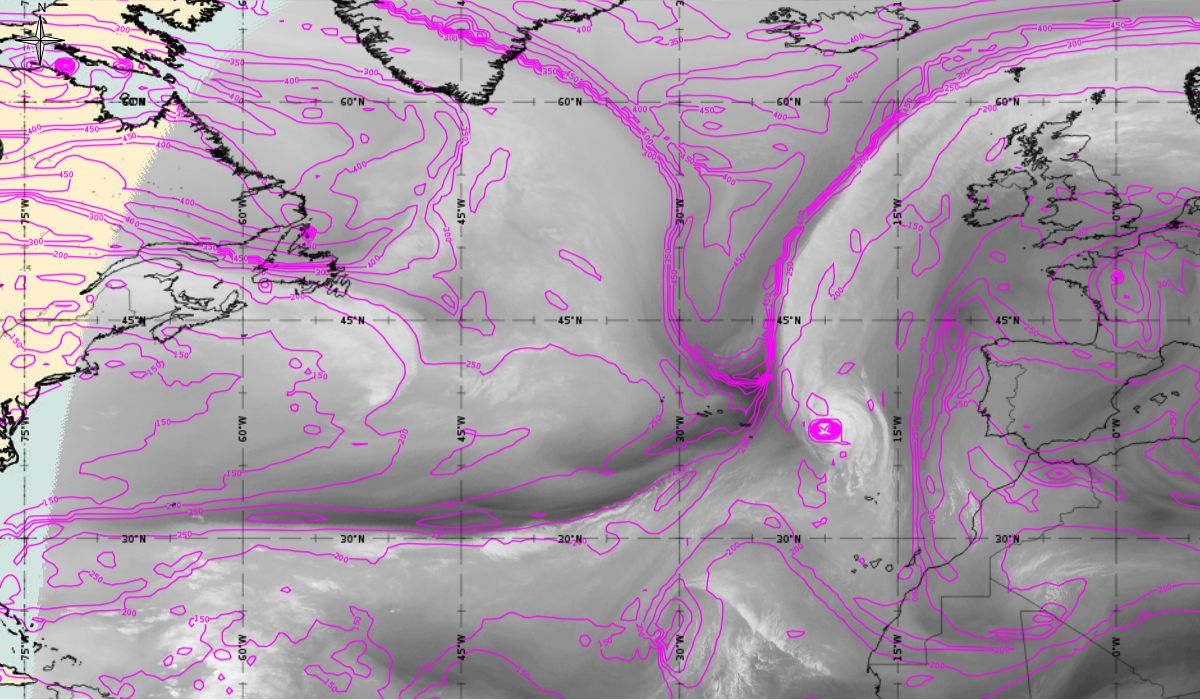
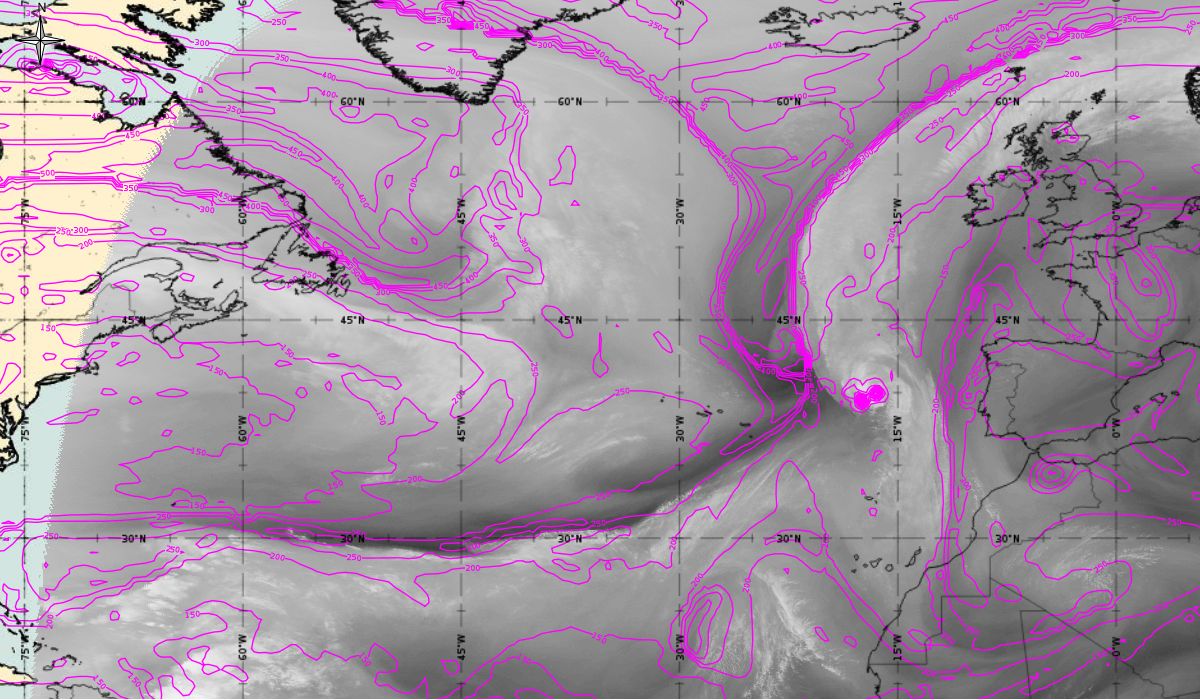
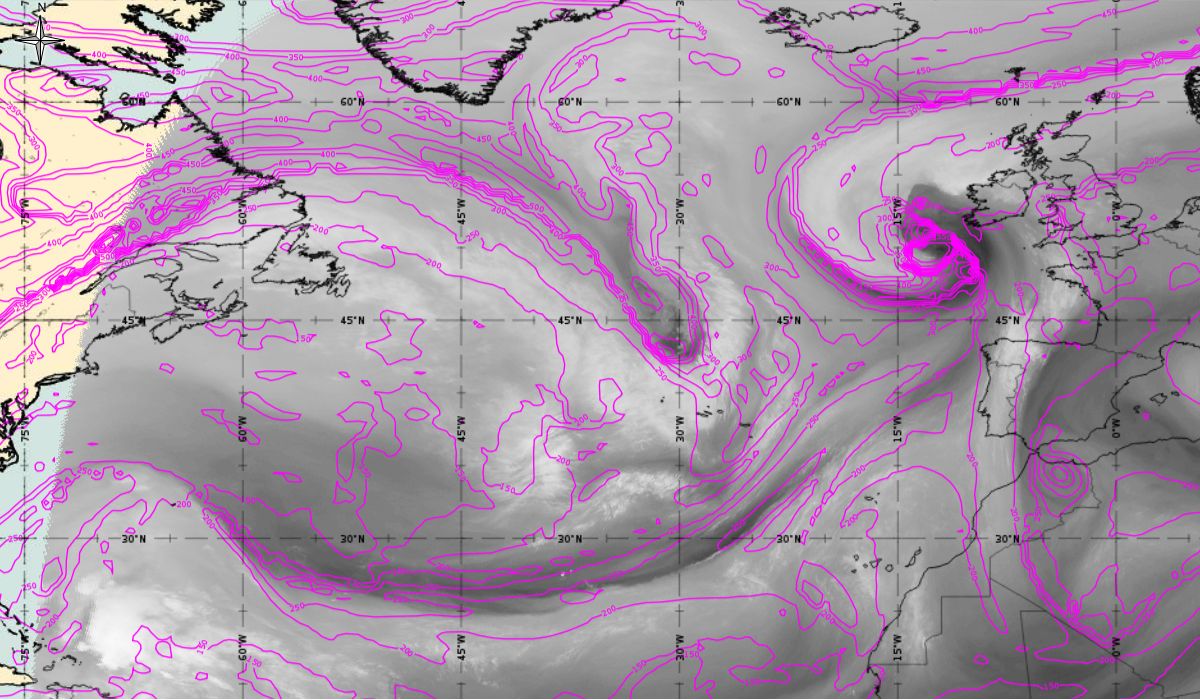
During the lifetime of the storm Ophelia and hurricane Ophelia, we notice the existence of a maximum of PV anomaly over it, but the dark stripe is not so pronounced. It starts to get more pronounced when Ophelia is embedded with the frontal system from the north on 15th October (Figure 26). The lines of PV = 1.5 reaches down to 500 hPa and show a strong gradient in the height of the tropopause. A dry slot in WV imagery (16th October 00:00 UTC) appears as a part of the descending air entering to the southwest of the surface low.
Loop 10: Height of PV=1.5 PVU (magenta), Meteosat 10 WV 6.2 from 15th October 2017, 00:00 UTC to 16th October 2017, 06:00 UTC (source: EUMeTrain, ePort)
Note: To go through individual images, click Loop 10
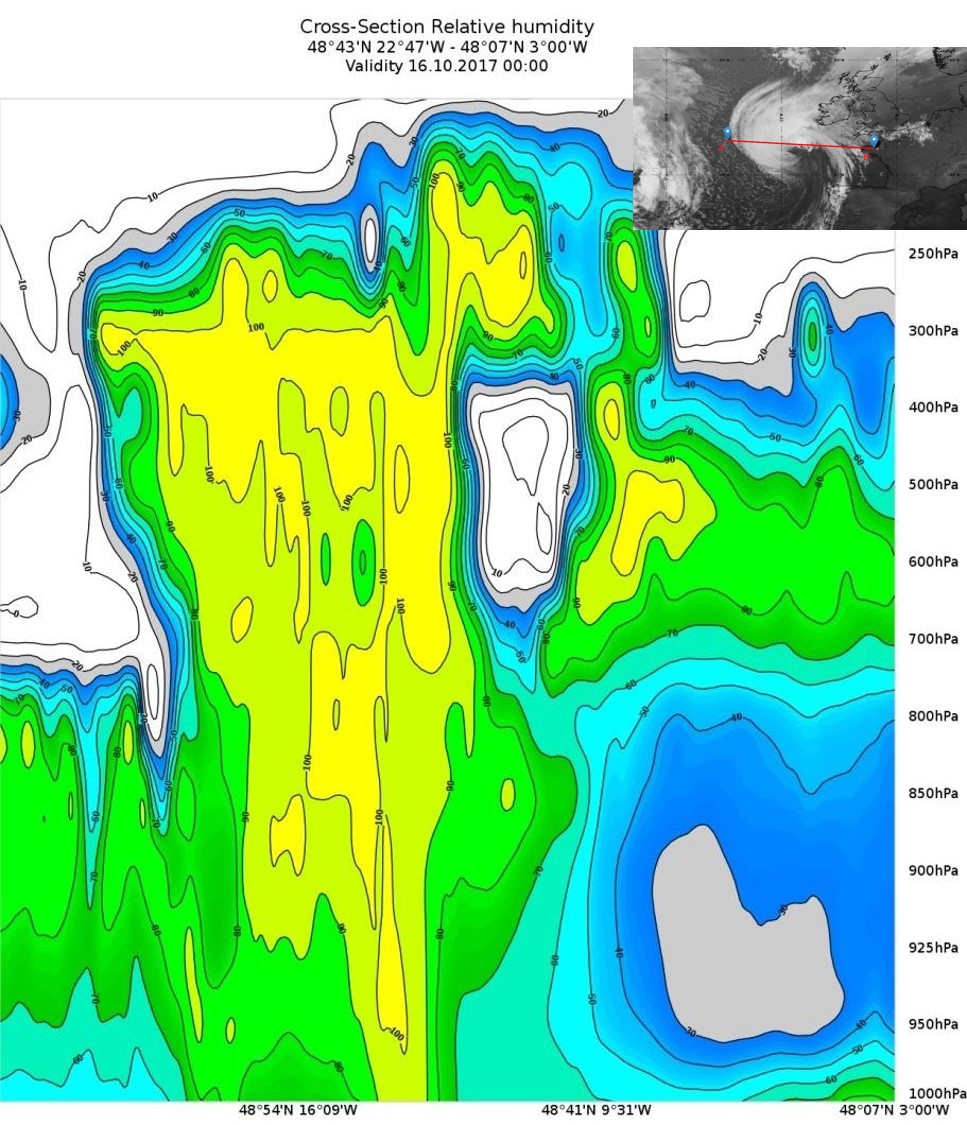
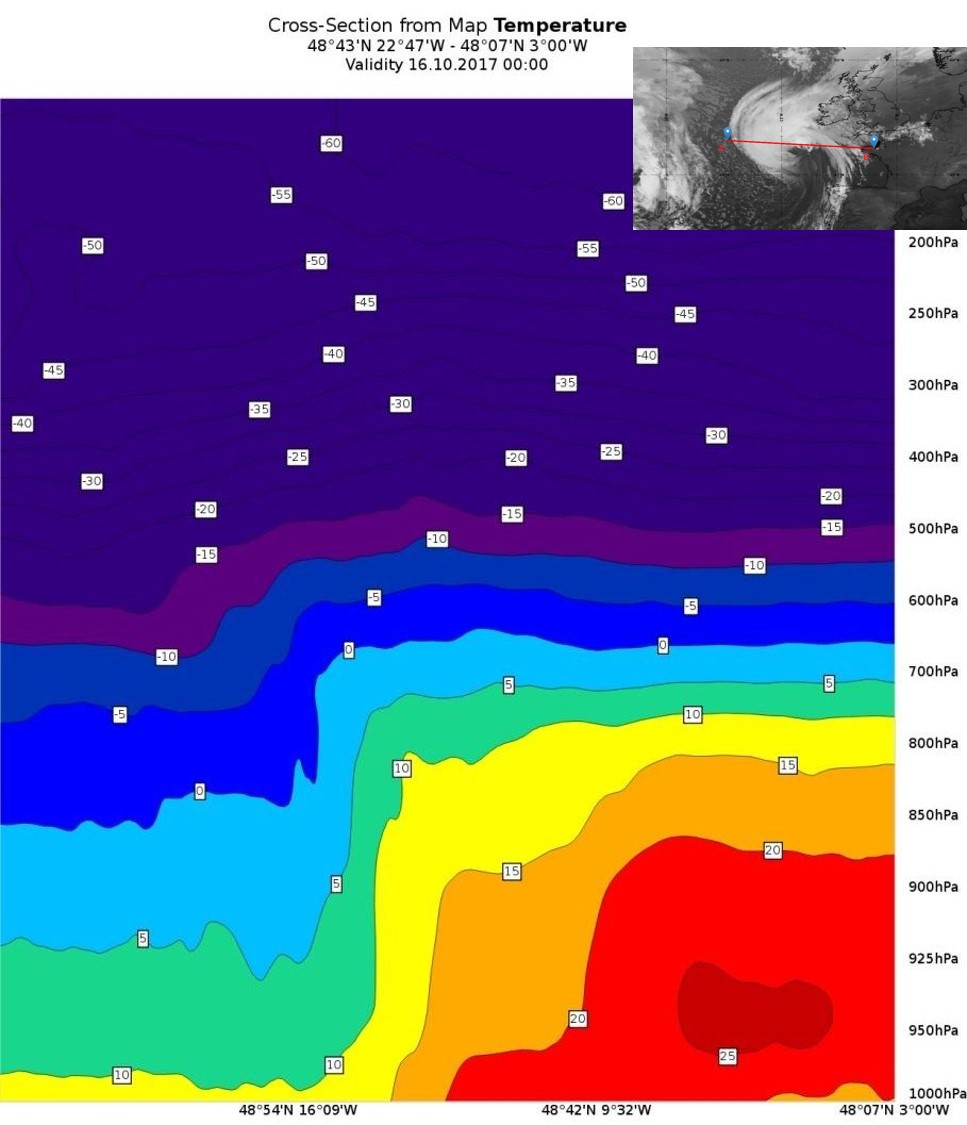
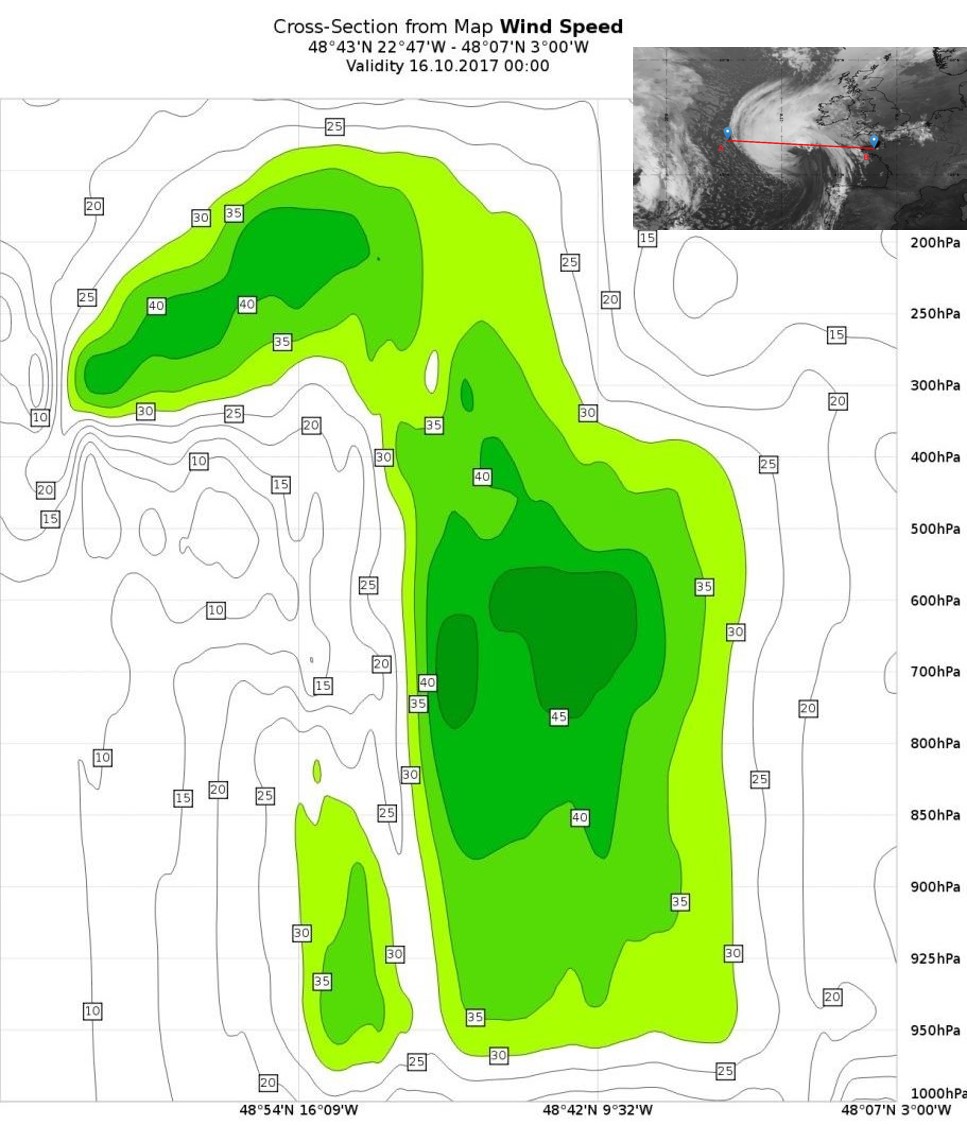
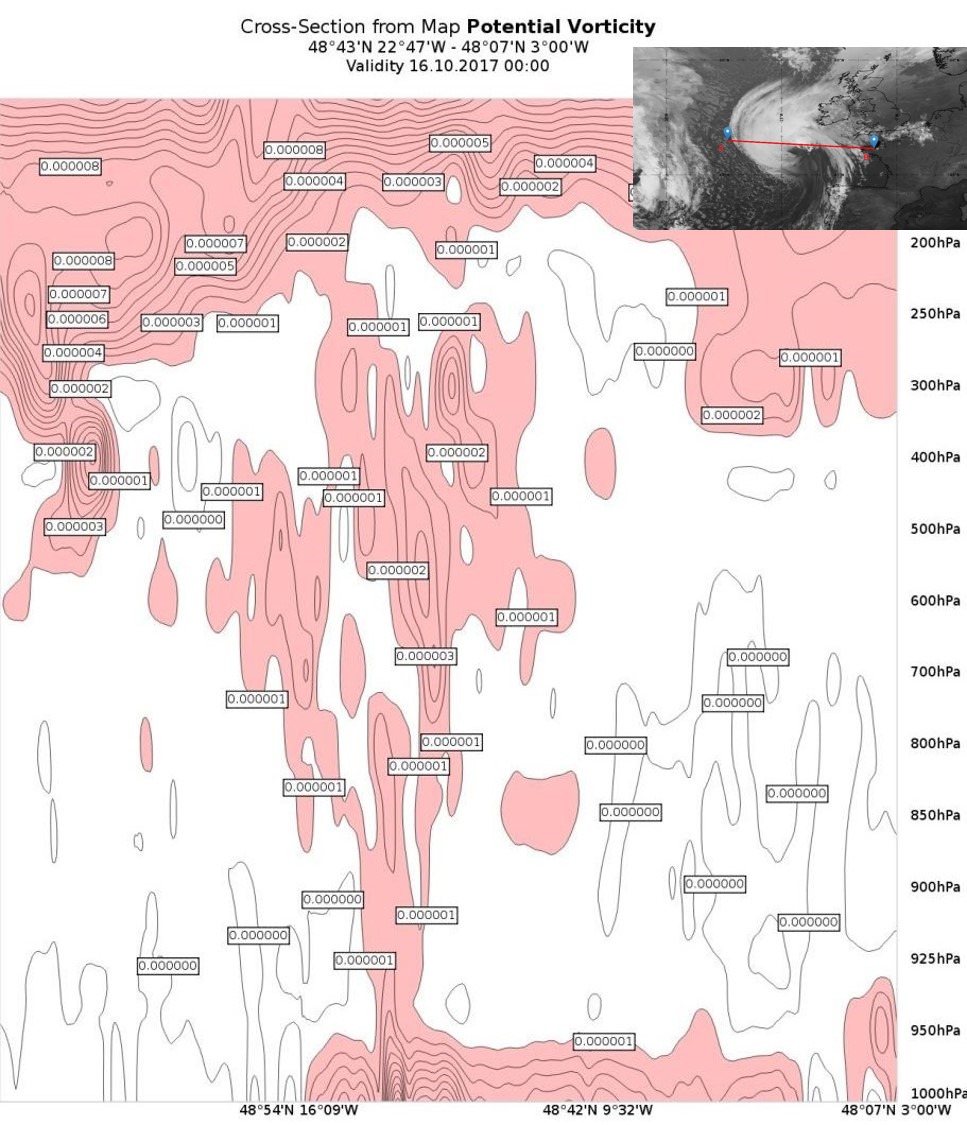
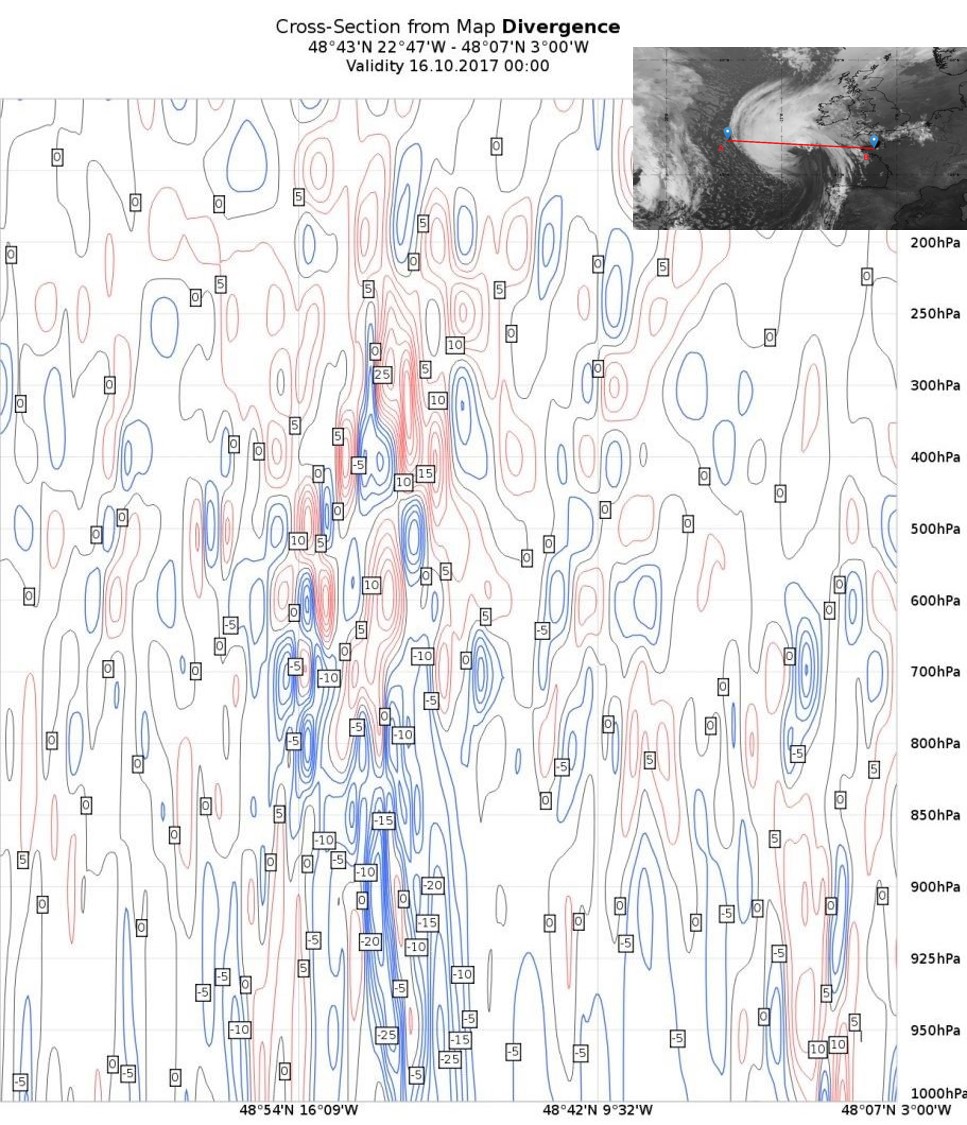
Vertical cross section
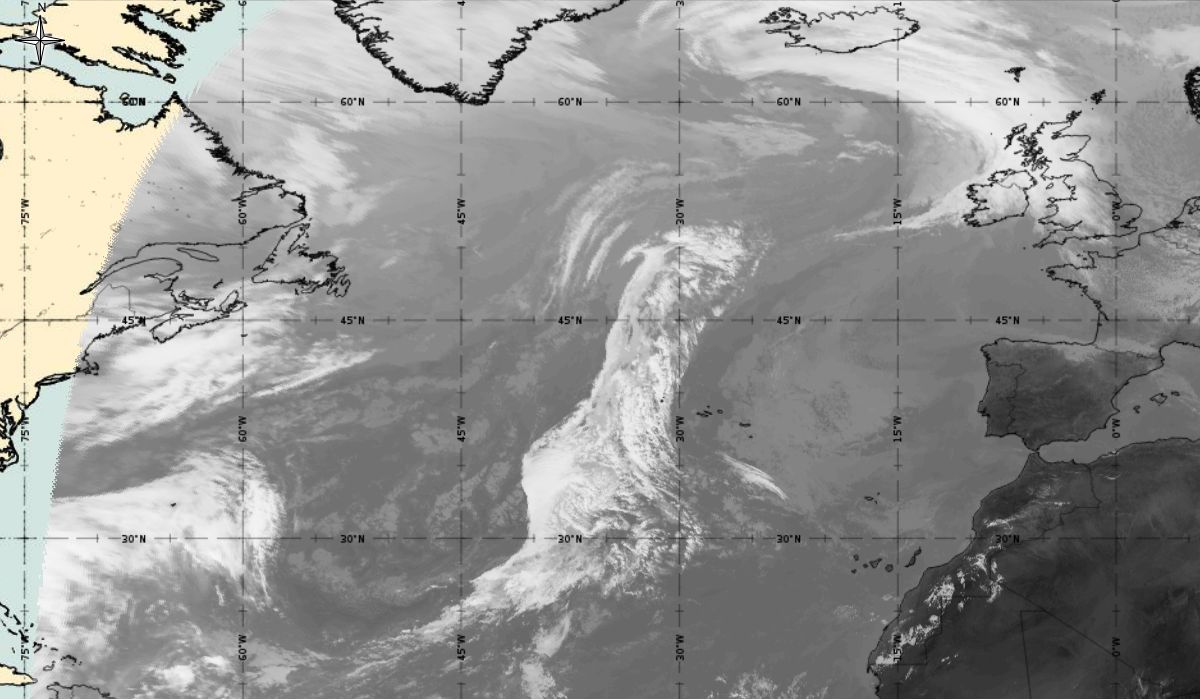
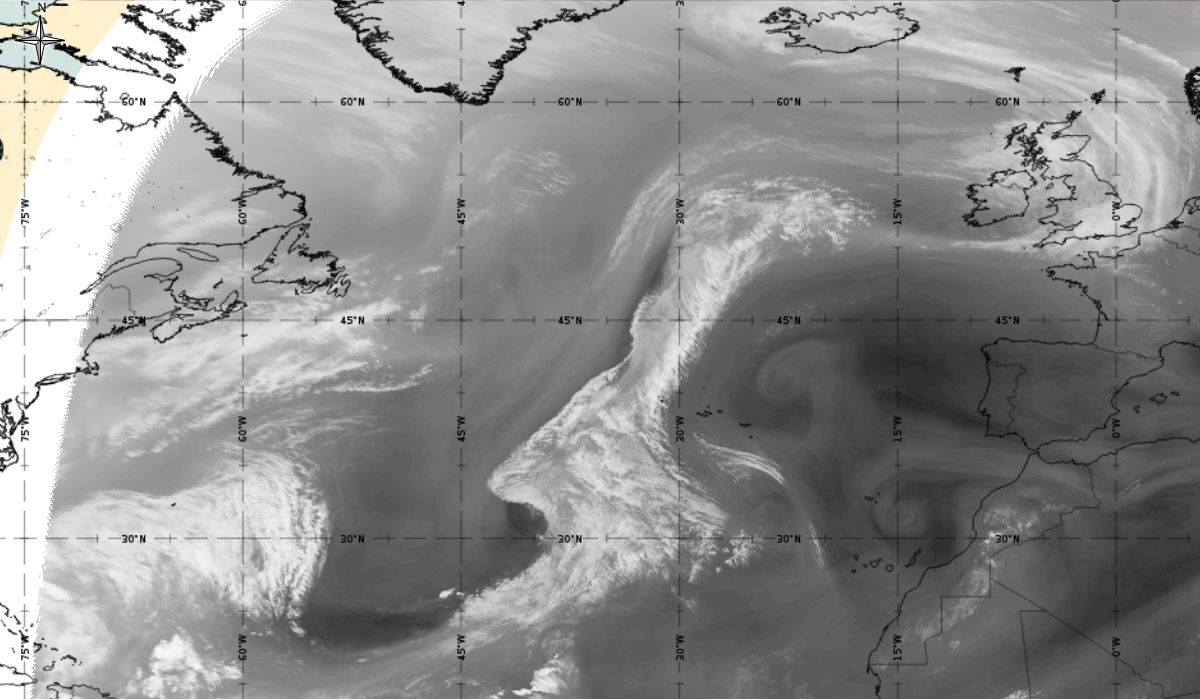
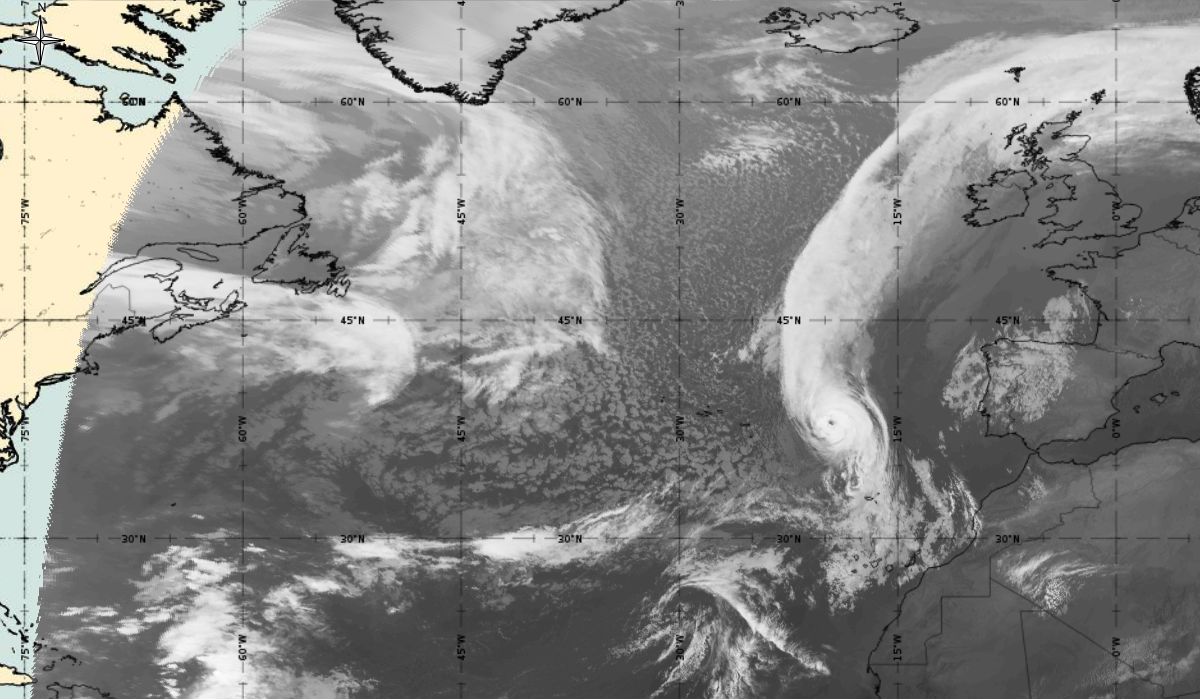
On 16th October, Ophelia was demoted from hurricane to an extratropical storm. A vertical cross section (Figure 27) will help us understand the three-dimensional dynamics of the extratropical cyclone.
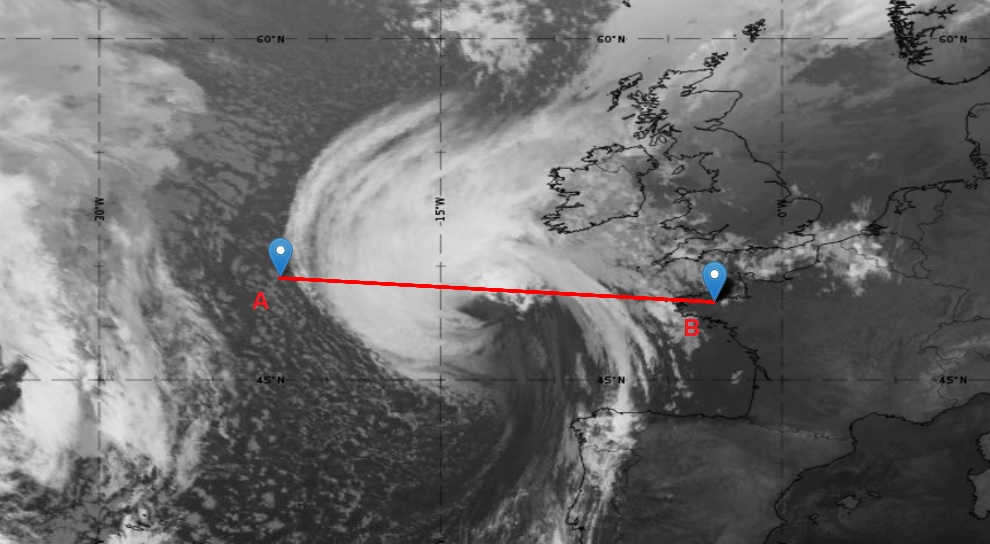
Figure 27: Meteosat 10 IR 10.8 at 16th October 2017, 00:00 UTC; position of vertical cross section indicated (source: EUMeTrain, ePort)