Chapter V: Ash RGB
Table of Contents
The aim of the Ash RGB is to detect the three major volcanic emissions (ash, sulphur dioxide and ice crystals formed from water vapour) in distinct colours, allowing users to track their movements.
Physical basis
Detection of volcanic ash
Thick volcanic ash cloud is not separable from other thick clouds. However, the ash plume thins rapidly further from the source, and the semitransparent ash cloud is already detectable.
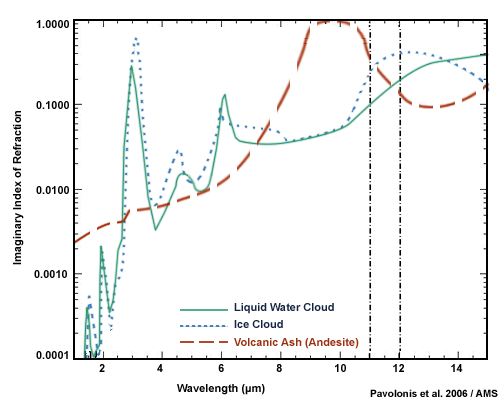
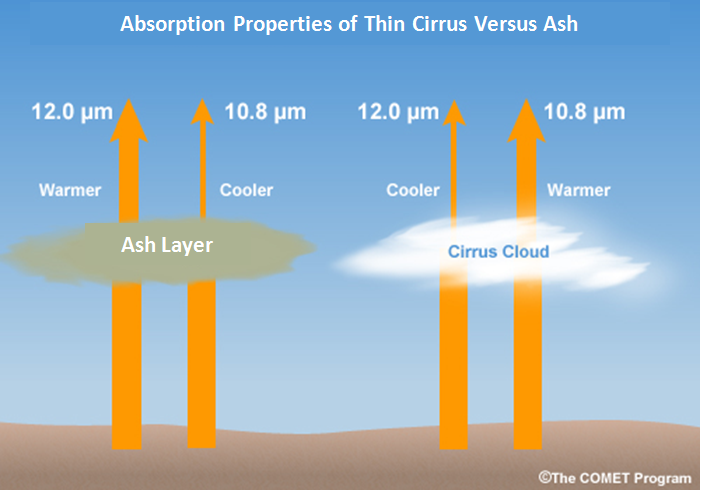
The key channel combination of ash detection is the (IR12.0-IR10.8) difference. This brightness temperature (BT) difference is negative for thin ice clouds and positive for thin ash clouds (see Fig. 1b). For thick clouds and cloud-free surface this difference is around zero.
| Figure 1a: Imaginary index of refraction for liquid water (solid green curve), ice (dotted blue curve) and volcanic ash (dashed brown curve) as a function of wavelength. (Source: http://www.meted.ucar.edu/EUMETSAT/products/print.htm ) |
|
| Figure 1b: Transmission through thin ash and thin ice clouds |
|
For semitransparent clouds the brightness temperature difference between two channels depends mainly on the difference of their spectral transparency: which wavelength is the cloud more transparent on. Ash particles absorb more radiation at 10.8 than 12 micrometers, while ice particles absorb less radiation at 10.8 than 12 micrometers, (see the dashed brown and dotted blue curves of Fig. 1a). Lower absorption means higher transparency, which means thin ice clouds are more transparent at 10.8 and thin ash clouds at 12 micrometers (see Fig. 1b). The (IR12.0-IR10.8) BT difference will be positive for thin ash and negative for thin ice clouds.
The (IR12.0-IR10.8) difference is particularly effective if the ash plumes
- are semitransparent (typically some distance downwind from the site of the eruption),
- reach high altitudes where the temperature difference between the ash cloud and the underlying surface is typically larger,
- contain small ash particles, and
- lack a significant number of water and ice particles.
Detection of volcanic sulphur dioxide gas plume
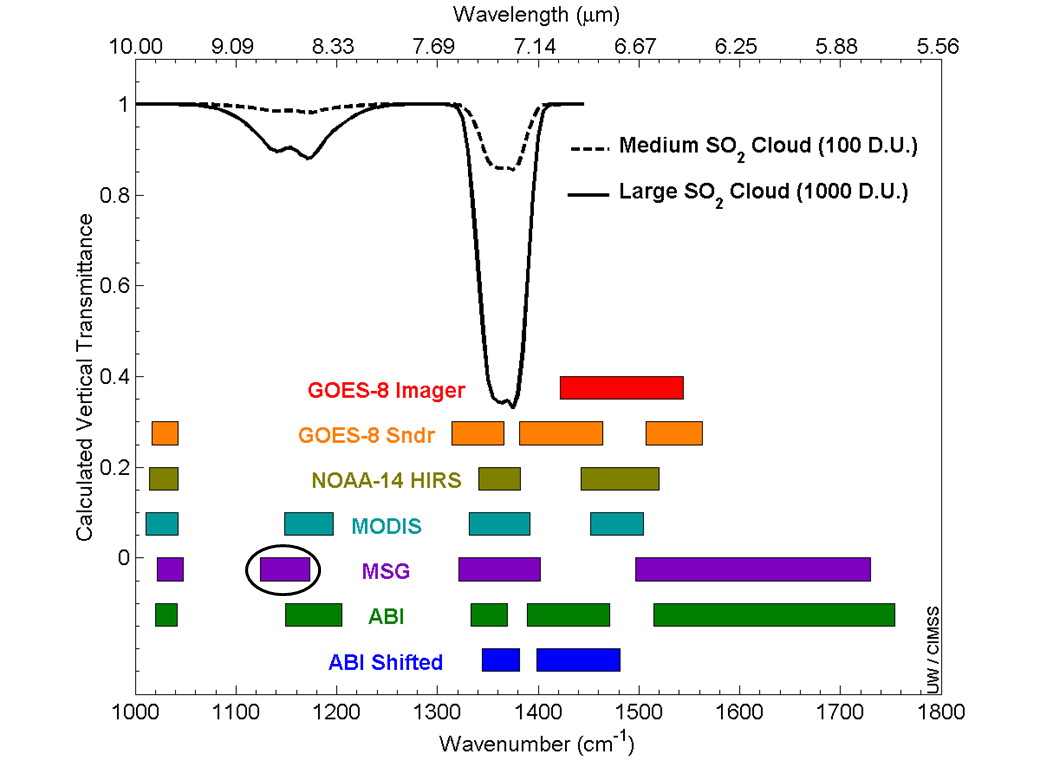
SO2 has a weak absorption band around 8.7 micrometers (see Fig. 2). The spectral bandwidth of SEVIRI IR8.7 channel is encircled. The (IR10.8 - IR8.7) BT difference allows one to detect pure volcanic SO2 plumes: the 10.8 channel is not affected by SO2 gas, while the signal measured by the IR8.7 channel decreases if the atmosphere contains SO2.
| Figure 2: Infrared transmittance of sulphur dioxide (SO2) plumes and the spectral bandwidth of the channels for some satellite sensors. (Source: CIMSS, University of Wisconsin and CSIRO) |
|
Detection of SO2 is more effective if
- the SO2 concentration is higher
- the temperature difference between the underlying surface and the SO2 plume is bigger
- the SO2 plume is pure. Mixed SO2, ash and ice clouds are difficult to detect because the (IR10.8 - IR8.7) difference is positive for SO2 gas plumes and negative for thin ash and thin cirrus clouds.
Creating Ash RGB images
The 'recipe' of the Ash RGB is summarized in Table 1. It shows which channels or channel differences are visualised in red, green and blue. The measured values should be first calibrated to brightness temperatures. The channels or channel differences should be then enhanced - linearly stretched - within the brightness temperature ranges shown in the table.
Table 1: 'Recipe' of Ash RGB
| Colour beam | Channel | Range [K] | |
|---|---|---|---|
| Red | IR12.0 - IR10.8 | -4 | +2 |
| Green | IR10.8 - IR8.7 | -4 | +5 |
| Blue | IR10.8 | 243 | 303 |
This RGB type is usable throughout the day. Note that the channel combinations are the same as for Dust RGB (and for 24 hour Microphysics RGB), but the enhancement is different. The green range is different mainly to better detect SO2 plumes (+5 K gives full green), but also to make thick ice clouds brownish (instead of dark red) to better separate thick ice clouds from thin ash clouds. The blue range is different because ash clouds tend to be higher in the atmosphere (and colder) than dust clouds.
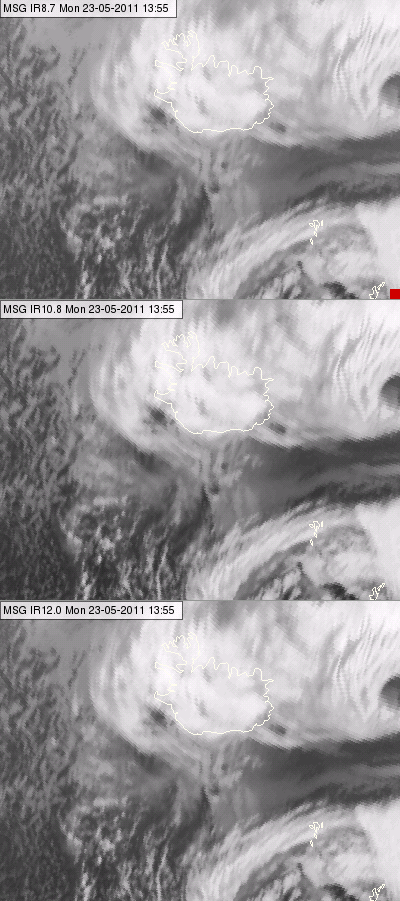
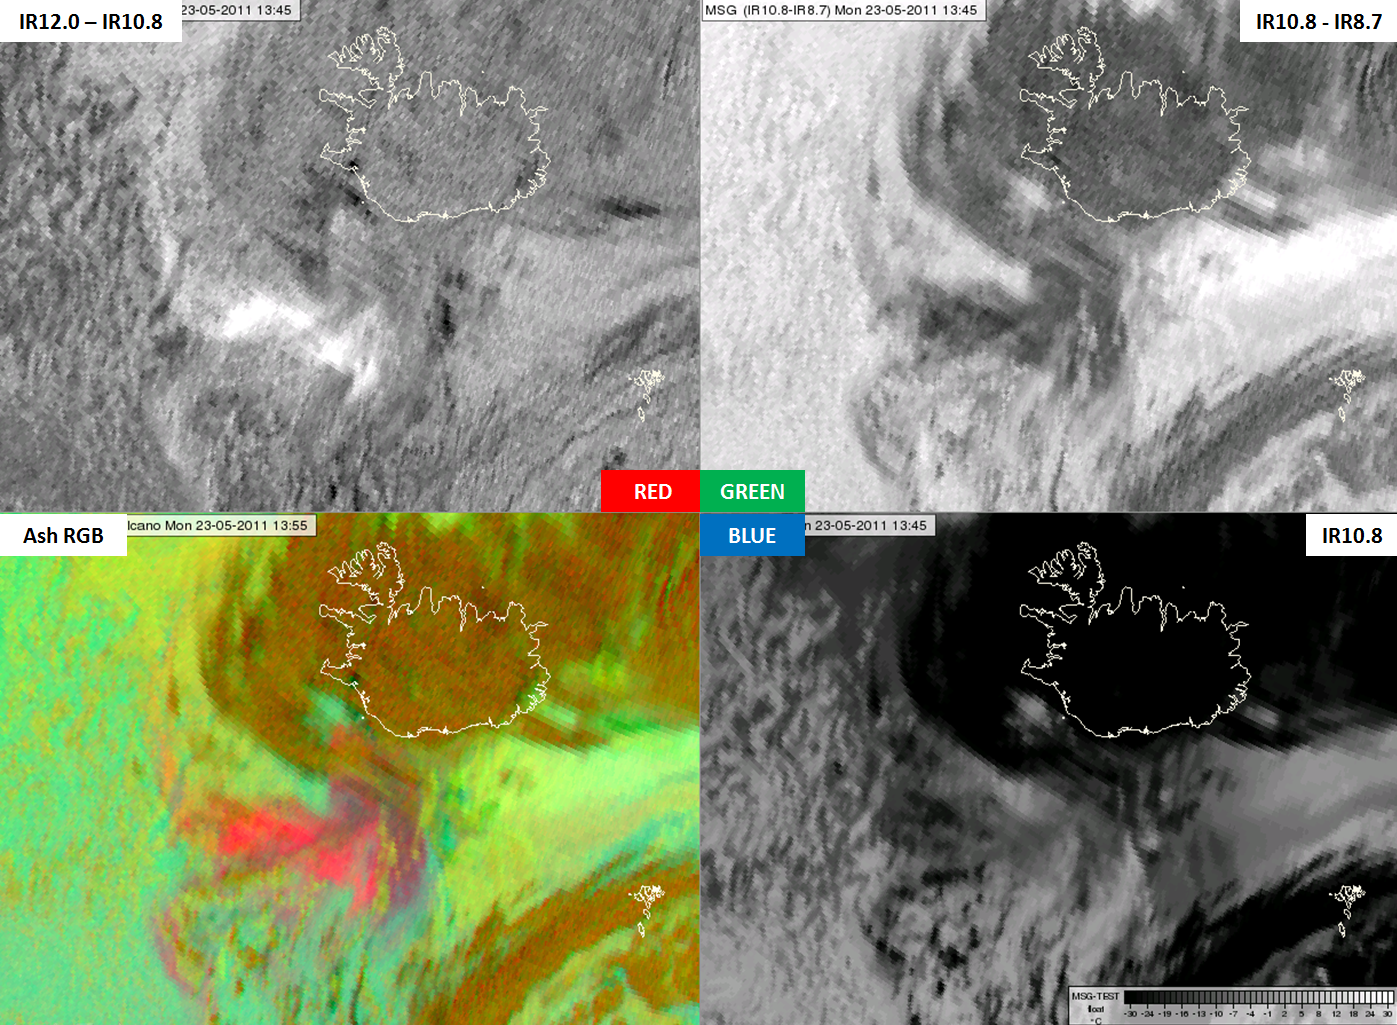
The following example shows how the Ash RGB is combined from the three infrared channels. Fig. 3a shows the three channels separately, all enhanced in the same brightness temperature range (visualising lower brightness temperatures in brighter tones). All three are atmospheric window channels, showing the thick clouds in different shades of gray according to their cloud top temperatures. These single channels do not suggest the presence of volcanic ash over the area.
| Figure 3a: Volcanic eruption in Iceland: IR8.7 (upper panel), IR10.8 (middle panel) and IR12.0 (bottom panel) images for 23 May 2011 at 13:55 UTC |
|
Fig. 3b shows the colour components of the Ash RGB images: the channel (differences) with their corresponding enhancements. The lower left panel shows the Ash RGB.
- The bright shades in the (IR12-IR10.8) difference image hint at volcanic ash. Dark shades indicate semitransparent clouds or sub-pixel water clouds while medium grey shades indicate thick clouds or a cloud-free surface
- The (IR10.8-IR8.7) difference image reveals the phase of the clouds: water clouds are bright, ice clouds are dark, and thin clouds are even darker. A thin ash cloud is similar to thin ice clouds.
- The IR10.8 image is enhanced according to the range in Table 1. (Cold clouds are black, warm clouds and surface features are brighter.) The semitransparent ash cloud has a medium strong signal.
In Ash RGB images volcanic ash plumes appear red or magenta; the red component is strong while the green and blue components are weaker. The volcanic ash plume has a good colour contrast against the surrounding water and ice clouds and the sea.
| Figure 3b: Volcanic eruption in Iceland: IR12.0-IR10.8 (top left), IR10.8-IR8.7 (top right), IR10.8 (bottom right) and Ash RGB (bottom left) images for 23 May 2011 at 13:55 UTC |
|
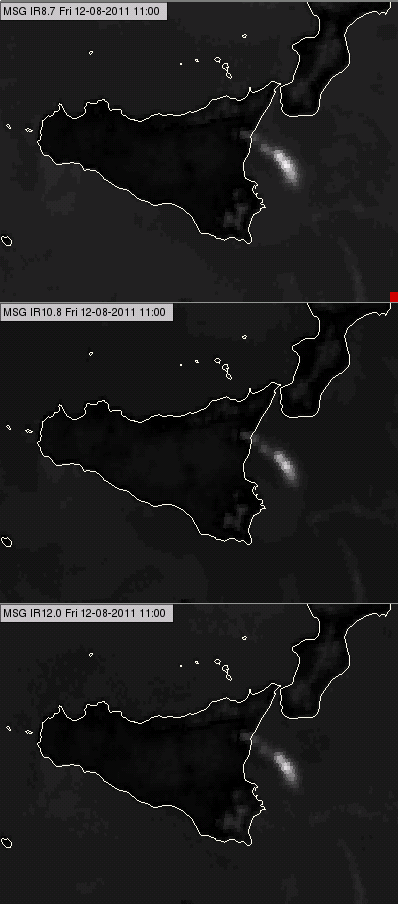
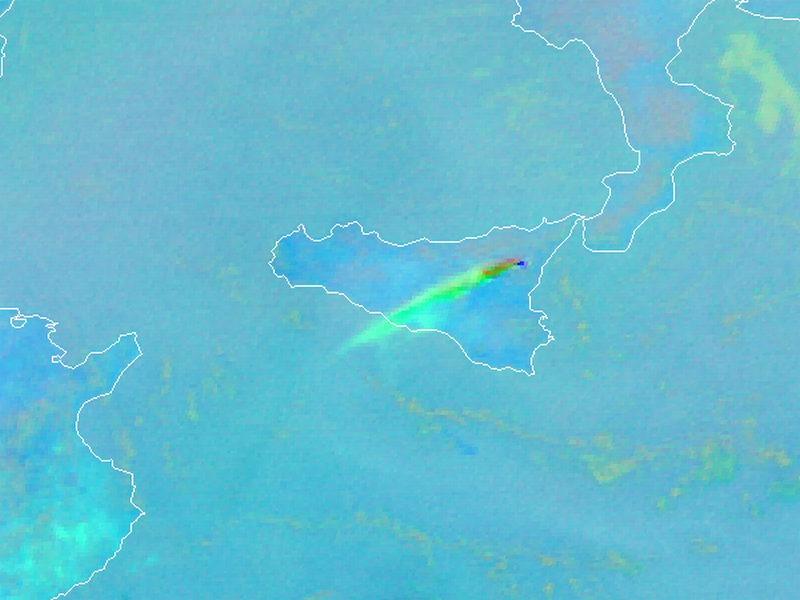
Figs. 4a and 4b show an example when SO2 gas was released by Mount Etna in Sicily. The eruption happened in cloud-free conditions. Etna first spewed out an SO2 gas plume, followed by an ash cloud. Fig. 4a shows the three infrared channels separately, all enhanced in the same brightness temperature range (lower brightness temperatures are visualised in brighter tones). All three channels show an elongated colder band downwind of the mountain, which gets colder further out.
| Figure 4a: Volcanic eruption of Mount Etna, Sicily: IR8.7 (top), IR10.8 (middle) and IR12.0 (bottom) images for 12 August 2011 at 11:10 UTC |
|
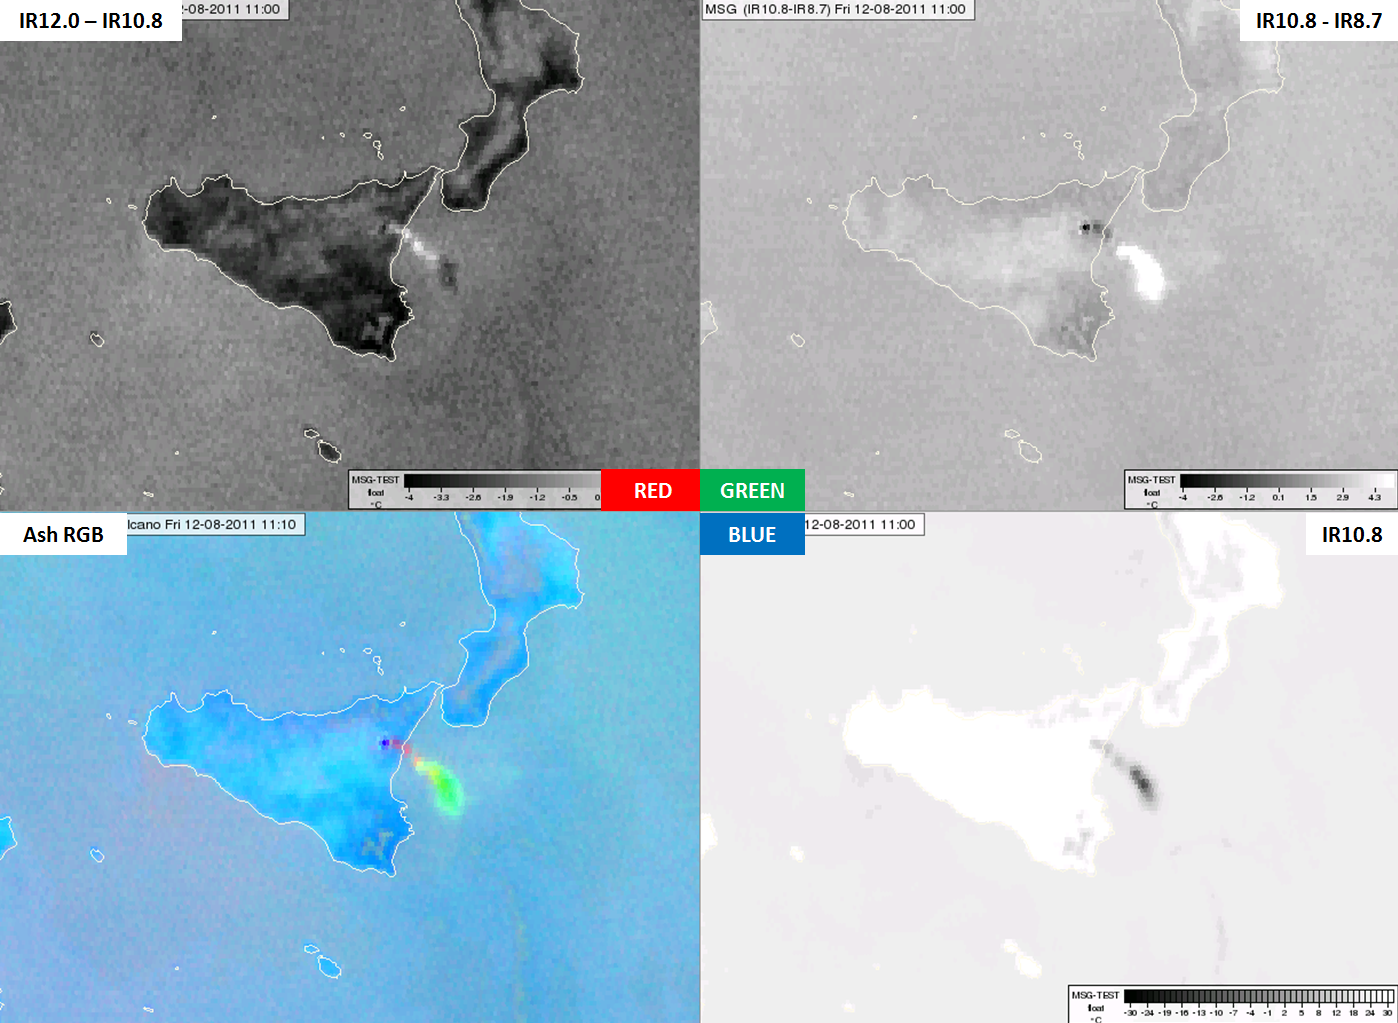
Fig. 4b shows the colour components of the Ash RGB image for the Mount Etna eruption: the channel and channel differences which comprise the image, with the corresponding enhancement. The lower left panel shows the Ash RGB.
- The bright shades in the (IR12-IR10.8) difference image could be volcanic ash. The dark shades at the end of the plume could be semitransparent ice clouds.
- The bright shades in the (IR12-IR8.7) difference image could be SO2 gas plume. Close to the crater there is a short elongated darker band, likely ash cloud. However, based only on this difference it might also be a thin ice cloud. Note that in the (IR10.8-IR8.7) difference image one can recognize the hot spot of the crater.
In the Ash RGB one can recognize the hot lava in the crater (dark blue) and a plume downwind of Mount Etna. The plume is magenta close to the crater and green further downwind, with some yellow patches in between. The green colour indicates an SO2 gas plume; the magenta colour indicates a volcanic ash plume and the yellow patches are likely to be their mixture.
The ice cloud hinted by the (IR12-IR10.8) difference image is not seen in the Ash RGB image. The gas and ash plumes are well separated from the surface colours.
| Figure 4b: Volcanic eruption in Sicily, Mount Etna. IR12.0-IR10.8 (top left), IR10.8-IR8.7 (top right), IR10.8 (bottom right) and the Ash RGB (bottom left) images for 12 August 2011 at 11:10 UTC |
|
Typical colours of the Ash RGB images
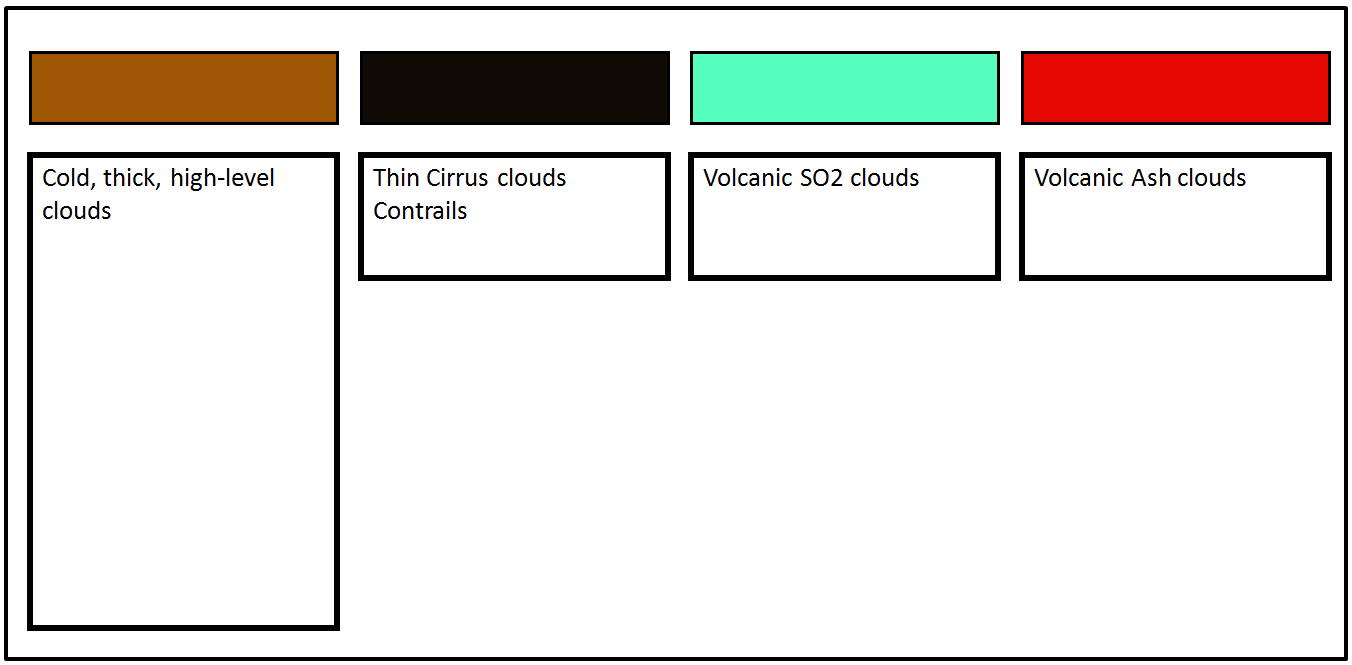
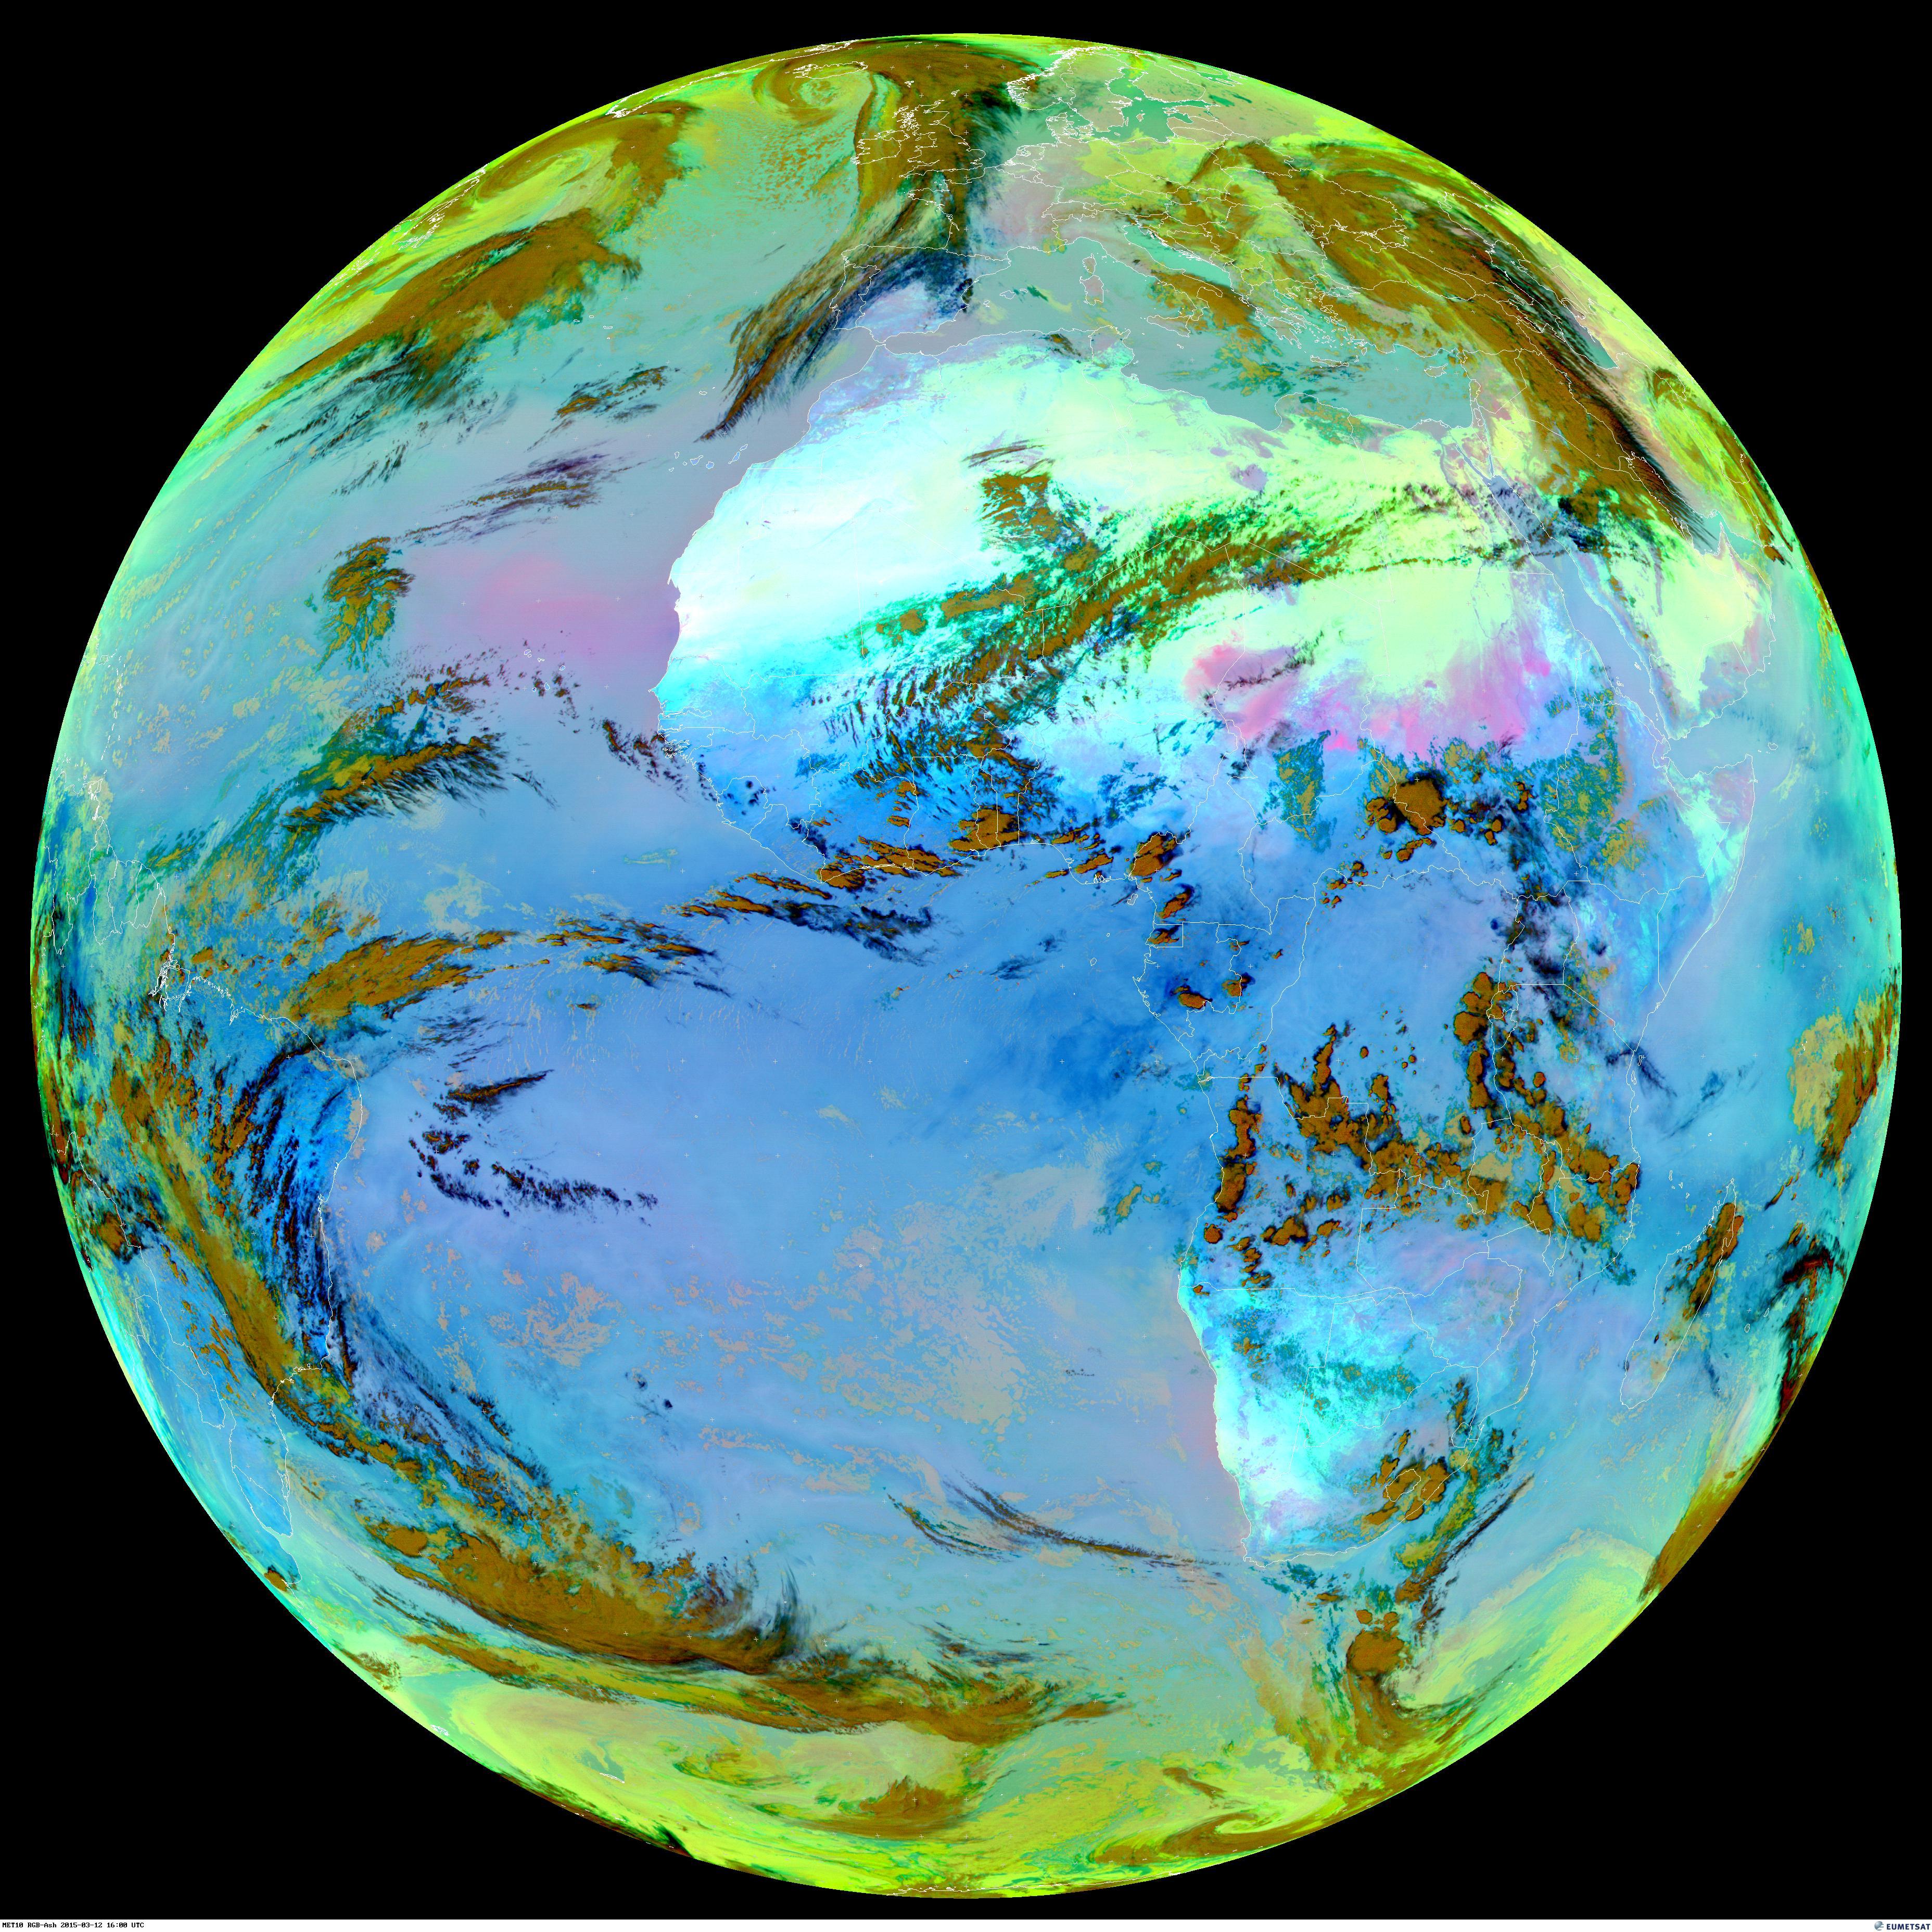
Fig. 5 shows the most typical colours of the Ash RGB images. The image contains many variations of colours (see for example Fig. 6) as the colours depend on many things, such as temperature, viewing angle, type of material, particle concentration, phase and size, etc.
| Figure 5: Typical colours of Ash RGB images (Source: Jochen Kerkmann, MSG Interpretation Guide, EUMETSAT, http://www.eumetsat.int) |
|
Interpretation of the colours
- Sulphur dioxide clouds are typically green, but can be yellow with ash mixed in.
- Depending on the height, temperature and particle size, ash plumes goes from being bright red and pink (when very cold) to magenta (when warm) to yellow (when they are composed of very small ash particles).
- Thin cirrus appears black or dark blue
- High thick clouds and thunderstorms appear brown, with shades of orange and red for clouds composed of smaller ice particles.
- Middle- and low-level clouds may appear in lighter shades of brown, blue, and green (at high latitudes and near the edges of the images of full Earth disk).
- Blowing dust may appear as magenta.
- Moist low levels, particularly the boundary layer, appear in bluish shades.
- Surface features appear in lighter shades of blue, green, and dull magenta. Desert appears even brighter.
| Figure 6: Global view of Ash RGB, 12 March 2015 at 16:00 UTC |
|
Examples of interpretation
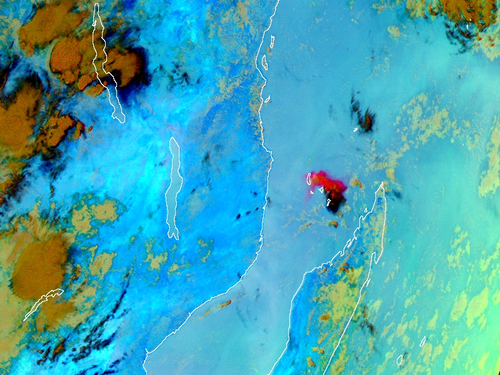
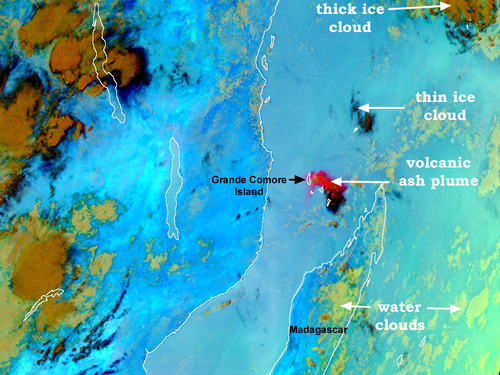
Two cases are shown with and without annotations to demonstrate proper interpretation. The Karthala volcano on the Grande Comore Island (near Madagascar) is one of the largest active volcanoes in the world. Fig. 7 shows one of its eruption, during which it released significant amounts of volcanic ash. The animation created from 15-minute Ash RGB images from 24 November 17:00 UTC to 25 November 23:00 UTC shows that the volcano first emitted large amount of volcanic ash and then it released SO2 gas plume as well.
| Figure 7: Volcanic eruption near Madagascar on Island Grande Comore for 25 November 2005 at 08:00 UTC with and without annotations (Source: Image library, EUMETSAT homepage, http://www.eumetsat.int/website/home/Images/ImageLibrary/DAT_IL_05_11_25.html) |
|
| Animation 1: Ash RGB animation (from 24 November 17:00 UTC to 25 November 23:00 UTC) |
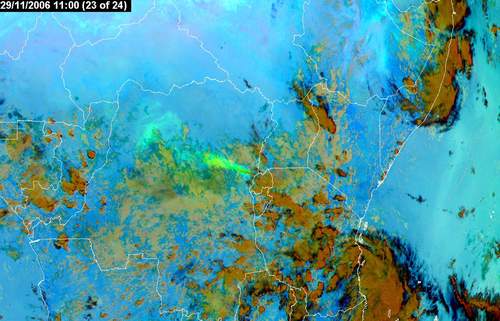
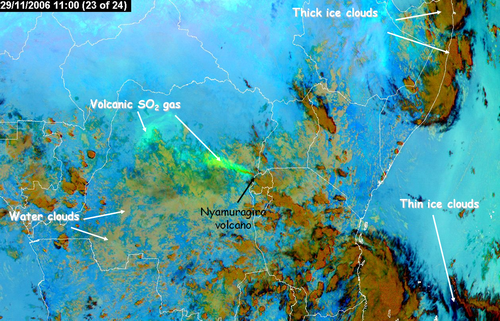
The other case shows the eruption of Nyamuragira, which is the most active volcano in Africa. At November 2006 it released large amounts of sulphur dioxide. The image below show the situation about 36 hours after the start of the eruption. The sulphur dioxide cloud is shown in green.
| Figure 8: Volcanic eruption in Africa with and without annotations for 29 November 2006 at 11 UTC (Source: Image Library, EUMETSAT homepage, http://www.eumetsat.int/website/home/Images/ImageLibrary/DAT_IL_06_11_29_A.html) |
|
Comparison with other RGB types
Ash RGBs are created from the same channels (channel differences) as Dust RBGs. Only the enhancement is different. For Dust RGB the main aim is to separate dust clouds from other features. For Ash RGB the main aim is to separate ash and SO2 plumes from each other and from water clouds, ice clouds and cloud-free surface
Fig. 9 shows Dust and Ash RGB images of a volcanic ash plume southwest of Iceland. The colours are similar, but in the Ash RGB the water and ice clouds appear in paler tones, so the ash plume has a better colour contrast against the water and ice clouds.
| Figure 9: Volcanic eruption on Iceland. Dust RGB (left) and Ash RGB (right) for 23 May 2011 at 12:10 UTC |
|
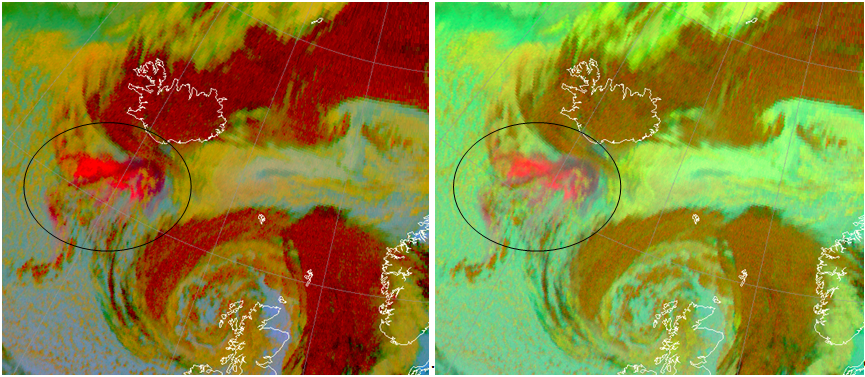
Usually the Ash RGB is more appropriate for monitoring the movement of ash and SO2 plumes. However, in some cases the Dust RGB is better. For example, at high satellite viewing angles SO2 plumes are easier to detect in Dust RGBs. In Fig. 10 the Dust RGB provides better colour contrast between a SO2 plume and the lower level clouds. On the far edges of MSG images, one should use the Dust RGB rather than the Ash RGB for ash and SO2 detection. However, for all other areas, the Ash RGB gives better contrast for ash/SO2 detection.
| Figure 10: Volcanic eruption on Iceland, SO2 gas plume. Dust RGB (left), Ash RGB (right) for 22 May 2011 at 06:55 UTC |
|
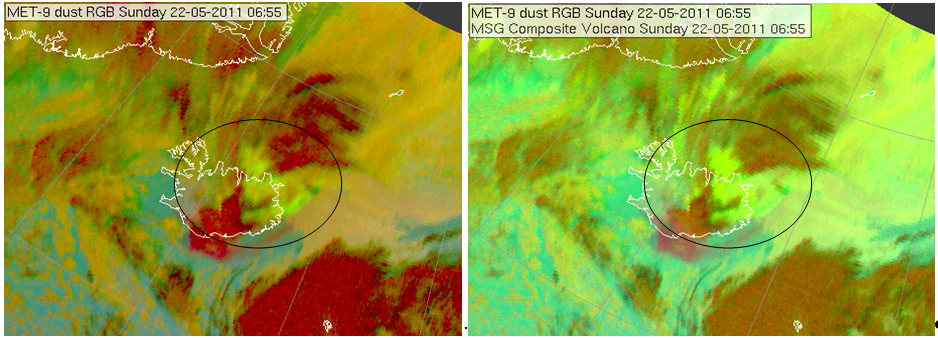
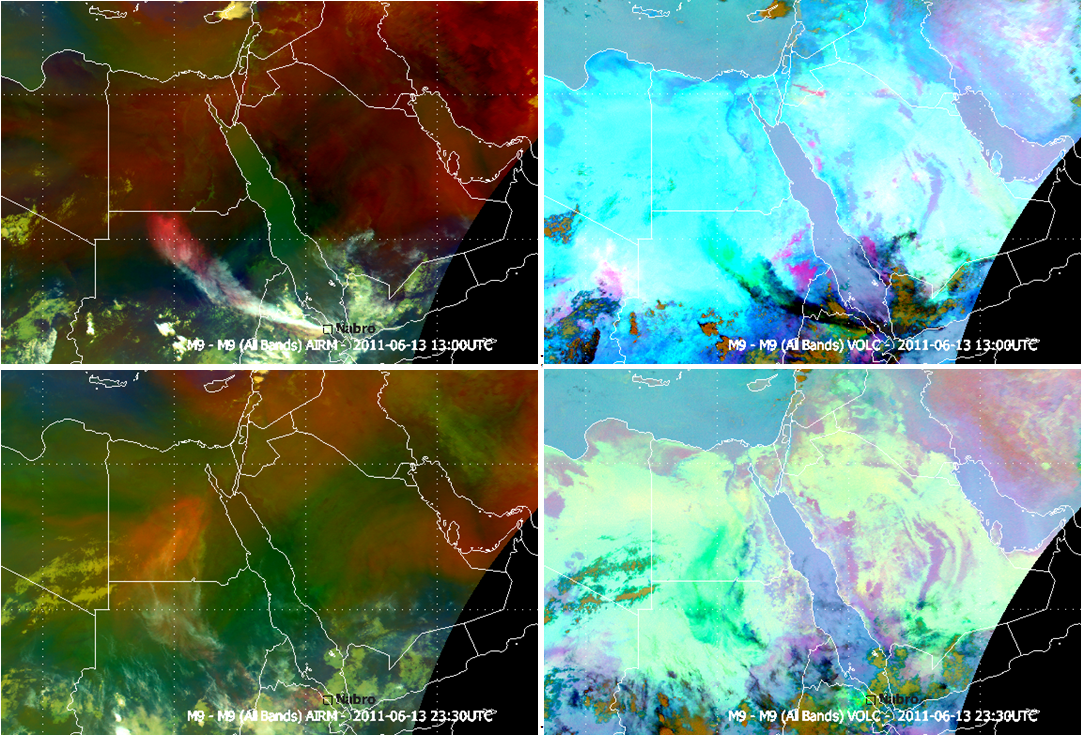
Note that higher level SO2 plumes are detected by Airmass RGB as well (in reddish colours). SO2 has an absorption band around 7.3 micrometers (see Fig. 2), which channel is used in the Airmass RGB. In certain situations (e.g. over desert surfaces) the Airmass RGB is even better for SO2 detection than the Ash RGB. Fig. 11 shows a SO2 gas plume from the Nabro Volcano eruption both in Airmass and Ash RGBs (day and nighttime). Its colour contrast against the desert surface is low in Ash RGB and much better in Airmass RGB. (The SO2 gas plume is reddish in Airmass RGB and greenish in Ash RGB.)
| Figure 11: Volcanic eruption on Iceland, SO2 gas plume. Dust RGB (left), Ash RGB (right) for 22 May 2011 at 06:55 UTC |
|
Benefits and limitations
The main advantage of the Ash RGB is that it shows the three major volcanic effluents (ash, sulphur dioxide and ice crystals formed from water vapour) in distinct colours, enabling users to observe them drifting from the site of an eruption.
Limitations
- Limited detection of ash and sulphur dioxide when present with ice particles (mixed volcanic clouds).
- Black cirrus can be a part of either volcanic or non-volcanic cloud systems.
- Some features in the RGB image might have similar colour as the SO2 plume (especially at high latitudes and near the edges of the images of full Earth disk), see Figs. 6 and 10.
Exercises
Question
Look at Fig. 12 and the animation showing the eruption of Mount Etna on 26 October 2013 around 9 UTC and answer the question.
| Figure 12: Volcanic eruption, Mount Etna, 26 October 2013 at 09 UTC (source: Image library on the EUMETSAT homepage, http://www.eumetsat.int/website/home/Images/ImageLibrary/DAT_2083474.html) |
|
| Animation 2: Ash RGB animation (26 October 2013, around 9 UTC) |
Which effluents are recognizable in the Ash RGB animation?
The correct answer is: All 4 features are seen in the animation.
The majority of emissions were SO2 (green). Ash plumes (red) also appear from time to time. Ice clouds consisting of water vapour originating from the volcano appear black. The dark violet colour represents the hotspot from the lava.