Cloud Structure In Satellite Images
As already mentioned in the general remarks, the cloud band of the occlusion described in this chapter develops in the area of a wave (see Wave ) However, the cloud band exhibits clearly different cloud layers, in contrast to the occlusion of the warm conveyor belt type (see Occlusion: Warm Conveyor Belt Type ).
In a fully developed stage, the satellite image shows two synoptic scale cloud bands:
- a multi-layered frontal cloud band associated with the cold front
- a lower cloud spiral which seems to penetrate from below the higher cloud band associated with the cold front
- both cloud bands seem to be uncoupled
Appearance in the basic channels:
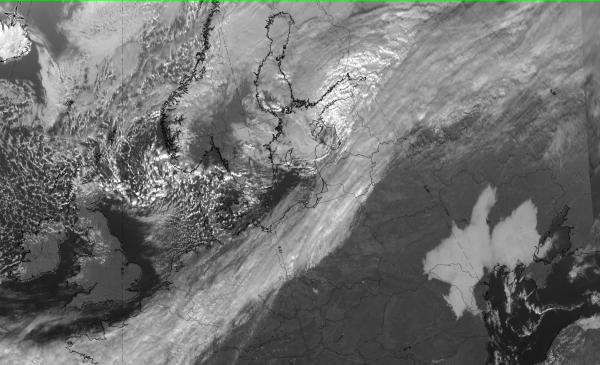
- In the VIS image the cloud spiral is white indicating deep-layered cloudiness with high albedo.
- In the IR image the grey shades of a cold conveyor belt cloud band are more grey but with some
increased white areas overlaid. The following points can be summarized:
- At the boundary between the cloud band of the cold and warm front (oriented south-west to north-east) and the clouds associated with the cold conveyor belt type, a distinct gradient from white to (dark) grey can be observed. Often at some distance away from the boundary, cloud tops gradually become higher (whiter) followed again by a decrease of cloud-top heights within the innermost part of the cloud spiral. Such a cloud structure can be well explained with the conveyor belt theory (see Meteorological physical background ).
- During the later stages of development, high clouds can also develop leading to a similar appearance to the warm conveyor belt type of the occlusion (see Meteorological physical background ).
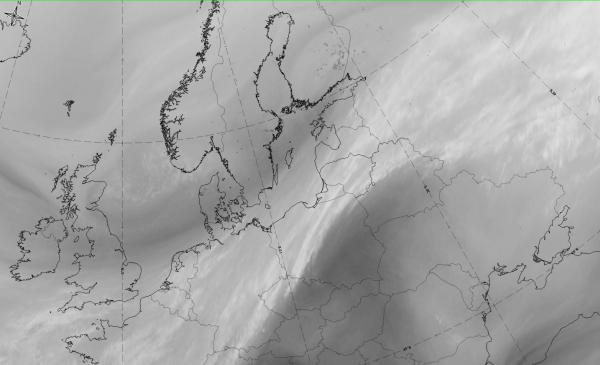
- In the WV image the two cloud bands with different cloud types are seen with even greater contrast. A black stripe characterising the dry air on the cyclonic side of the jet axis extends parallel to the higher cloud band and immediately crosses the cold conveyor belt cloudiness at the boundary. This effect cannot be detected in the case of an occlusion of the warm conveyor belt type. The driest air represented by darkest pixel values is included in the spiral development. This fact can be observed in both types of occlusion (see Occlusion: Warm Conveyor Belt Type ). During the later stages of development, high and therefore bright pixel values can be observed within the entire cloud spiral which means that the crossing black stripe is no longer visible.

Appearance in the basic RGBs:
Airmass RGB
The ccb occlusion cloud spiral and the connected cloud bands of the cold front and warm front form a synoptic scale frontal system. The ccb occlusion cloud spiral protrudes from below the WF cloudiness into the cold air trough and consequently exhibits lower cloud-tops heights.
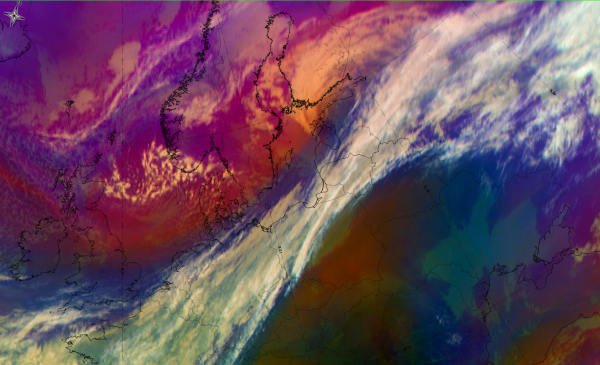
The airmass RGB represents the warm and cold air masses in front of the frontal system with blue and green colours - depending on the geographical latitude. Green colours are more frequent in the southern areas. Behind the frontal cloud and the spiral cloud bands there are mostly brown colours, representing the sinking dry airmass. However, sometimes the colour here is blue, demonstrating that cold air exists.
In the airmass RGB, the cloud spiral of the ccb occlusion are very similar to the IR channels; often with a brownish shading exists above which demonstrates the overrunning dry air.
Dust RGB
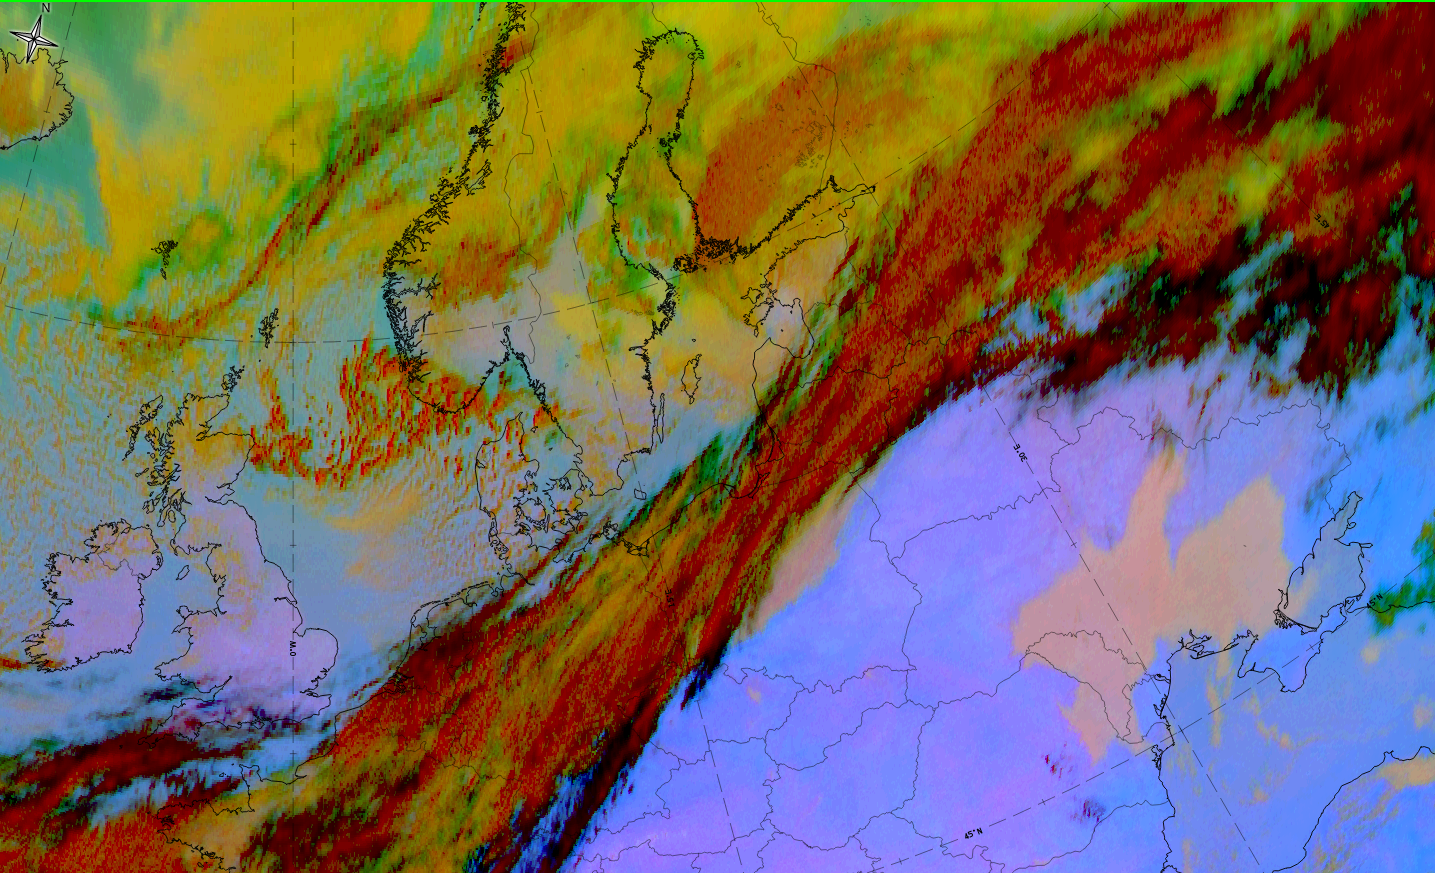
The dust RGB appears in front of the frontal cloud band with mostly blue colours, representing the cloud free area; this can be blocked by other cloud areas. Behind the frontal cloud band and the ccb occlusion cloud spiral there are also some blue or pinkish blue areas where there is no cloud. However, there are typically also yellowish to ochre colours representing subsequent low cloudiness (cold air cloudiness and stratus).
In the Dust RGB the cold conveyor belt occlusion spiral shows a mixture of yellowish and red-brown areas; these colours are less intensive as those in the cloud band of the cold and warm front indicating lower cloud-top heights of the ccb occlusion spiral.
 |
 |
 |
|
Legend: Schematics for basic RGBs
Upper: Airmass RGB with full and partly dry air overrun; low: dust RGB
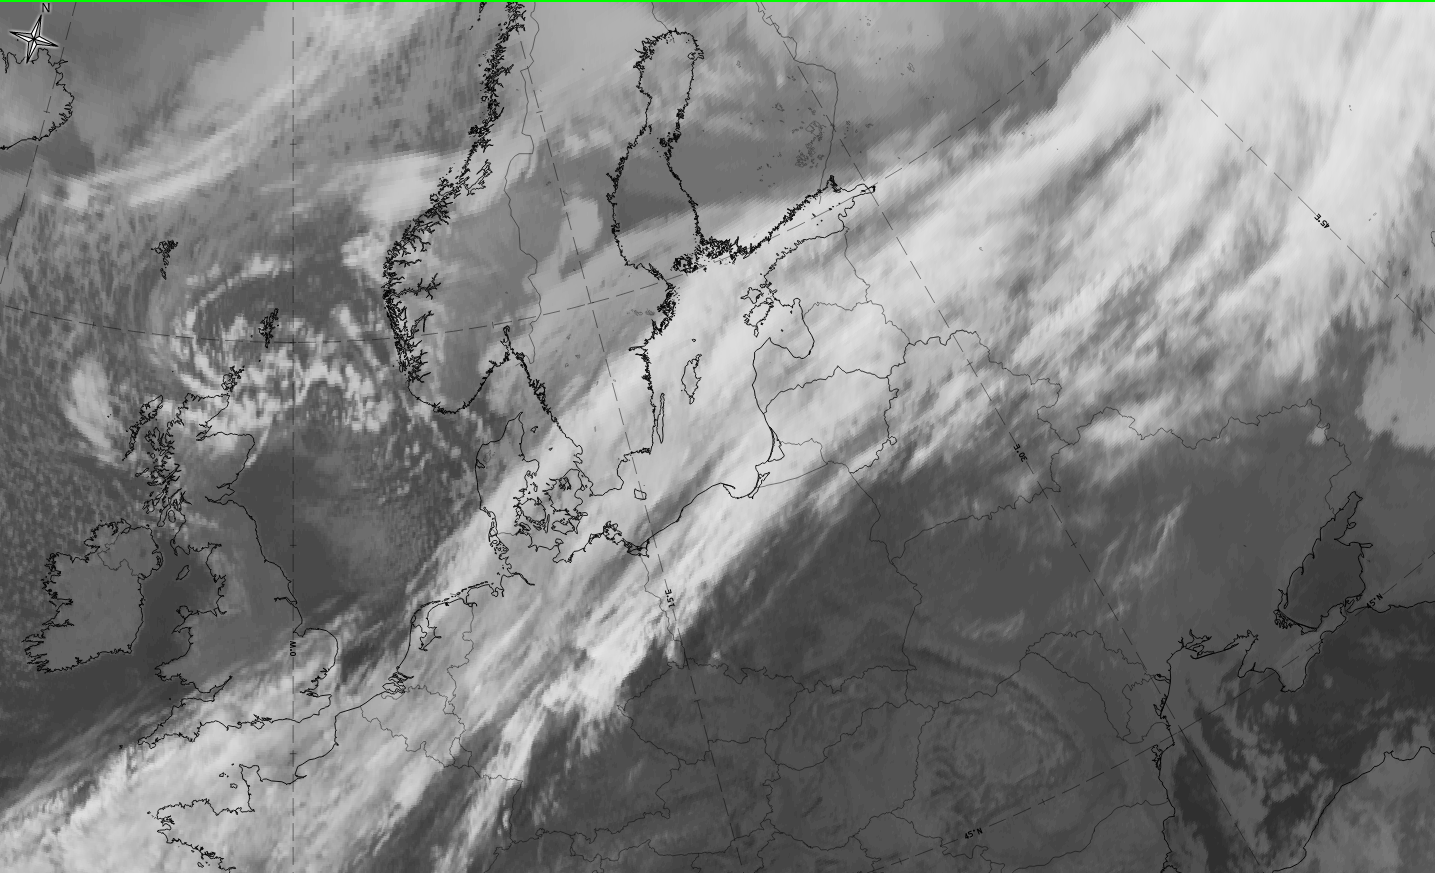
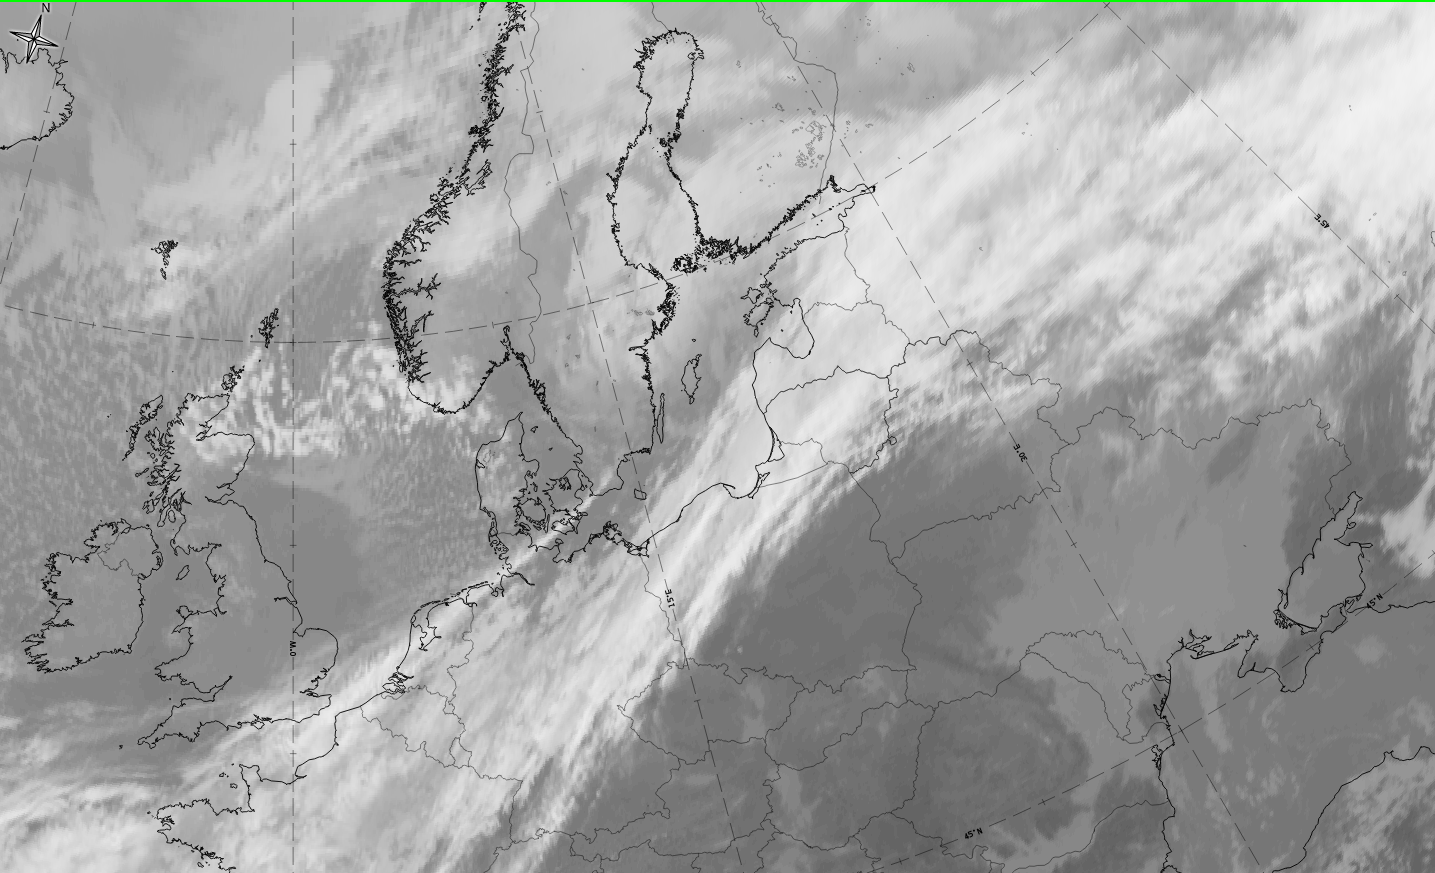
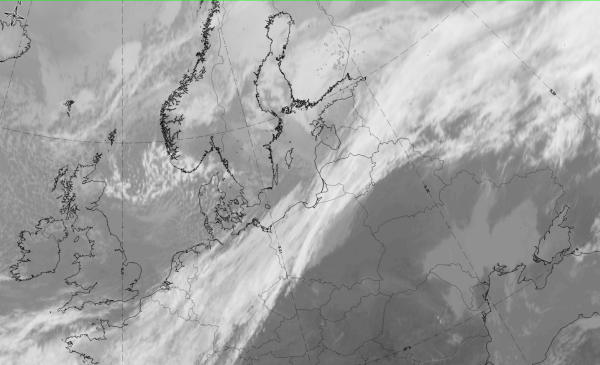
The case from 27 October 2019 shows the development from a wave at the CF - WF cloud system to a ccb spiral from South-Sweden, eastward to Finland and Russia. The IR image clearly shows the lower (greyer) cloud tops of the ccb spiral compared to the higher (whiter) cloud-top heights of the CF-WF band.
 |
 |
 |
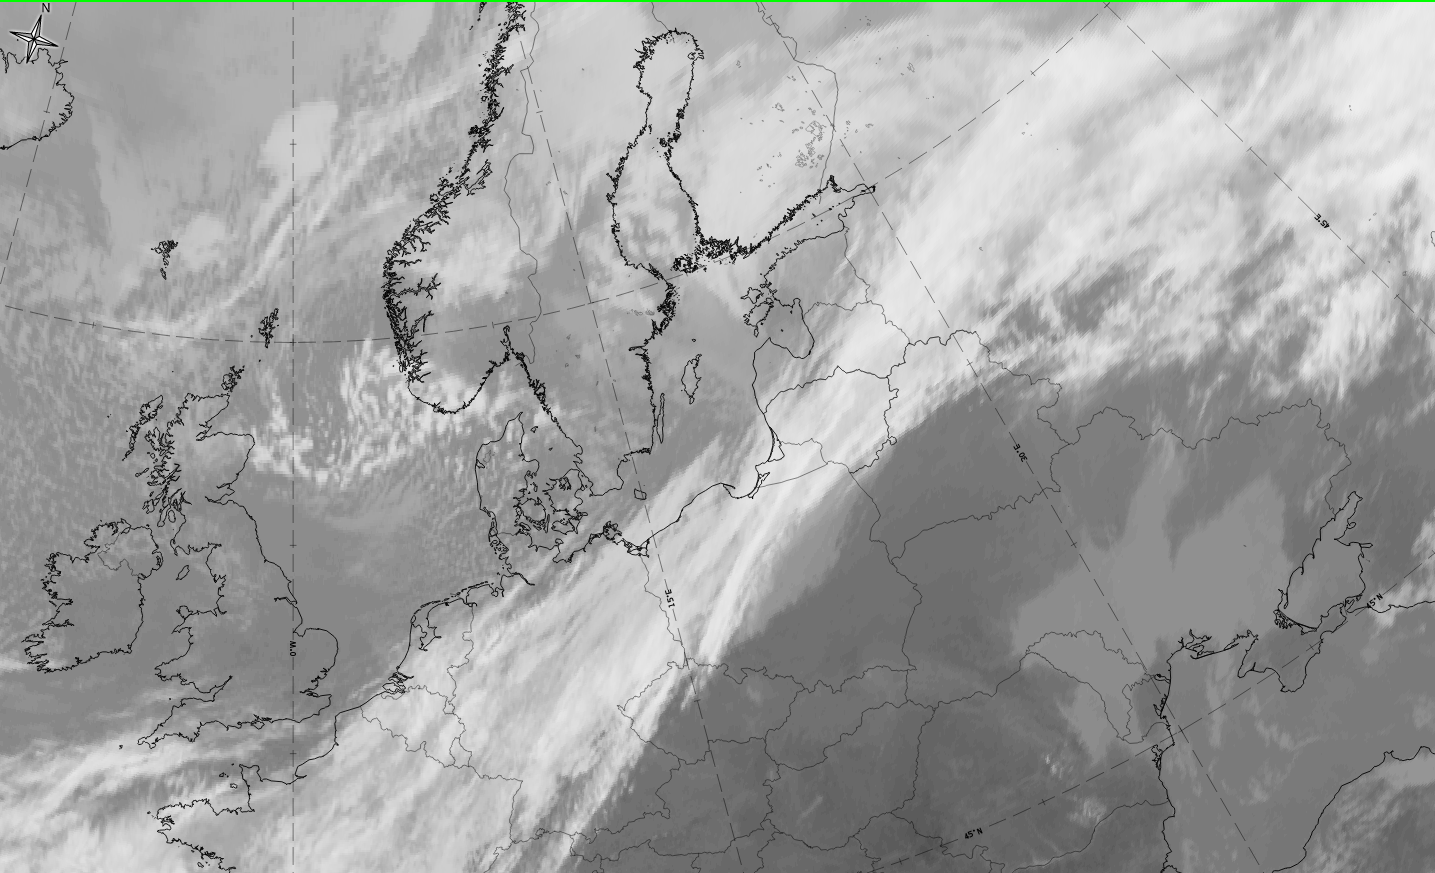 |
Legend: 27 October 2019; IR; u.l.:03 UTC; u.r.: 06 UTC; l.l.: 09UTC; l.r.: 12 UTC.
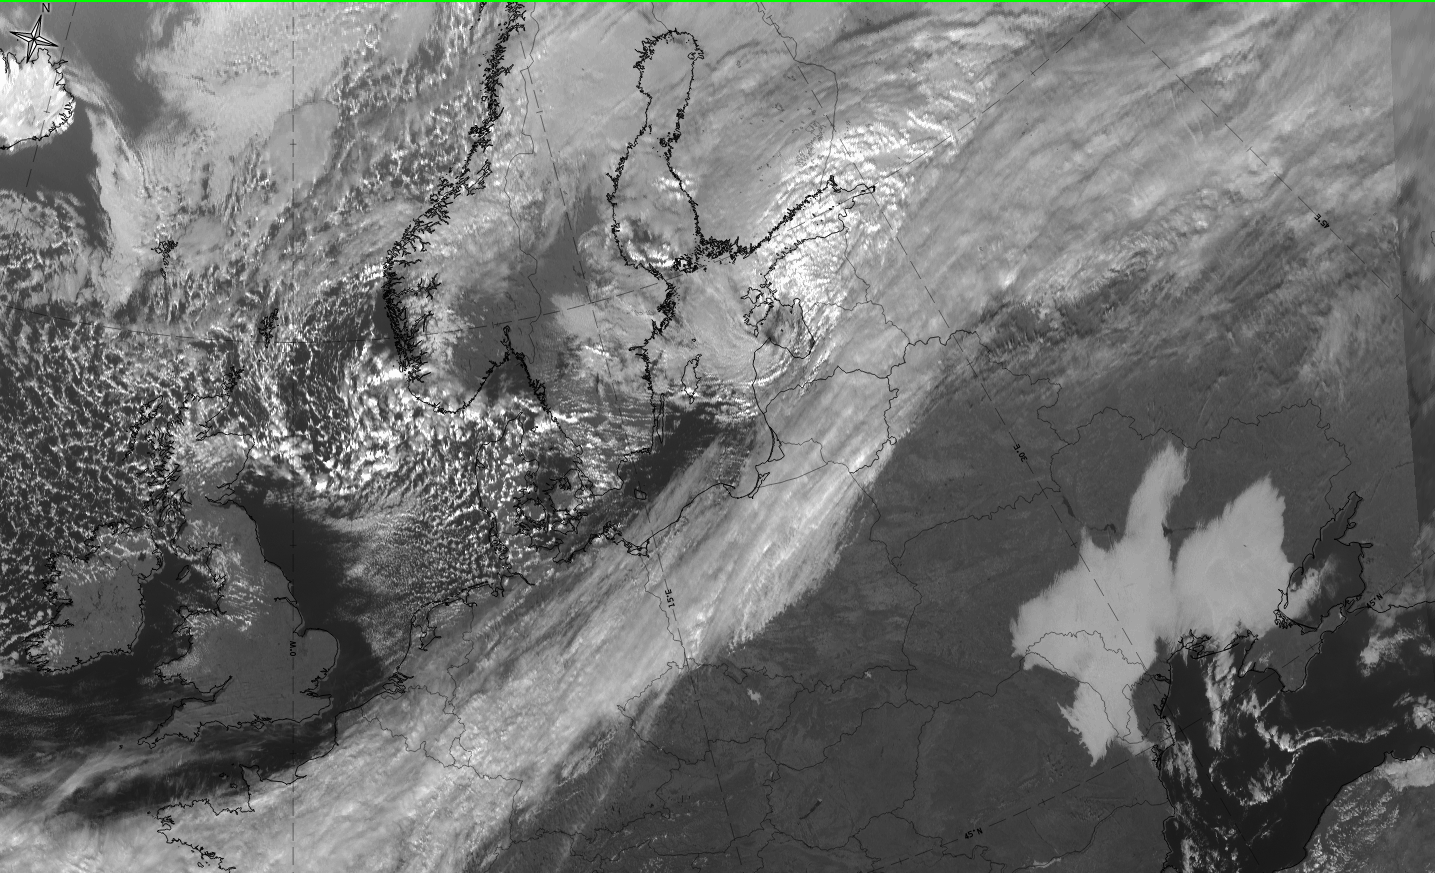
The fully developed stage of the ccb occlusion is presented here in all basic channels and also basic RGBs for 27 October 2019 at 12 UTC.
|
|
|
|
27 October2019, 12UTC: 1st row: IR (above) + HRV (below); 2nd row: WV (above) + Airmass RGB (below); 3rd row: Dust RGB + image gallery.
*Note: click on the Dust RGB image to access image gallery (navigate using arrows on keyboard)
| IR | Much greyer than the white CF-WF cloud band; brighter in the direction of the spiral tip to the Southwest. |
| HRV | Grey colours at this time of the year and at this high latitude; bright white colour in the inside of the spiral where solar illumination is better. |
| WV | Differentiation of grey shades between CF-WF band and ccb occlusion spiral is particularly distinct. |
| Airmass RGB | Dark brown stripe from the northeast, and along the rearward edge of the CF-WF band representing sinking, very dry air; it overflows the ccb occlusion spiral totally leading to red-brown colours there. |
| Dust RGB | Ochre colours of the ccb occlusion spiral clearly inside the CF-WF band and more and more dark-red colours further west and southwest of the cloud spiral. |