Rapid Development - Cross sections
|
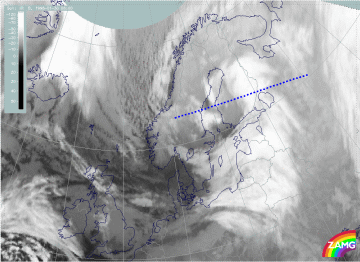
30 January 1998/06.00 UTC - Meteosat IR image; position of vertical cross section indicated
|
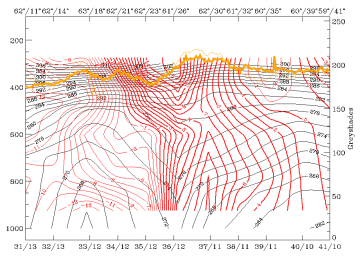
30 January 1998/06.00 UTC - Vertical cross section; black: isentropes (ThetaE), red thin: temperature advection - CA, red thick:
temperature advection - WA, orange thin: IR pixel values, orange thick: WV pixel values
|
|
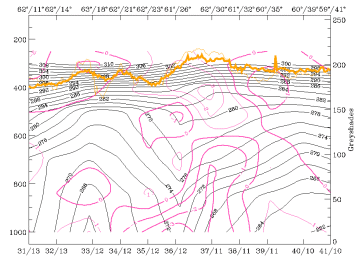
30 January 1998/06.00 UTC - Vertical cross section; black: isentropes (ThetaE), magenta thin: divergence, magenta thick: convergence,
orange thin: IR pixel values, orange thick: WV pixel values
|
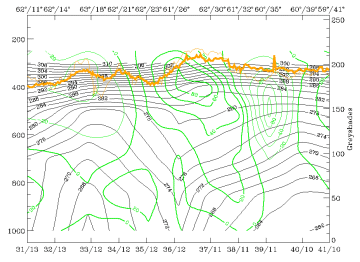
30 January 1998/06.00 UTC - Vertical cross section; black: isentropes (ThetaE), green thick: vorticity advection - PVA, green thin:
vorticity advection - NVA, orange thin: IR pixel values, orange thick: WV pixel values
|
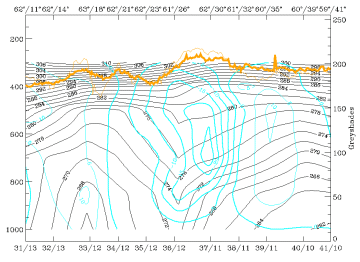
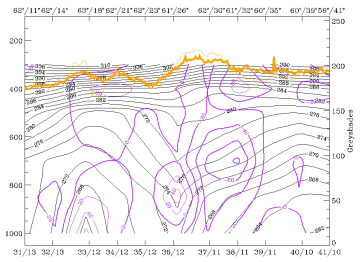
The vertical structure of the occluded front is seen best in the cross section at 06.00 UTC on 30 January (left image top). The cross section is taken perpendicular to the occluded front over Finland. Two peaks in IR can be discerned; around 63N/15E corresponding to the EC (Comma cloud) and between 62N/27E and 61N/31E corresponding to the Occlusion spiral over Finland. The huge pair of warm advection - cold advection (right image top) is a striking feature. The configuration of isentropes shows the typical trough pattern for the Occlusion between 800 and 500 hPa accompanied by intensive warm advection; some signs of a weak Warm Front zone to the east with upward inclined isolines can be noticed. They represent the classical configuration of upper-level Warm Front associated with occlusion.
A frontal zone of convergence (left image bottom) accompanies the lower part of the Occlusion and the Warm Front part. An increase of PVA (right image bottom) with height takes place within the Occlusion part; no PVA maximum is associated with the EC area. Intensive upward motion as a consequence of warm advection, convergence and PVA is concentrated around the Occlusion. There also seems to be sinking motion (left image below) in the area of cold advection to the west as well as to the east. In reality the sinking motion in the west is not exactly true: there was clearly convective precipitation connected to the EC cloudiness, as verified by radar (compare Diagnosis of precipitation patterns with help of relative streams and NORDRAD radar composites).
|
30 January 1998/06.00 UTC - Vertical cross section; black: isentropes (ThetaE), cyan thick: vertical motion (omega) - upward motion,
cyan thin: vertical motion (omega) - downward motion, orange thin: IR pixel values, orange thick: WV pixel values
|
30 January 1998/06.00 UTC - Vertical cross section; black: isentropes (ThetaE), lilac: Q-Vector (normal component), orange thin: IR
pixel values, orange thick: WV pixel values
|
As usual the frontogenesis (right image top) can be found in the frontal part at the boundary of the Occlusion; in this case it is bound to the Warm Front part. There is also clearly low-level frontogenesis taking place in the westernmost part of the cross section. Its location is apparently separate from the Cold Front located farther south.
