Diagnosis of frontal parameters
|
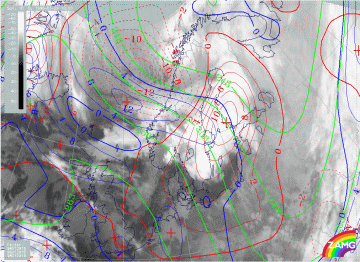
29 January 1998/18.00 UTC - Meteosat IR image; blue: thermal front parameter (TFP) 500/850 hPa, green: equivalent thickness 500/850
hPa, red: temperature advection 1000 hPa
|
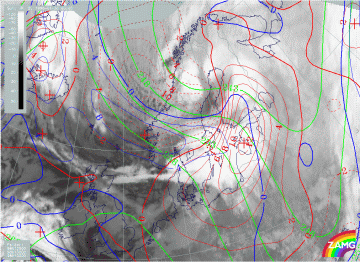
30 January 1998/00.00 UTC - Meteosat IR image; blue: thermal front parameter (TFP) 500/850 hPa, green: equivalent thickness 500/850
hPa, red: temperature advection 1000 hPa
|
|
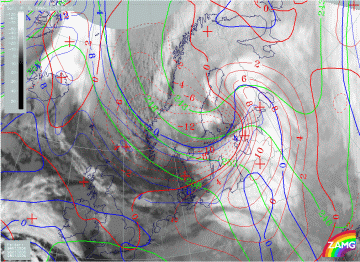
30 January 1998/06.00 UTC - Meteosat IR image; blue: thermal front parameter (TFP) 500/850 hPa, green: equivalent thickness 500/850
hPa, red: temperature advection 1000 hPa
|
|
The temperature advection pattern becomes very intensive during the stage of the most Rapid Cyclogenesis. Warm advection over Finland with a distinct cloudiness shield increases in the early hours of 30 January. A distinct Warm Front does not, however, exist. On the contrary the Cold Front is well developed over the Norwegian Sea within an area of cold advection. The front marks the boundary between the original arctic and polar air masses. The arctic air mass has gone through a lot of transformation due to its long journey over a relatively warm ocean. The difference between the air masses is, however, clearly identifiable even in geostationary satellite IR images, where extensive convection and convective lines oriented parallel to the thermal wind/thickness isolines at the rear of Cold Front are evident, while ahead of the front the convection seems to be absent.
Towards 06.00 UTC on 30 January (left image bottom) the typical appearance of an Occlusion is very clear: TFP associated with thickness ridge and associated warm advection beneath mark the location of the Occlusion. A lot of EC cloudiness (with also the aforementioned Comma cloud) is seen in the area of the thickness trough.


