Key Parameters
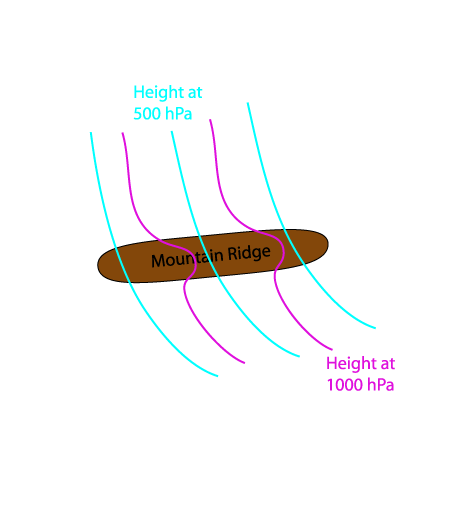
- Height contours at 1000 and 500 hPa:
- Shows a characteristic flat short wave feature across the mountain ridge. This feature is developed according to the pressure gradient and the confluence/convergence at surface levels on the windward side of the mountain chain.
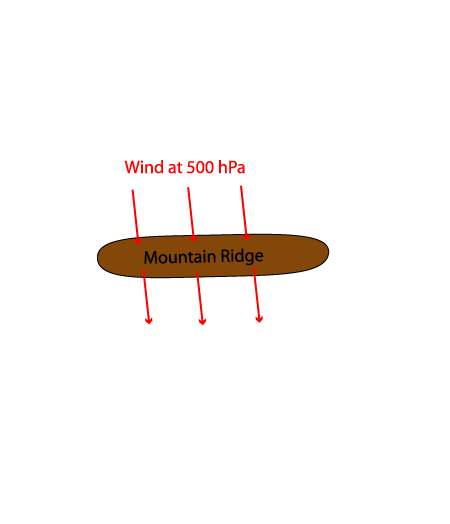
- Strong flow across the mountain chain at upper levels
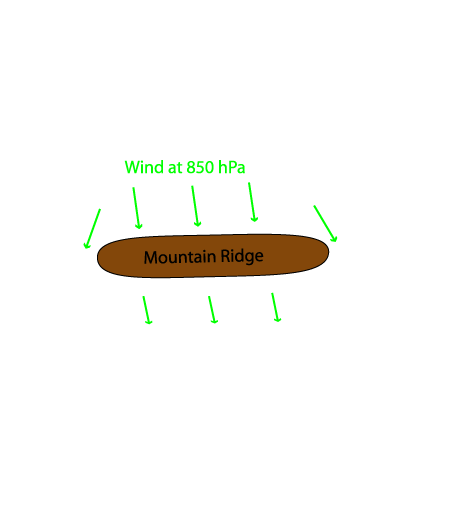
- Wind fields at 500 hPa:
- Winds at upper levels not influenced by the mountain barrier with an undisturbed flow across over the mountain chain
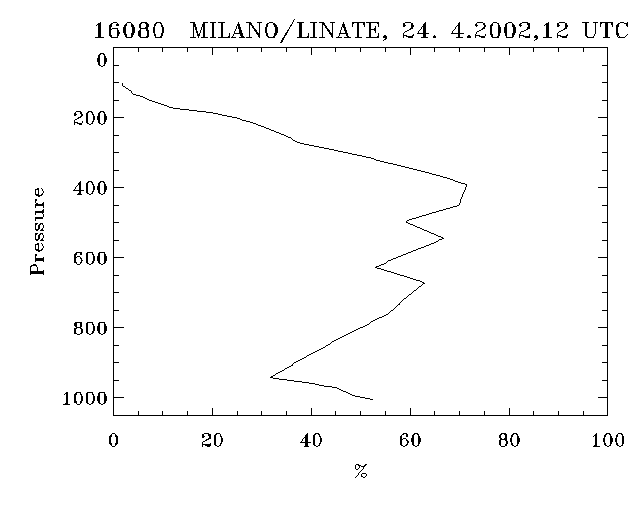
- Radio Soundings - Humidity:
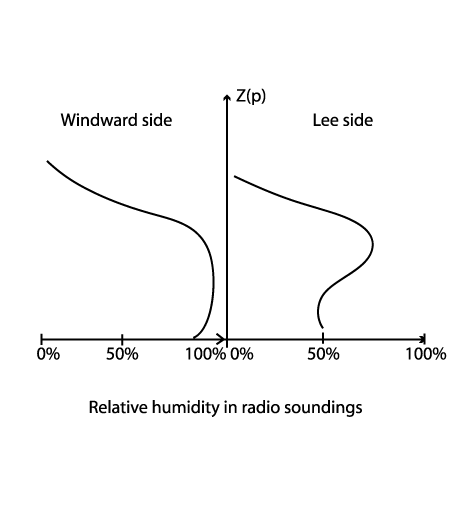
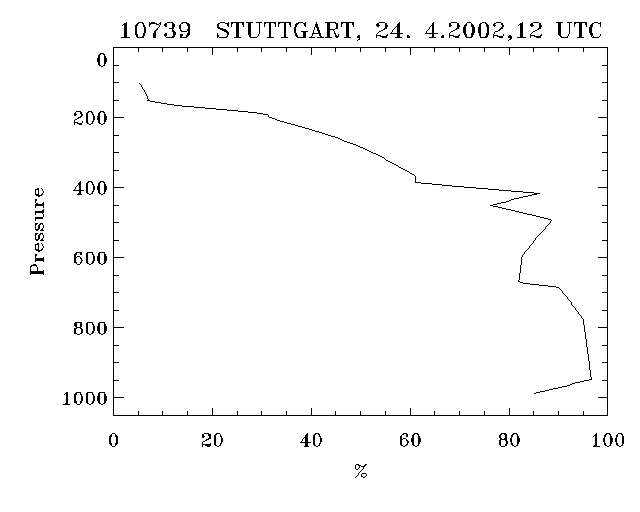
- Radio Soundings on the windward side show a thick wet layer at low levels nearly up to the height of mountain crest.
- On the lee side of the mountain ridge they show a dry layer from the surface up to middle levels and a wet layer in middle layers.
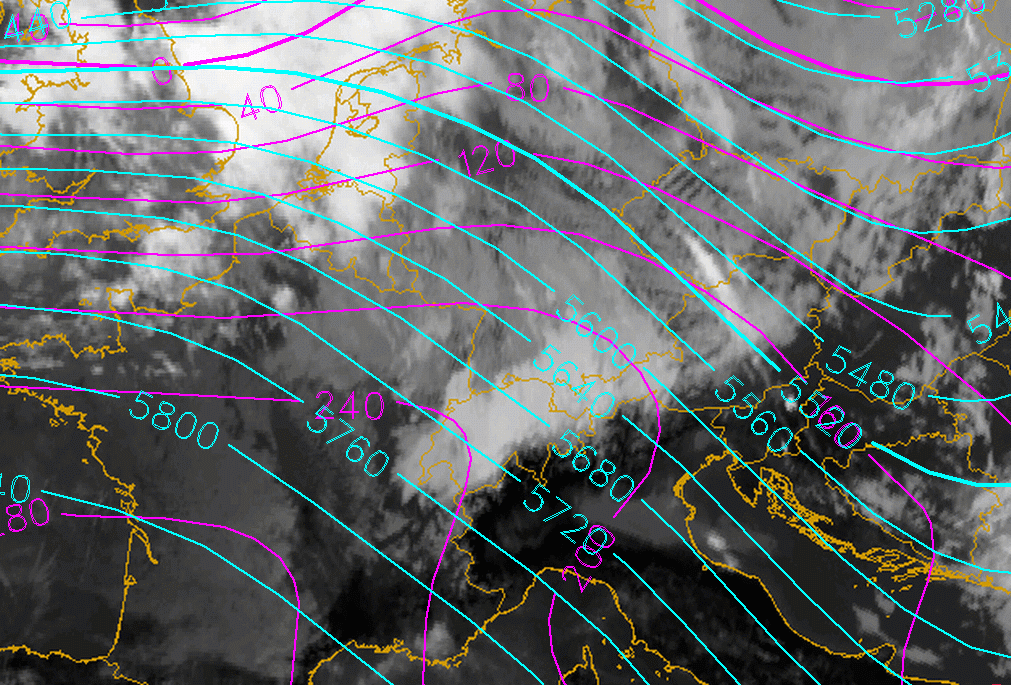
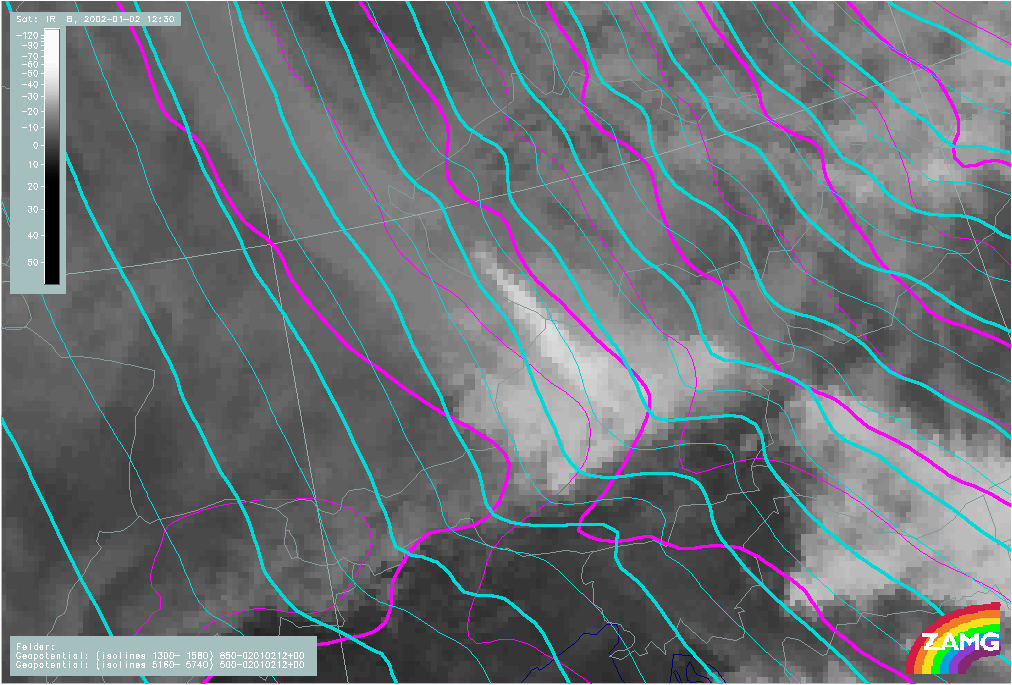
Height contours at 1000 and 500 hPa
|
|
12 January 2007/12.00 UTC - Meteosat 8 IR10.8 image; cyan: height contours 500 hPa, magenta: height contours 1000 hPa
|
|
|
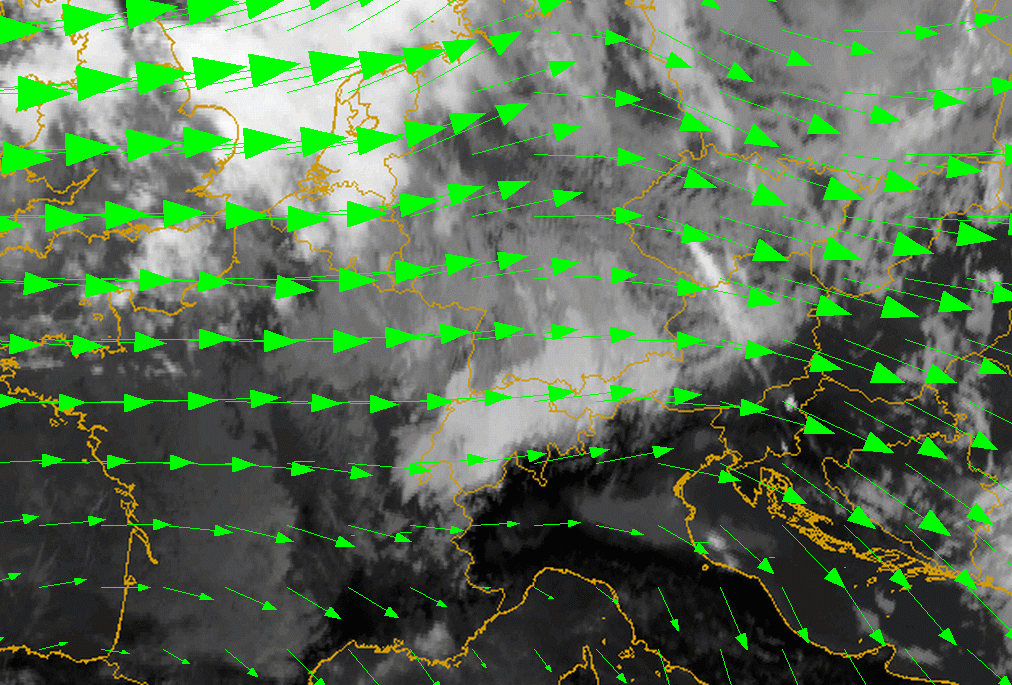
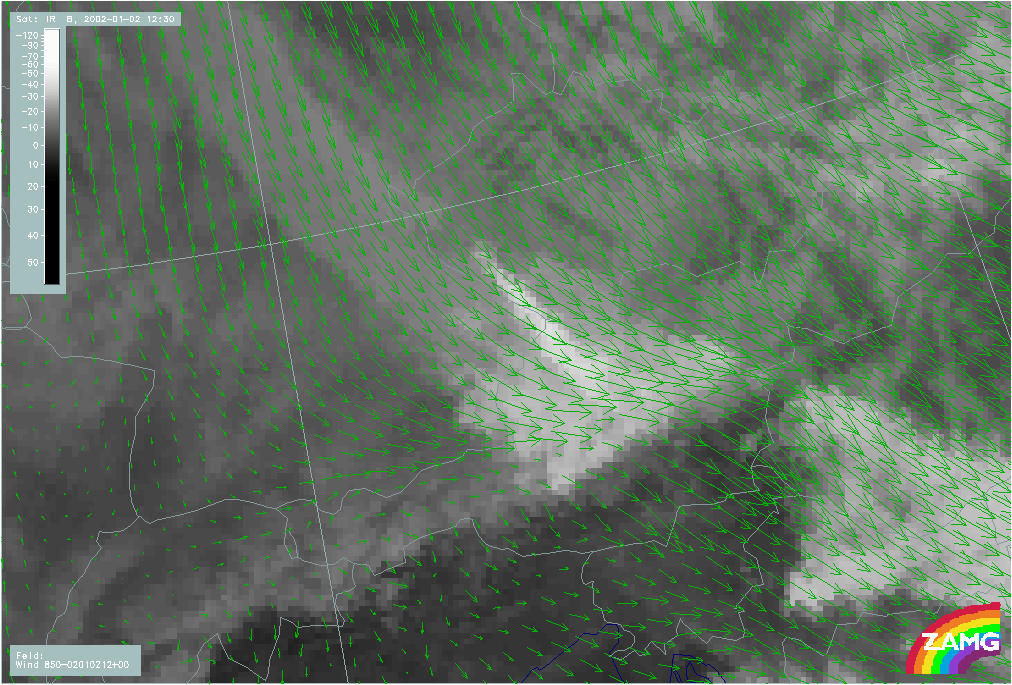
Wind fields at 850 hPa
|
|
12 January 2007/12.00 UTC - Meteosat 8 IR10.8 image; green: wind vectors 850 hPa
|
|
|
The area of the flow splitting over France and the W. Alps is well indicated.
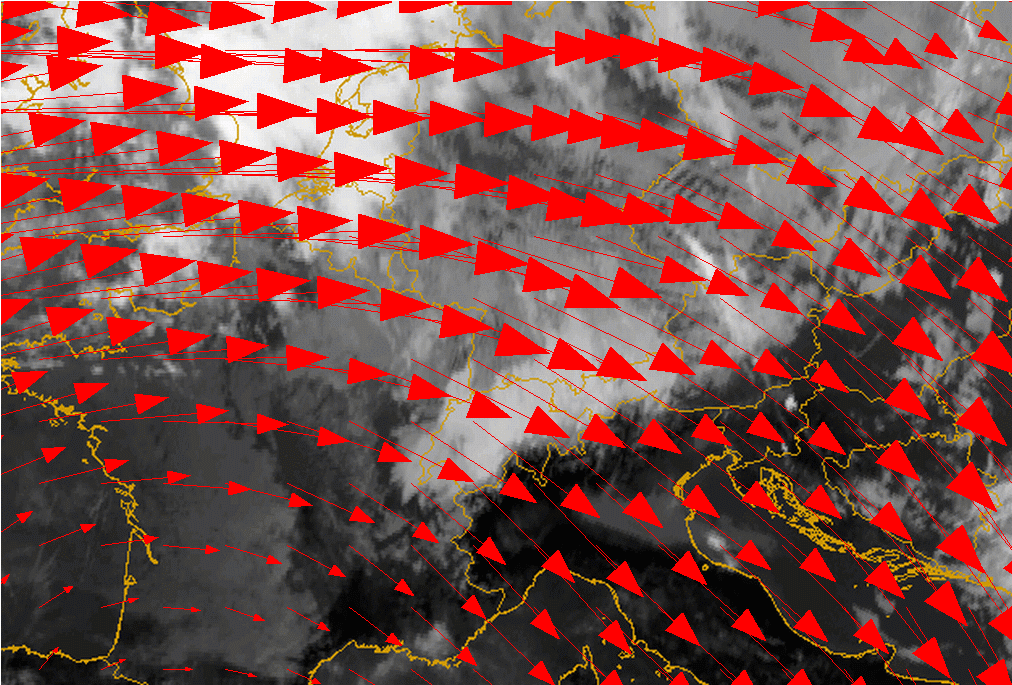
Wind fields at 500 hPa
|
|
12 January 2007/12.00 UTC - Meteosat 8 IR10.8 image; red: wind vectors 500 hPa
|
|
|
Radio Soundings - Humidity
|
|
|
|
|
|
|
|
24 April 2002/12.00 UTC - Radio Sounding Stuttgart 10739; black solid: relative humidity; Windward side
|
24 April 2002/12.00 UTC - Radio Sounding Milano 16080; black solid: relative humidity; Lee side
|
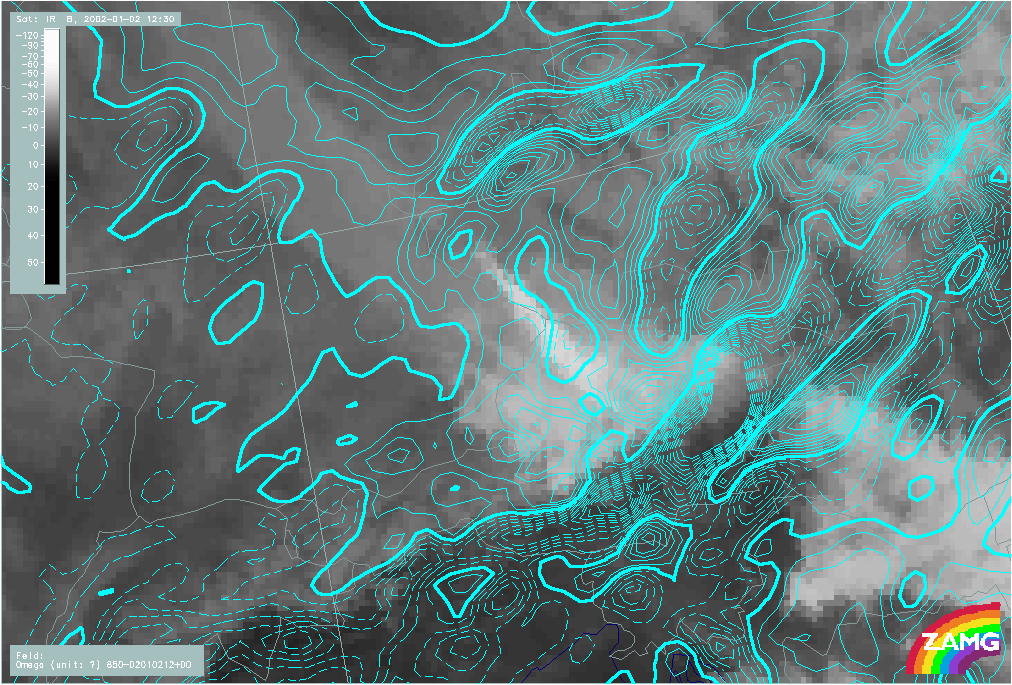
Meso-scale key parameters
Since LAM model fields are computed with a higher spatial resolution (about 15 km horizontal Grid for the ALADIN model) than ECMWF model fields (average distance between grid points is about 39km), the mesoscale dynamics of the Barrage Cloud are much better modelled. This is especially true for divergence and vertical motion. Other relevant parameters also show more detail and are more representative of the CM when taken at higher spatial resolution.
- Height contours at 1000 and 500 hPa:
- The 1000 hPa contours show a significant deformation across the mountains, and even at 500 hPa, there is a pressure gradient more to the lee side.
- Wind field at 850 hPa:
- The wind vectors at low levels show a strong convergence at the windward slopes of the mountain ridge.
- The flow around the mountain barrier is also much better indicated in the LAM model.
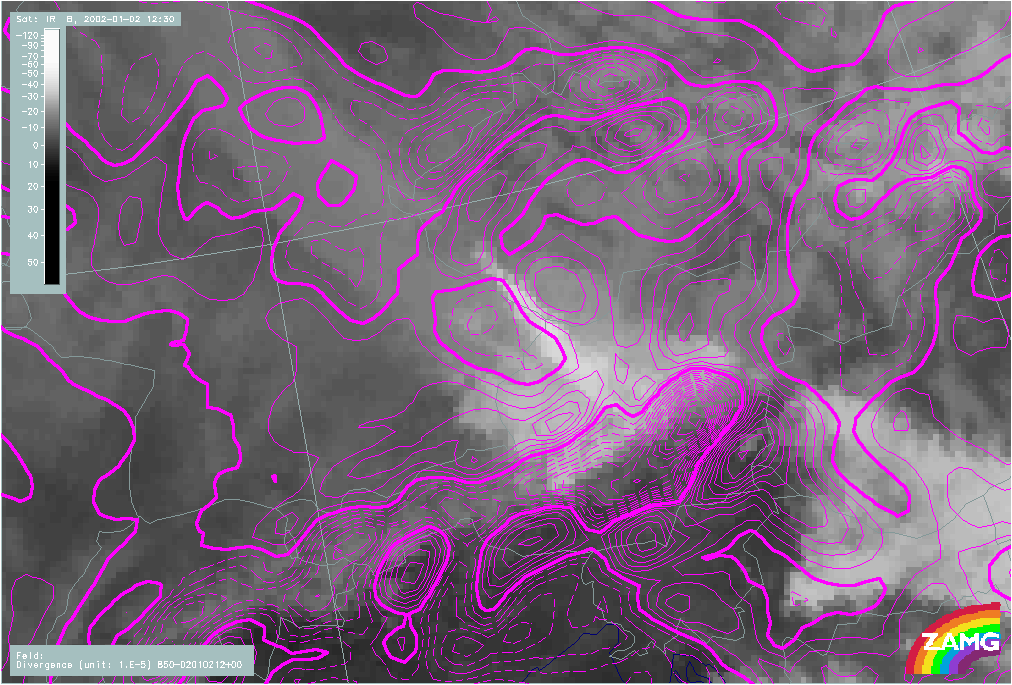
- Convergence at 850 hPa:
- Distinct maxima of convergence at low levels within the Barrage Cloud area. The flow splitting is caused by confluence to the left and right sides of the Barrage Cloud area.
- Vertical motion at 850 hPa:
- Strong indications of forced uplift within the Barrage Cloud area and down ward motion on the lee side of the ridge.
Height contours at 1000 and 500 hPa
|
|
02 January 2002/12.00 UTC - Meteosat IR image; ALADIN LACE: cyan: height contours 500 hPa, magenta: height contours 1000 hPa
|
|
Wind field at 850 hPa
|
|
02 January 2002/12.00 UTC - Meteosat IR image; ALADIN LACE: green: wind vectors 850 hPa
|
|
Convergence at 850 hPa
|
|
02 January 2002/12.00 UTC - Meteosat IR image; ALADIN LACE: magenta solid: convergence 850 hPa, magenta dashed: divergence 850 hPa
|
|
Vertical motion at 850 hPa
|
|
02 January 2002/12.00 UTC - Meteosat IR image; ALADIN LACE: cyan solid: upward motion 850 hPa, cyan dashed: downward motion 850 hPa
|
|