Weather Events
Weather events are described in detail in the relevant CMs "Wave" and "Warm Conveyor Belt Occlusion".
In this chapter, looking at weather events during a Polar Front type cyclogenesis, it is difficult to make clear distinctions between the four development stages, so no schematics are presented here except those below, taken from the individual CMs "Wave" and "Warm Conveyor Belt Occlusion".
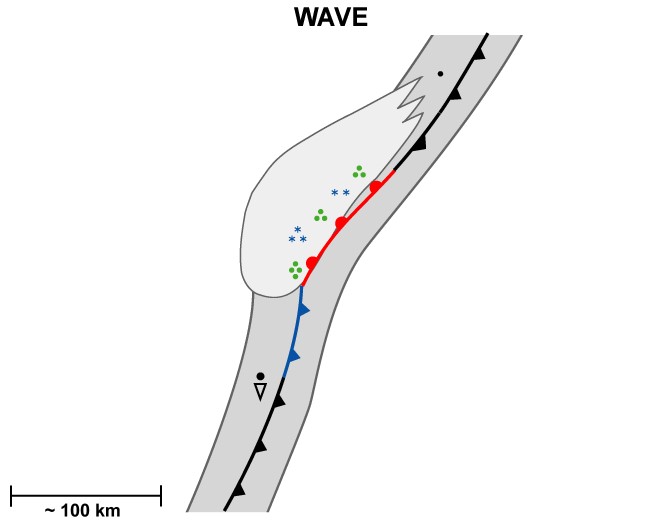
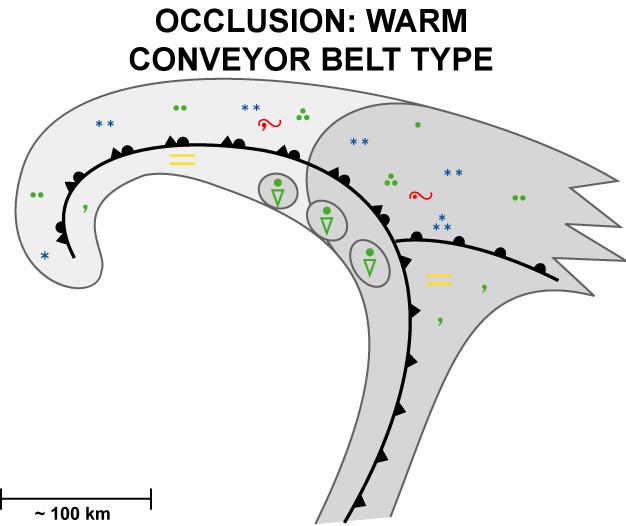
Legend:
Synoptic observations for: l.: wave stage; r.: mature stage
However, a few statements about weather events and their developments during the cyclogenesis process can be made:
- The whole cyclogenesis process and its cloud configurations are meteorologically very active, with intensive precipitation in both, non-showery and shower form; depending on the season, rain or snow is observed.
- Showery precipitation is mainly found in the areas of the cold front and the wave. The warm front is rather usually accompanied by non-showery precipitation.
- Generally, non-showery rain (or snow) appears more in the early phases, especially in the Wave stage, while showery precipitation appears more in the later occlusion stages around the occlusion point in the inner part of the cloud spiral.
- The rain intensity decreases markedly from the Mature stage to the Dissipation stage.
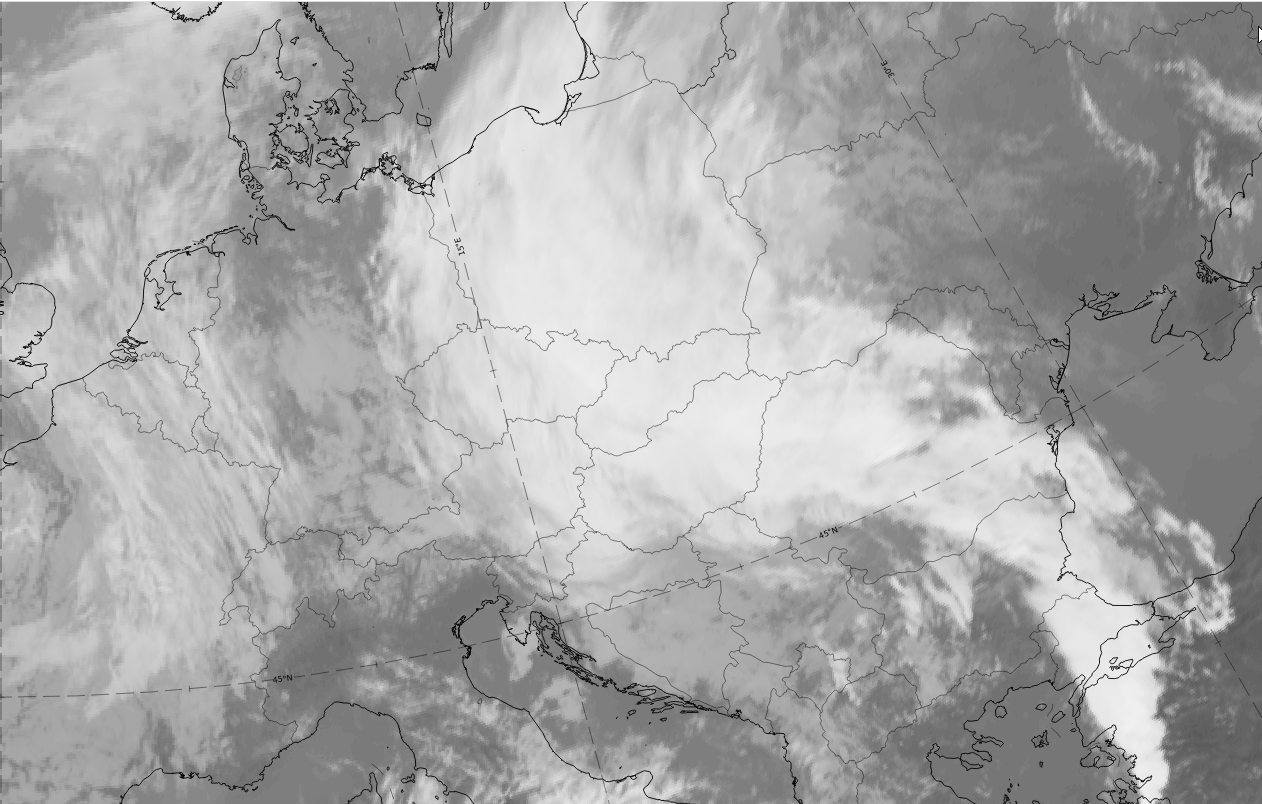
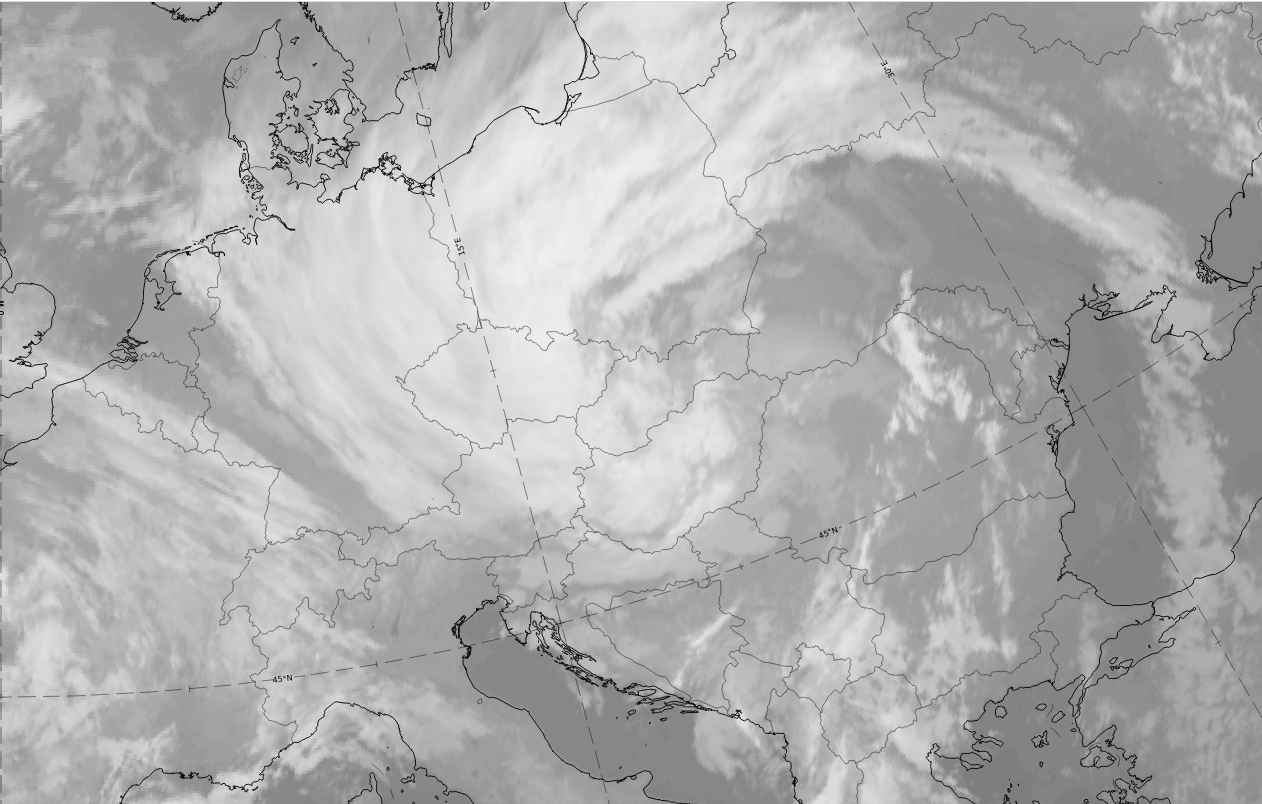
This is demonstrated here with a case from 13-14 October 2020.
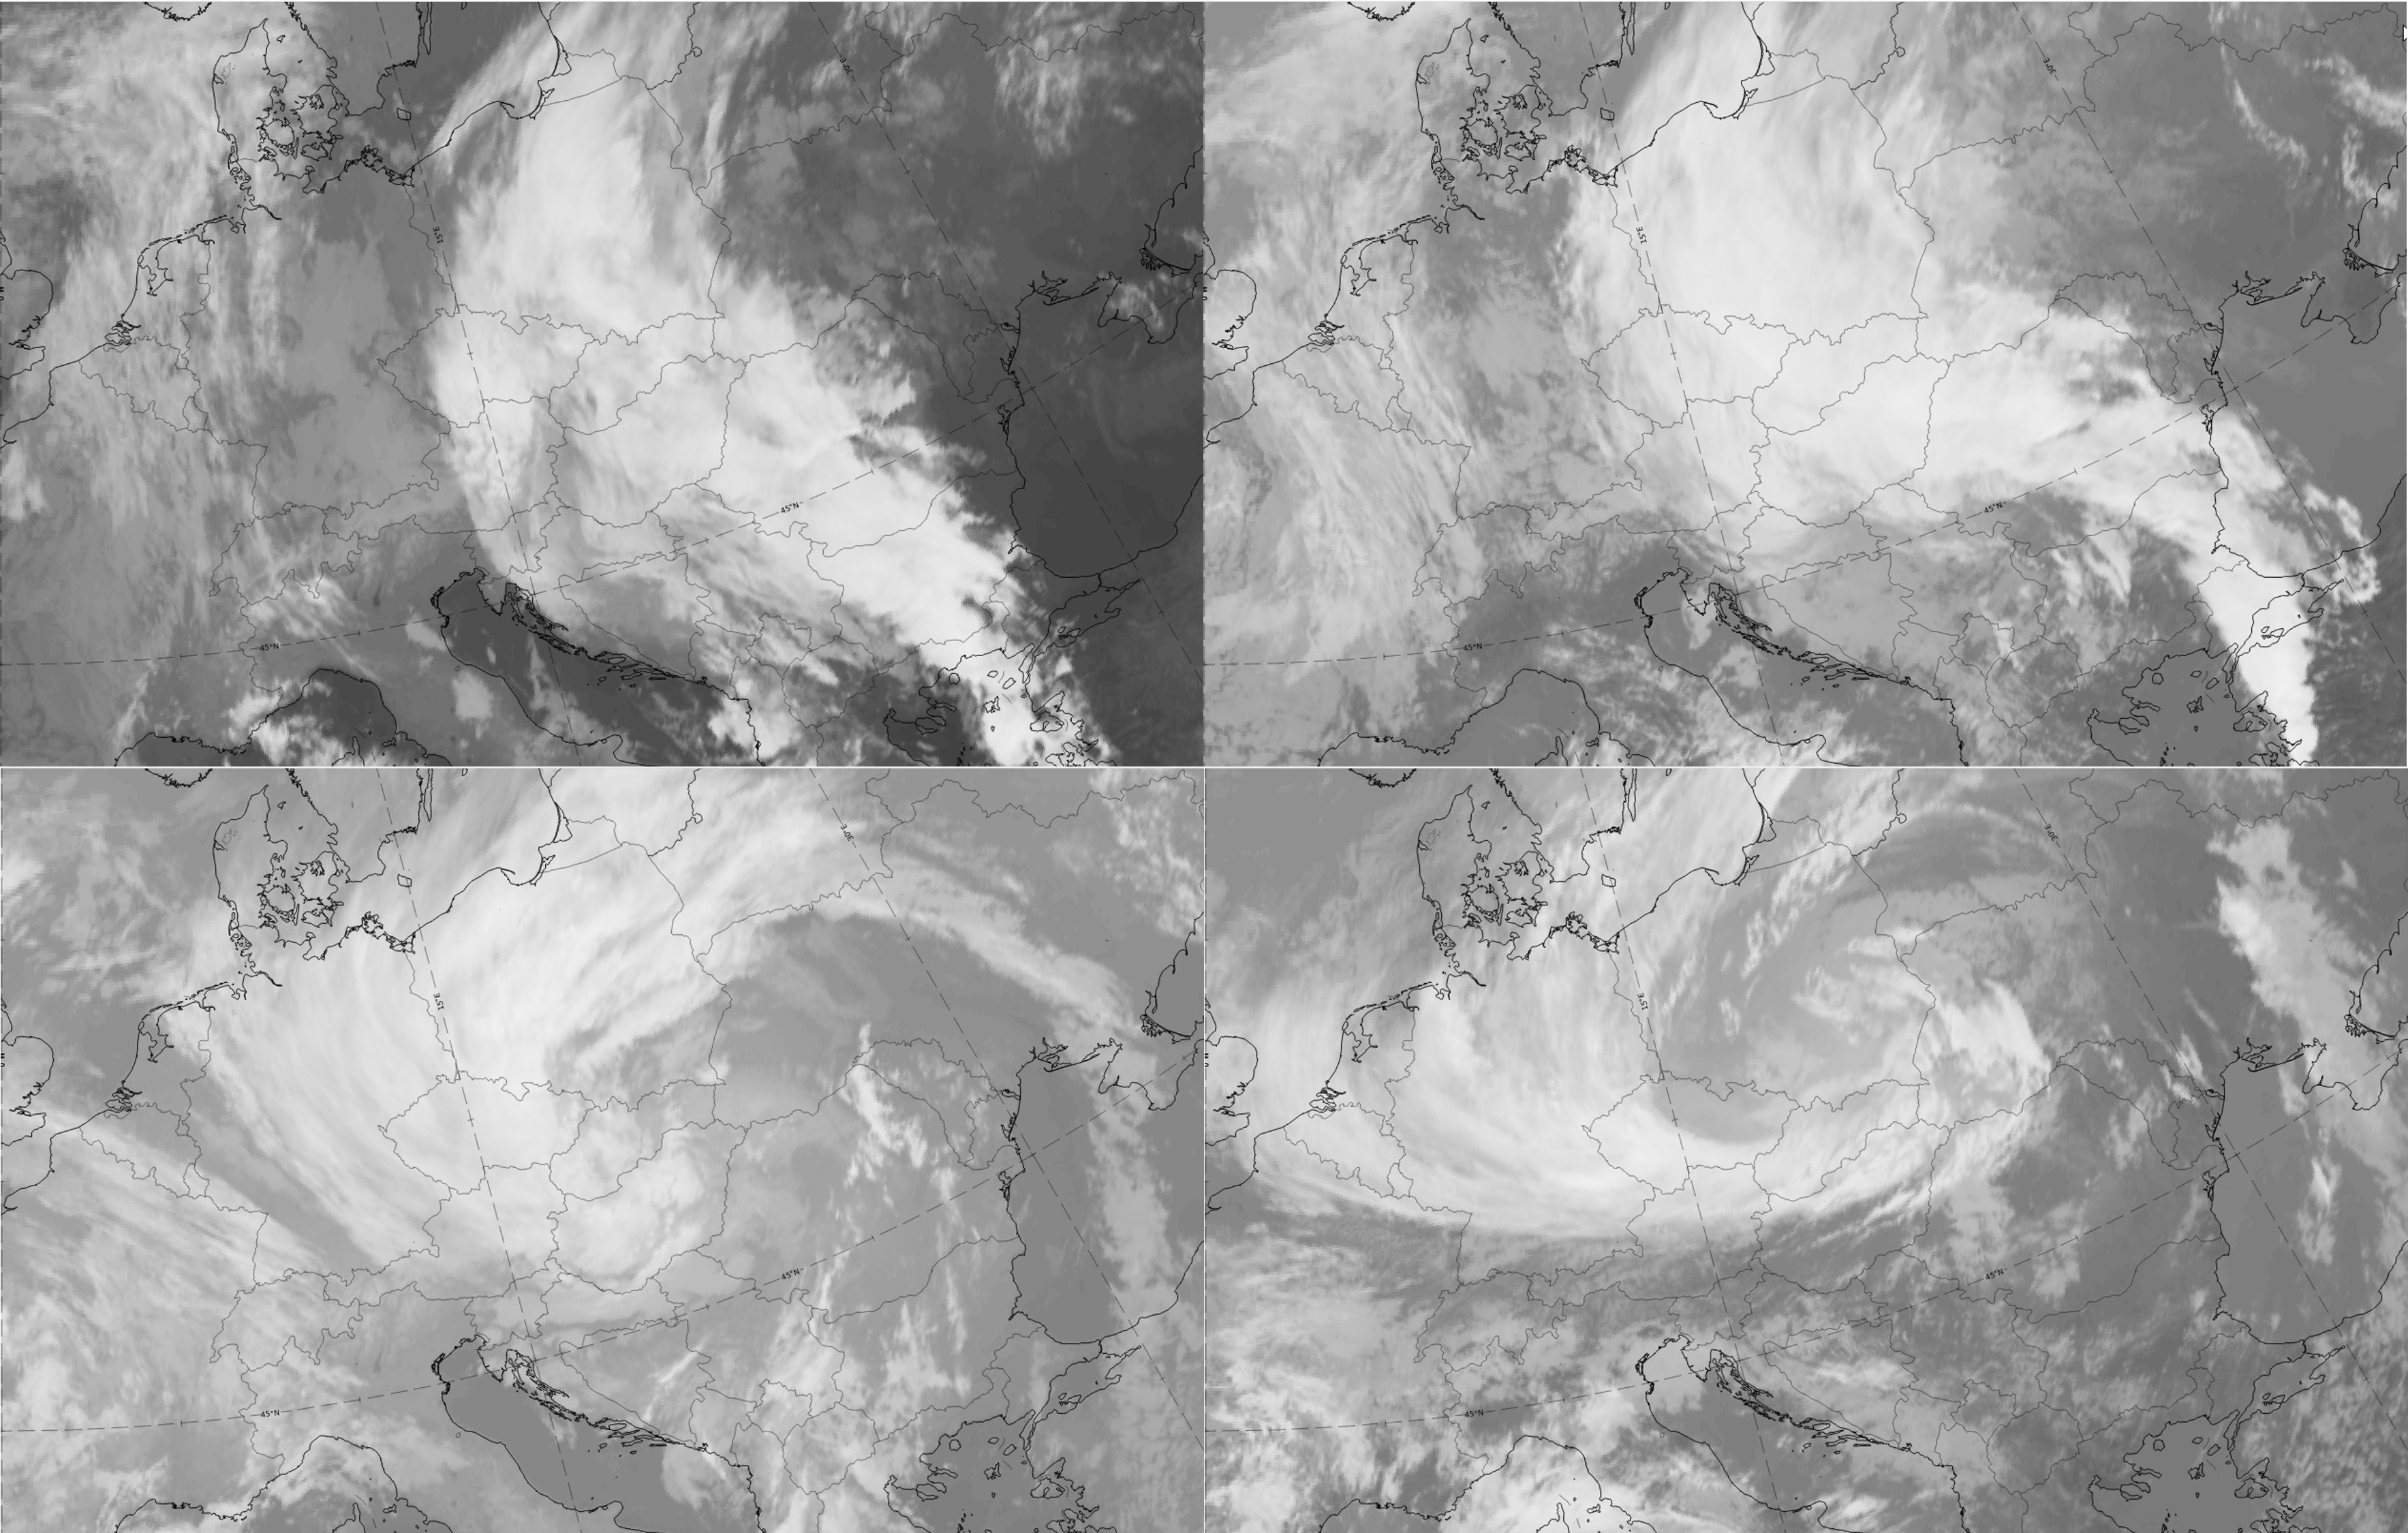
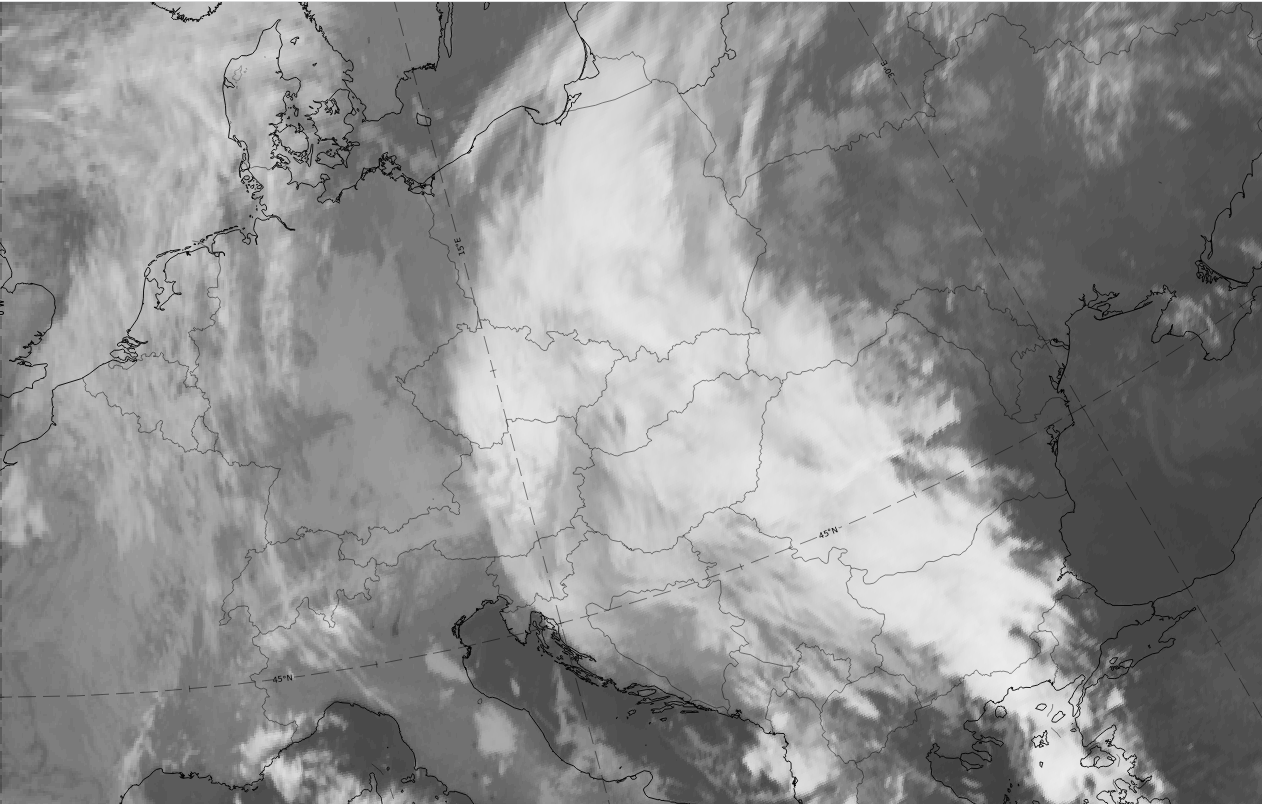
Legend: 13-14 October 2020, IR.
U.l.: 06 on 13 October 2020, Wave stage; u.r.: 12 UTC on 13 October 2020, Intensification stage; 00 UTC on 14 October 2020, Mature stage; 12 UTC on 14 October 2020, Dissipation stage.
Note: To enlarge the image, click on it.
Note: To access the gallery of individual images click here
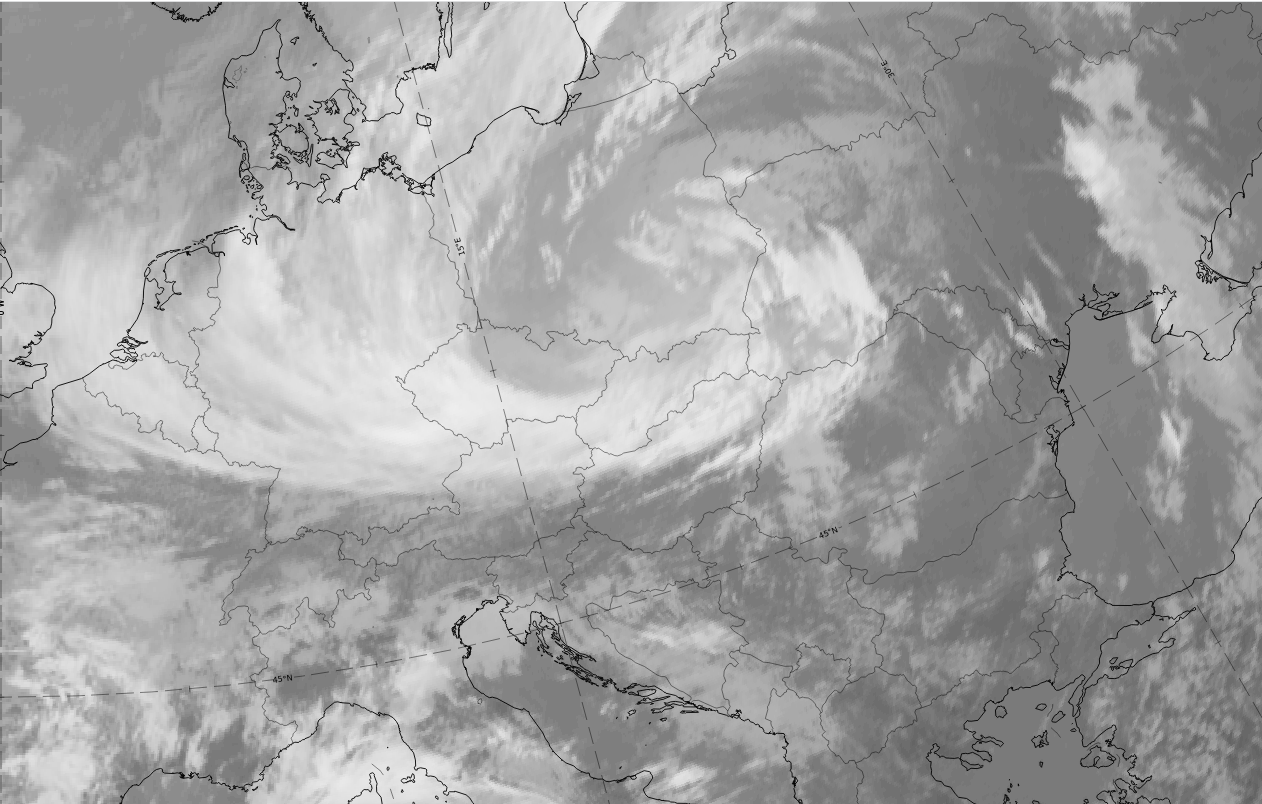
The cloud configurations in the four cyclogenesis stages are very typical of Polar-Front-type cyclogenesis. They show a distinct cloud bulge in the Wave stage, which intensifies to more pronounced S shape in the Intensification stage, a bright occlusion cloud spiral in the Mature stage and the typical narrowing of the occlusion cloud spiral with some cloud in the centre splitting off in the Dissipation stage.
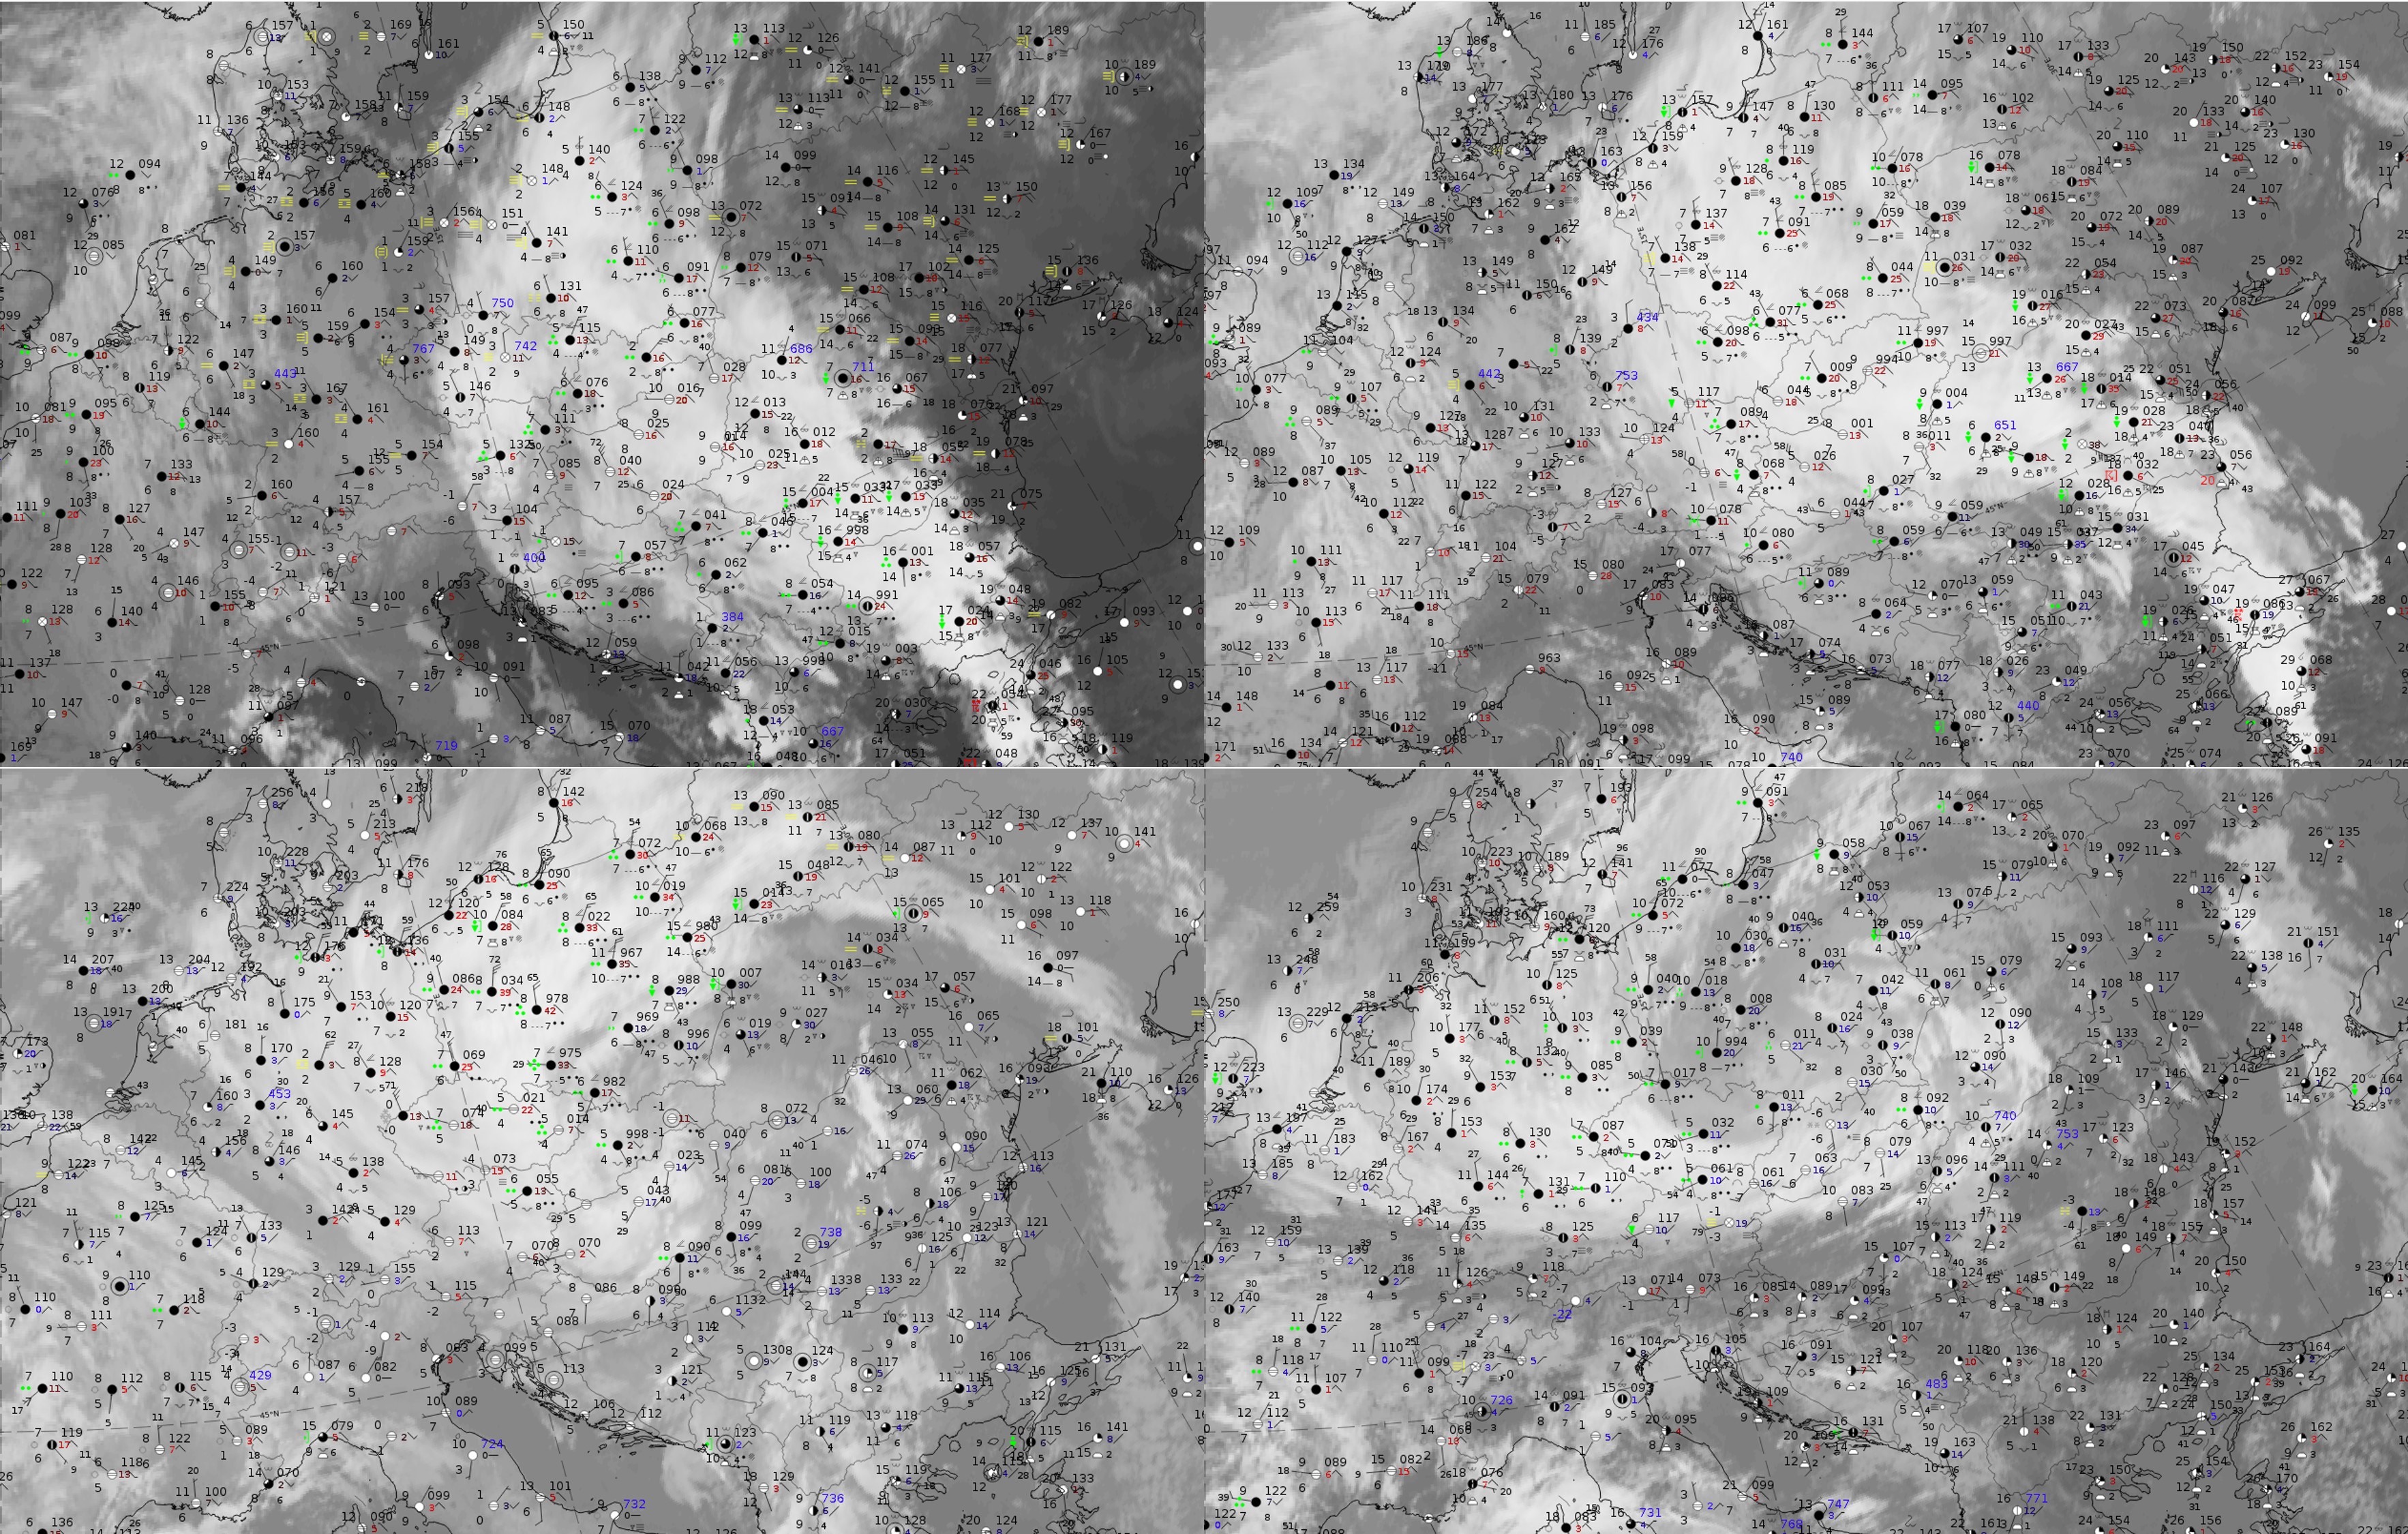
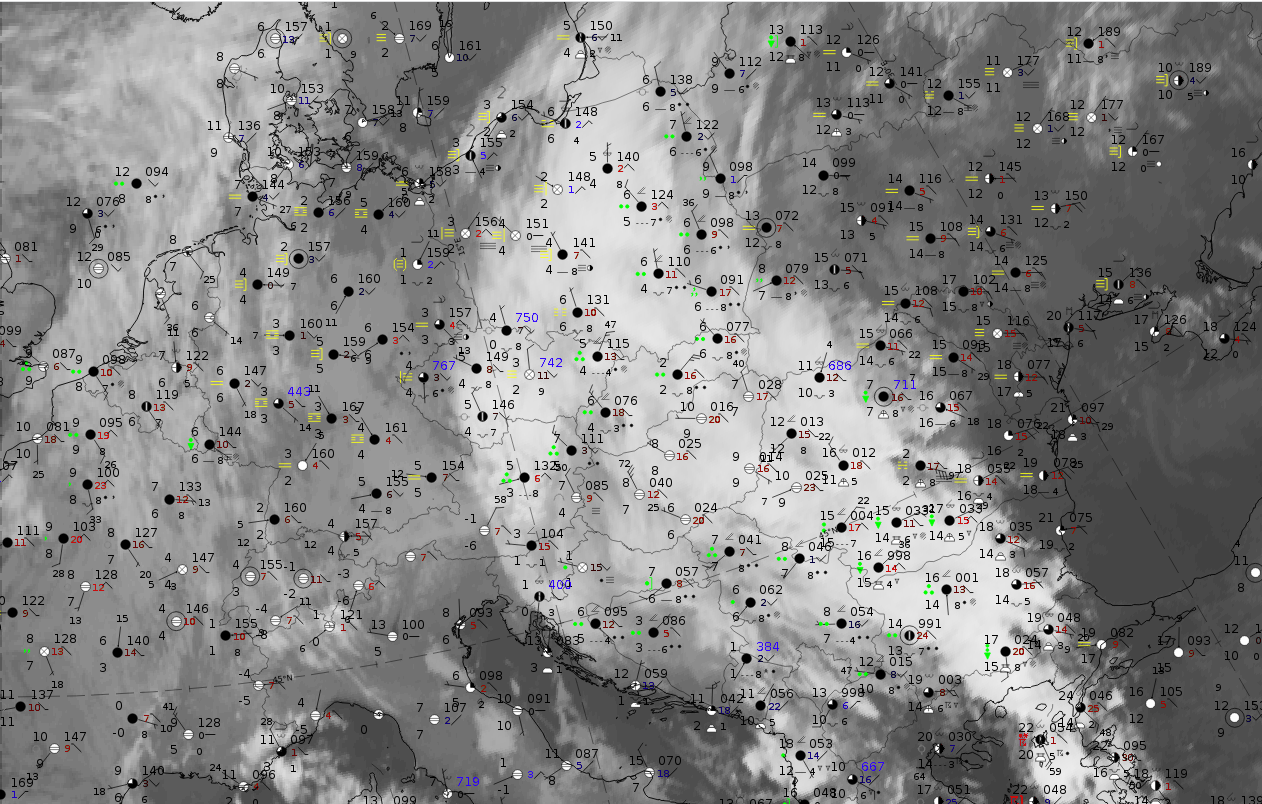
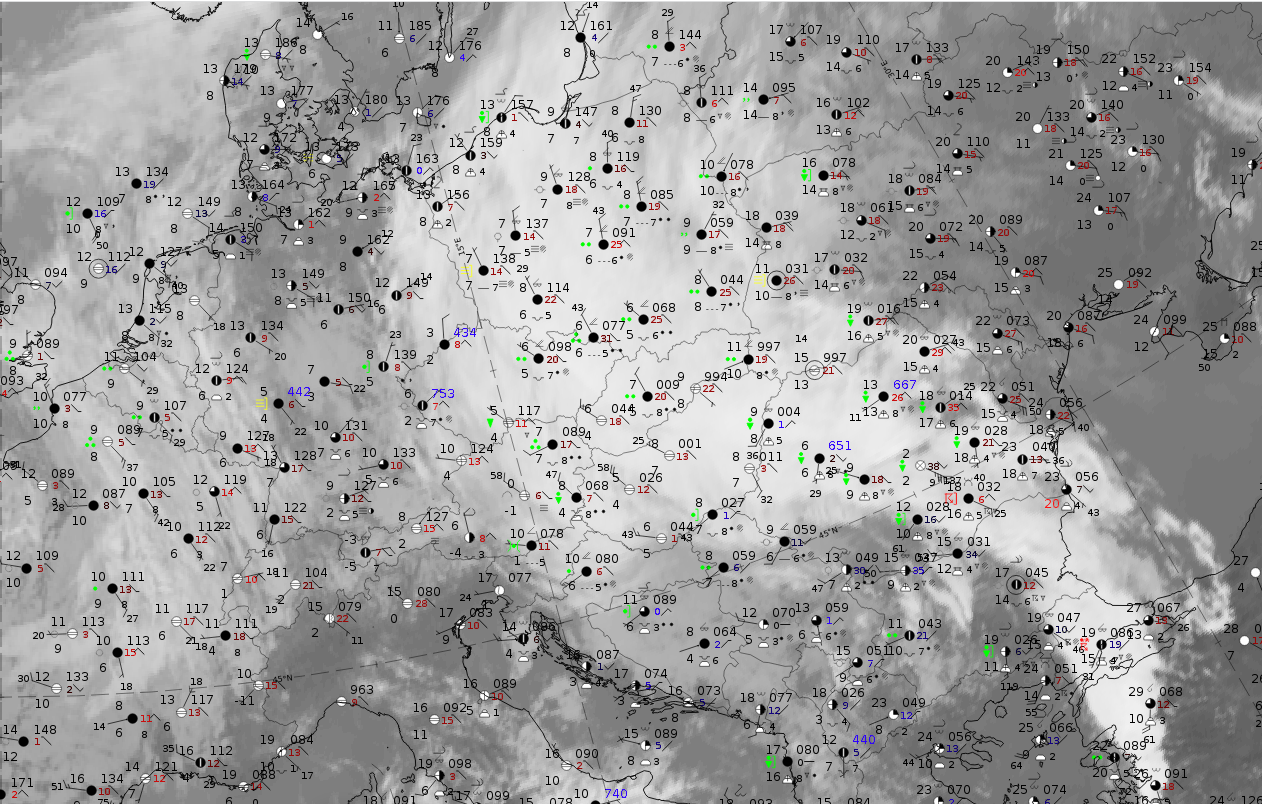
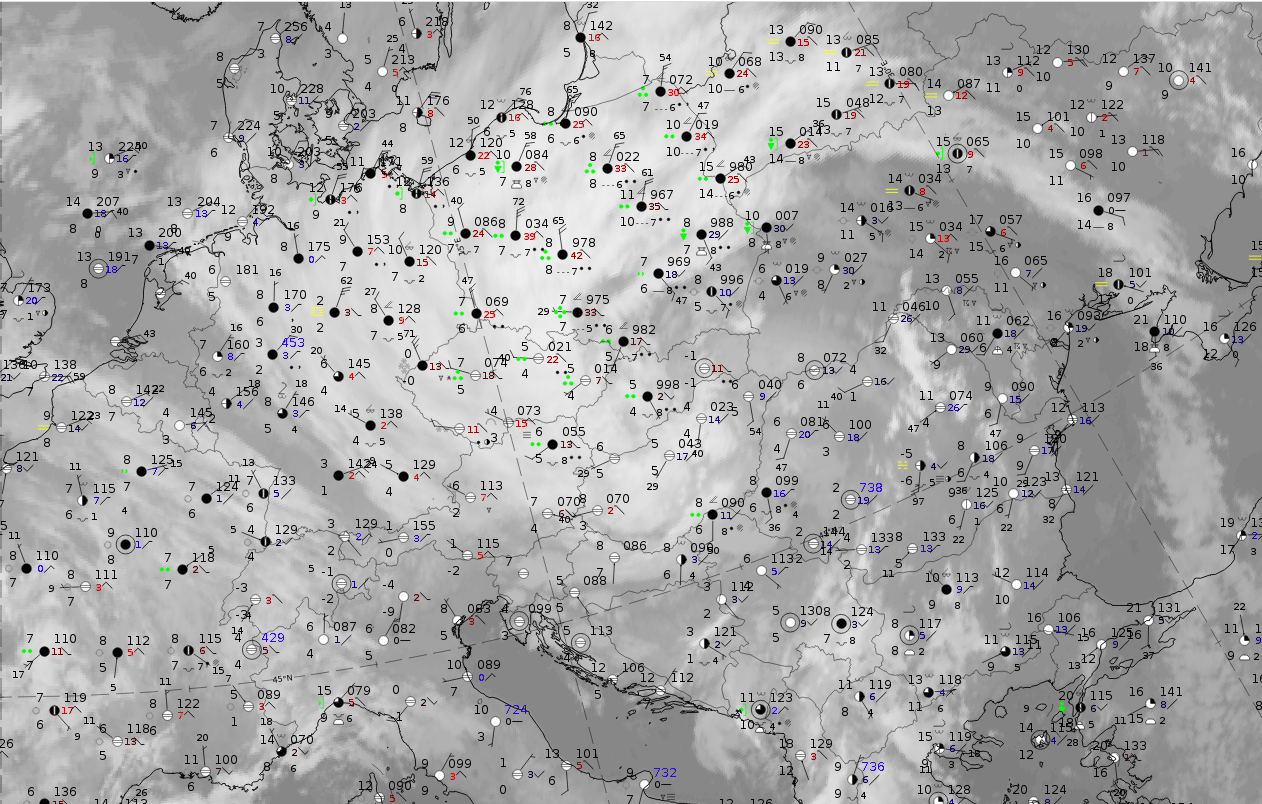
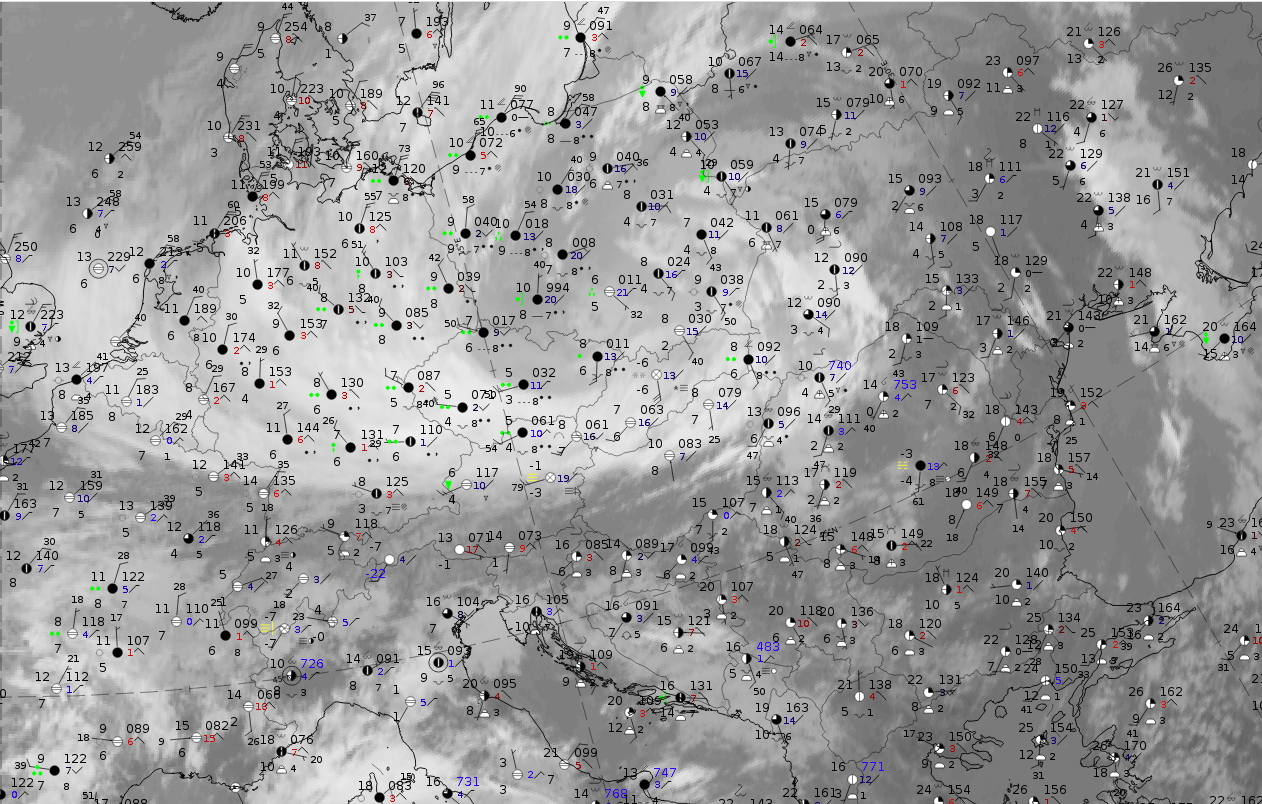
Legend: 13-14 October 2020, IR; synoptic observations
U.l.: 06 on 13 October 2020, Wave stage; u.r.: 12 UTC on 13 October 2020, Intensification stage; 00 UTC on 14 October 2020, Mature stage; 12 UTC on 14 October 2020, Dissipation stage.
Note: To enlarge the image, click on it.
Note: To access the gallery of individual images click here
All four stages are accompanied by heavy precipitation, including showers. Showers appear more in the occlusion early on and in the inner part of the cloud spiral. The Mature stage has the highest rain intensities (according the numbers in the weather key) while a decrease of intensity is clearly visible in the Dissipation stage.
Legend: 13-14 October 2020, IR; Cloud Type (CT) from NWCSAF.
U.l.: 06 on 13 October 2020, Wave stage; u.r.: 12 UTC on 13 October 2020, Intensification stage; 00 UTC on 14 October 2020, Mature stage; 12 UTC on 14 October 2020, Dissipation stage.
Note: To enlarge the image, click on it.
Note: To access the gallery of individual images click here
Legend: 13-14 October 2020, IR; Cloud Top height (CTTH) from NWCSAF.
U.l.: 06 on 13 October 2020, Wave stage; u.r.: 12 UTC on 13 October 2020, Intensification stage; 00 UTC on 14 October 2020, Mature stage; 12 UTC on 14 October 2020, Dissipation stage.
Note: To enlarge the image, click on it.
Note: To access the gallery of individual images click here
In all four stages the are "high opaque" clouds, embedded with areas of "very high opaque". In the Dissipation stage, more areas of "semi-transparent thick" clouds appear.
The cloud top heights of these "high opaque" and "very high opaque" clouds are between 8000 and 10000 meters. In the "Intensification stage" there are some small spots reaching tops of 12000 metres and, in the Dissipation stage, areas with cloud top heights of 4000-6000 metres appear in the inner parts as well as at their boundaries.
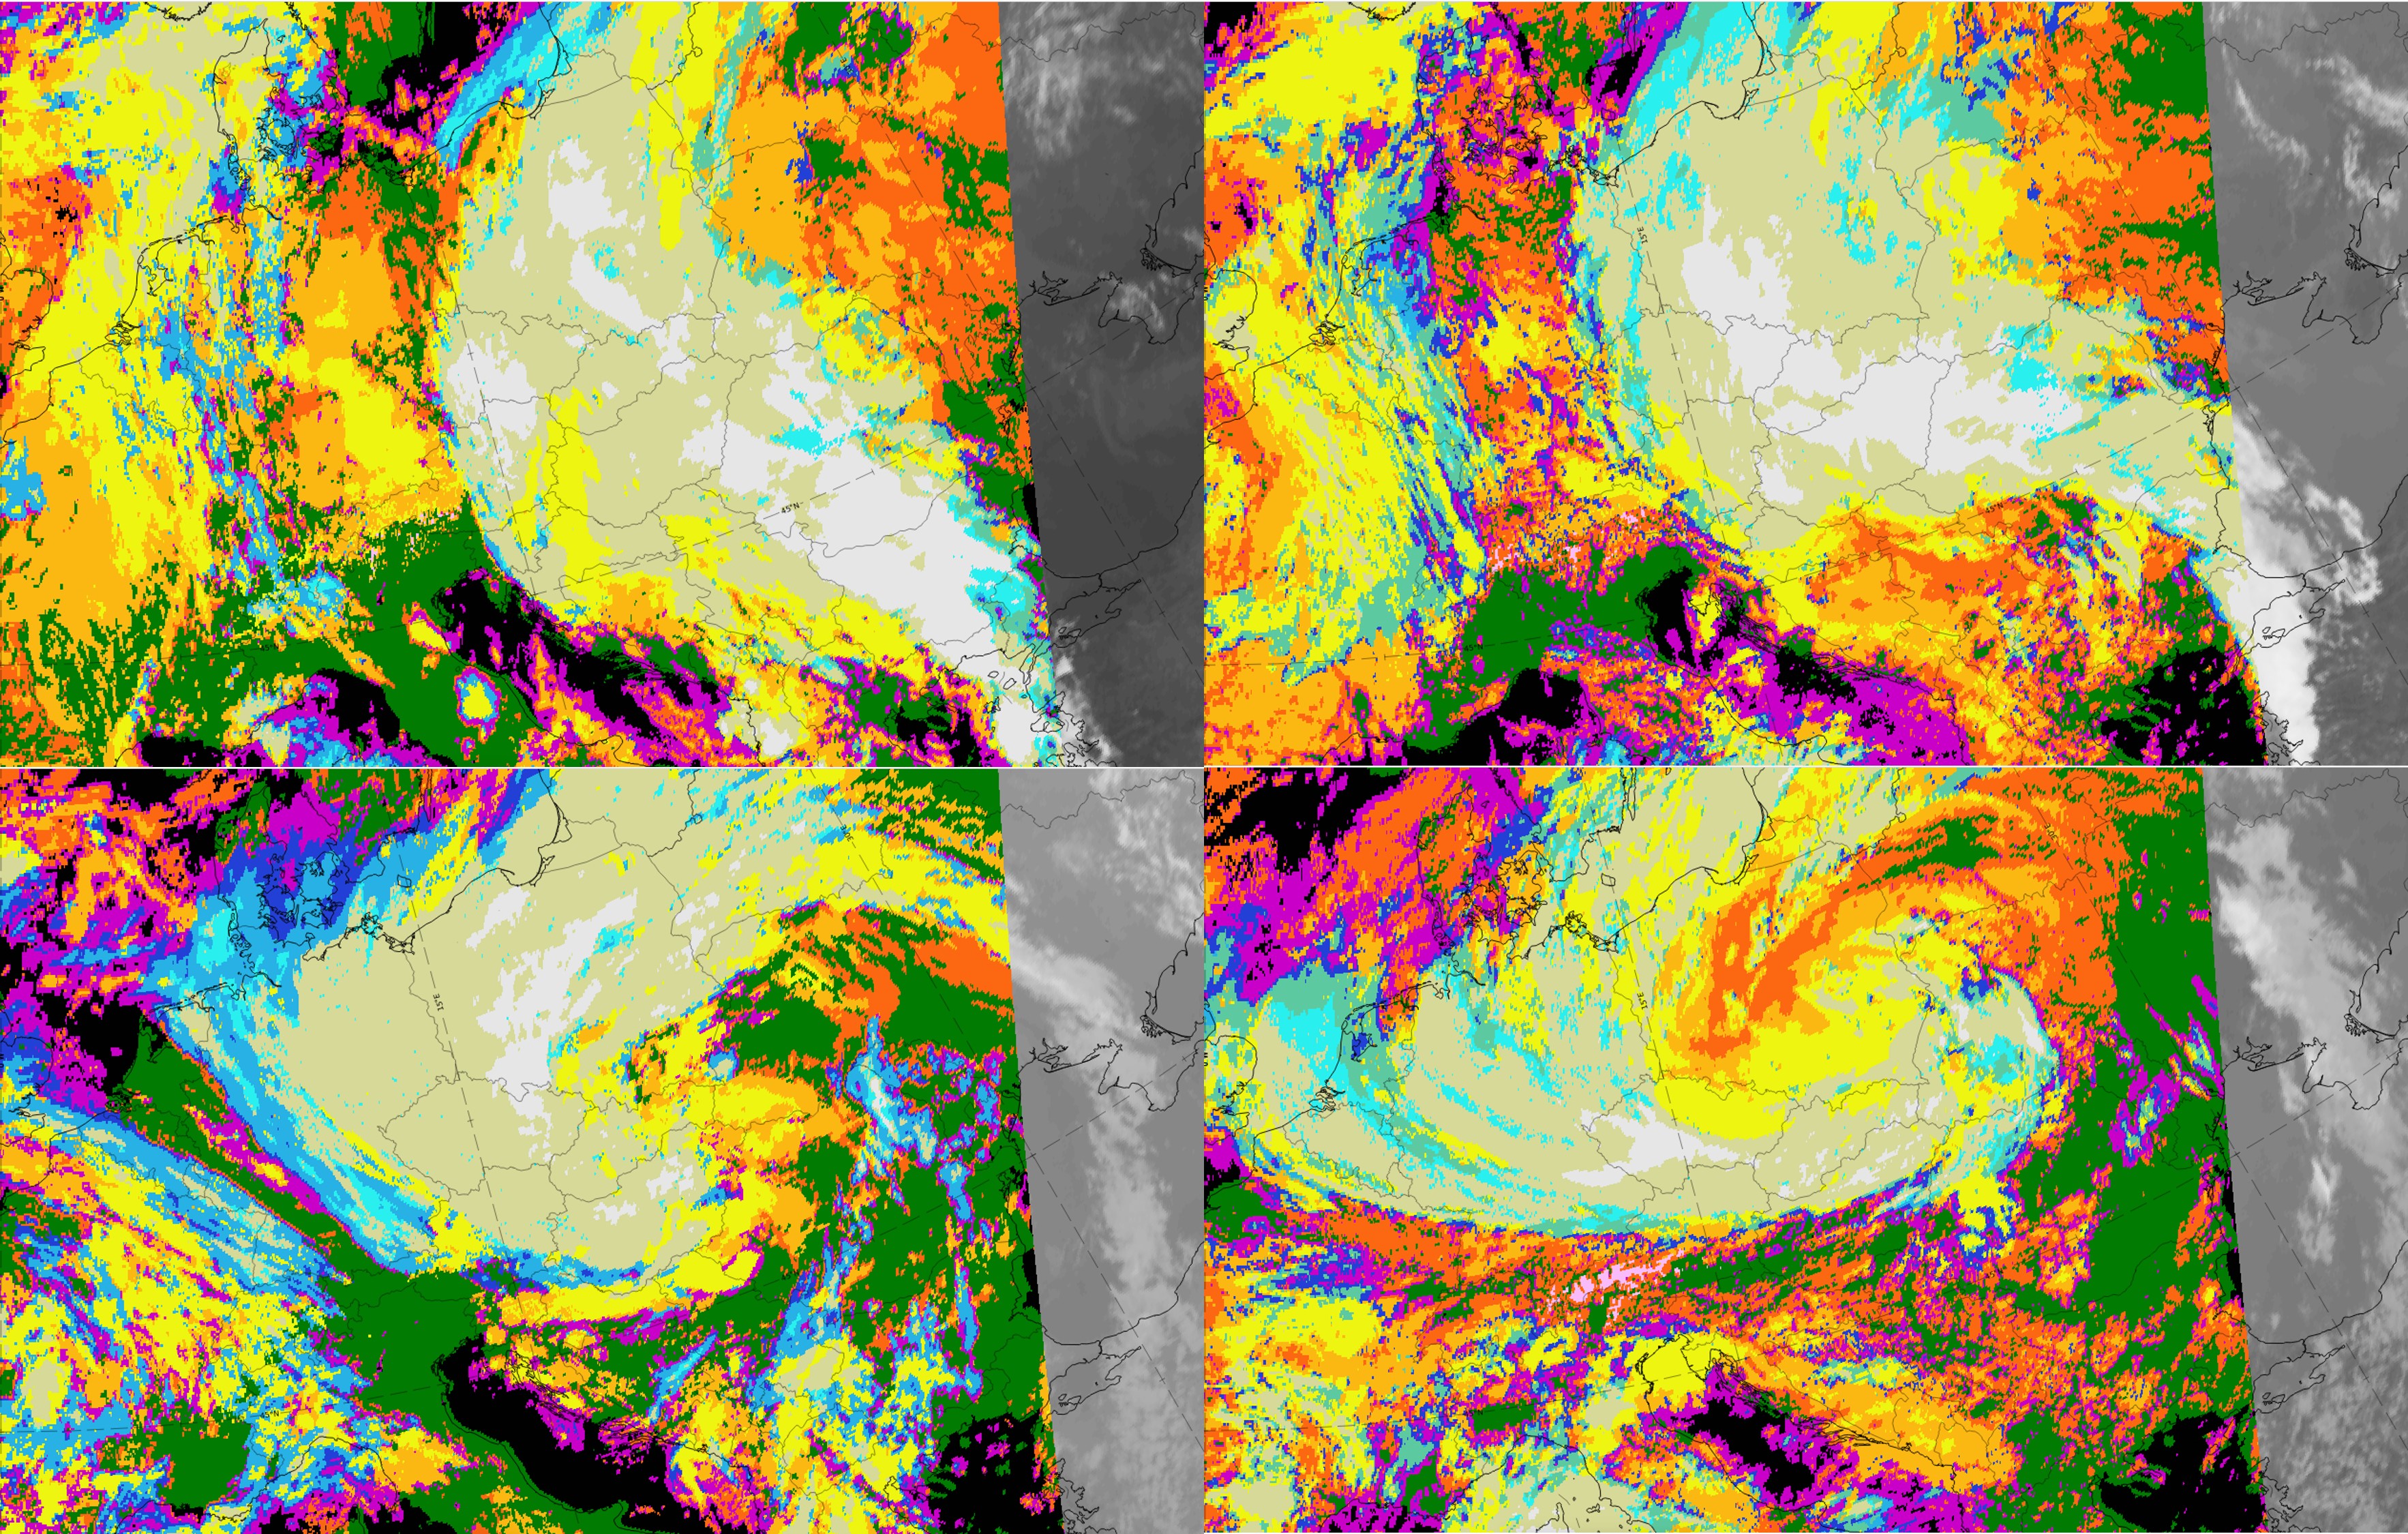
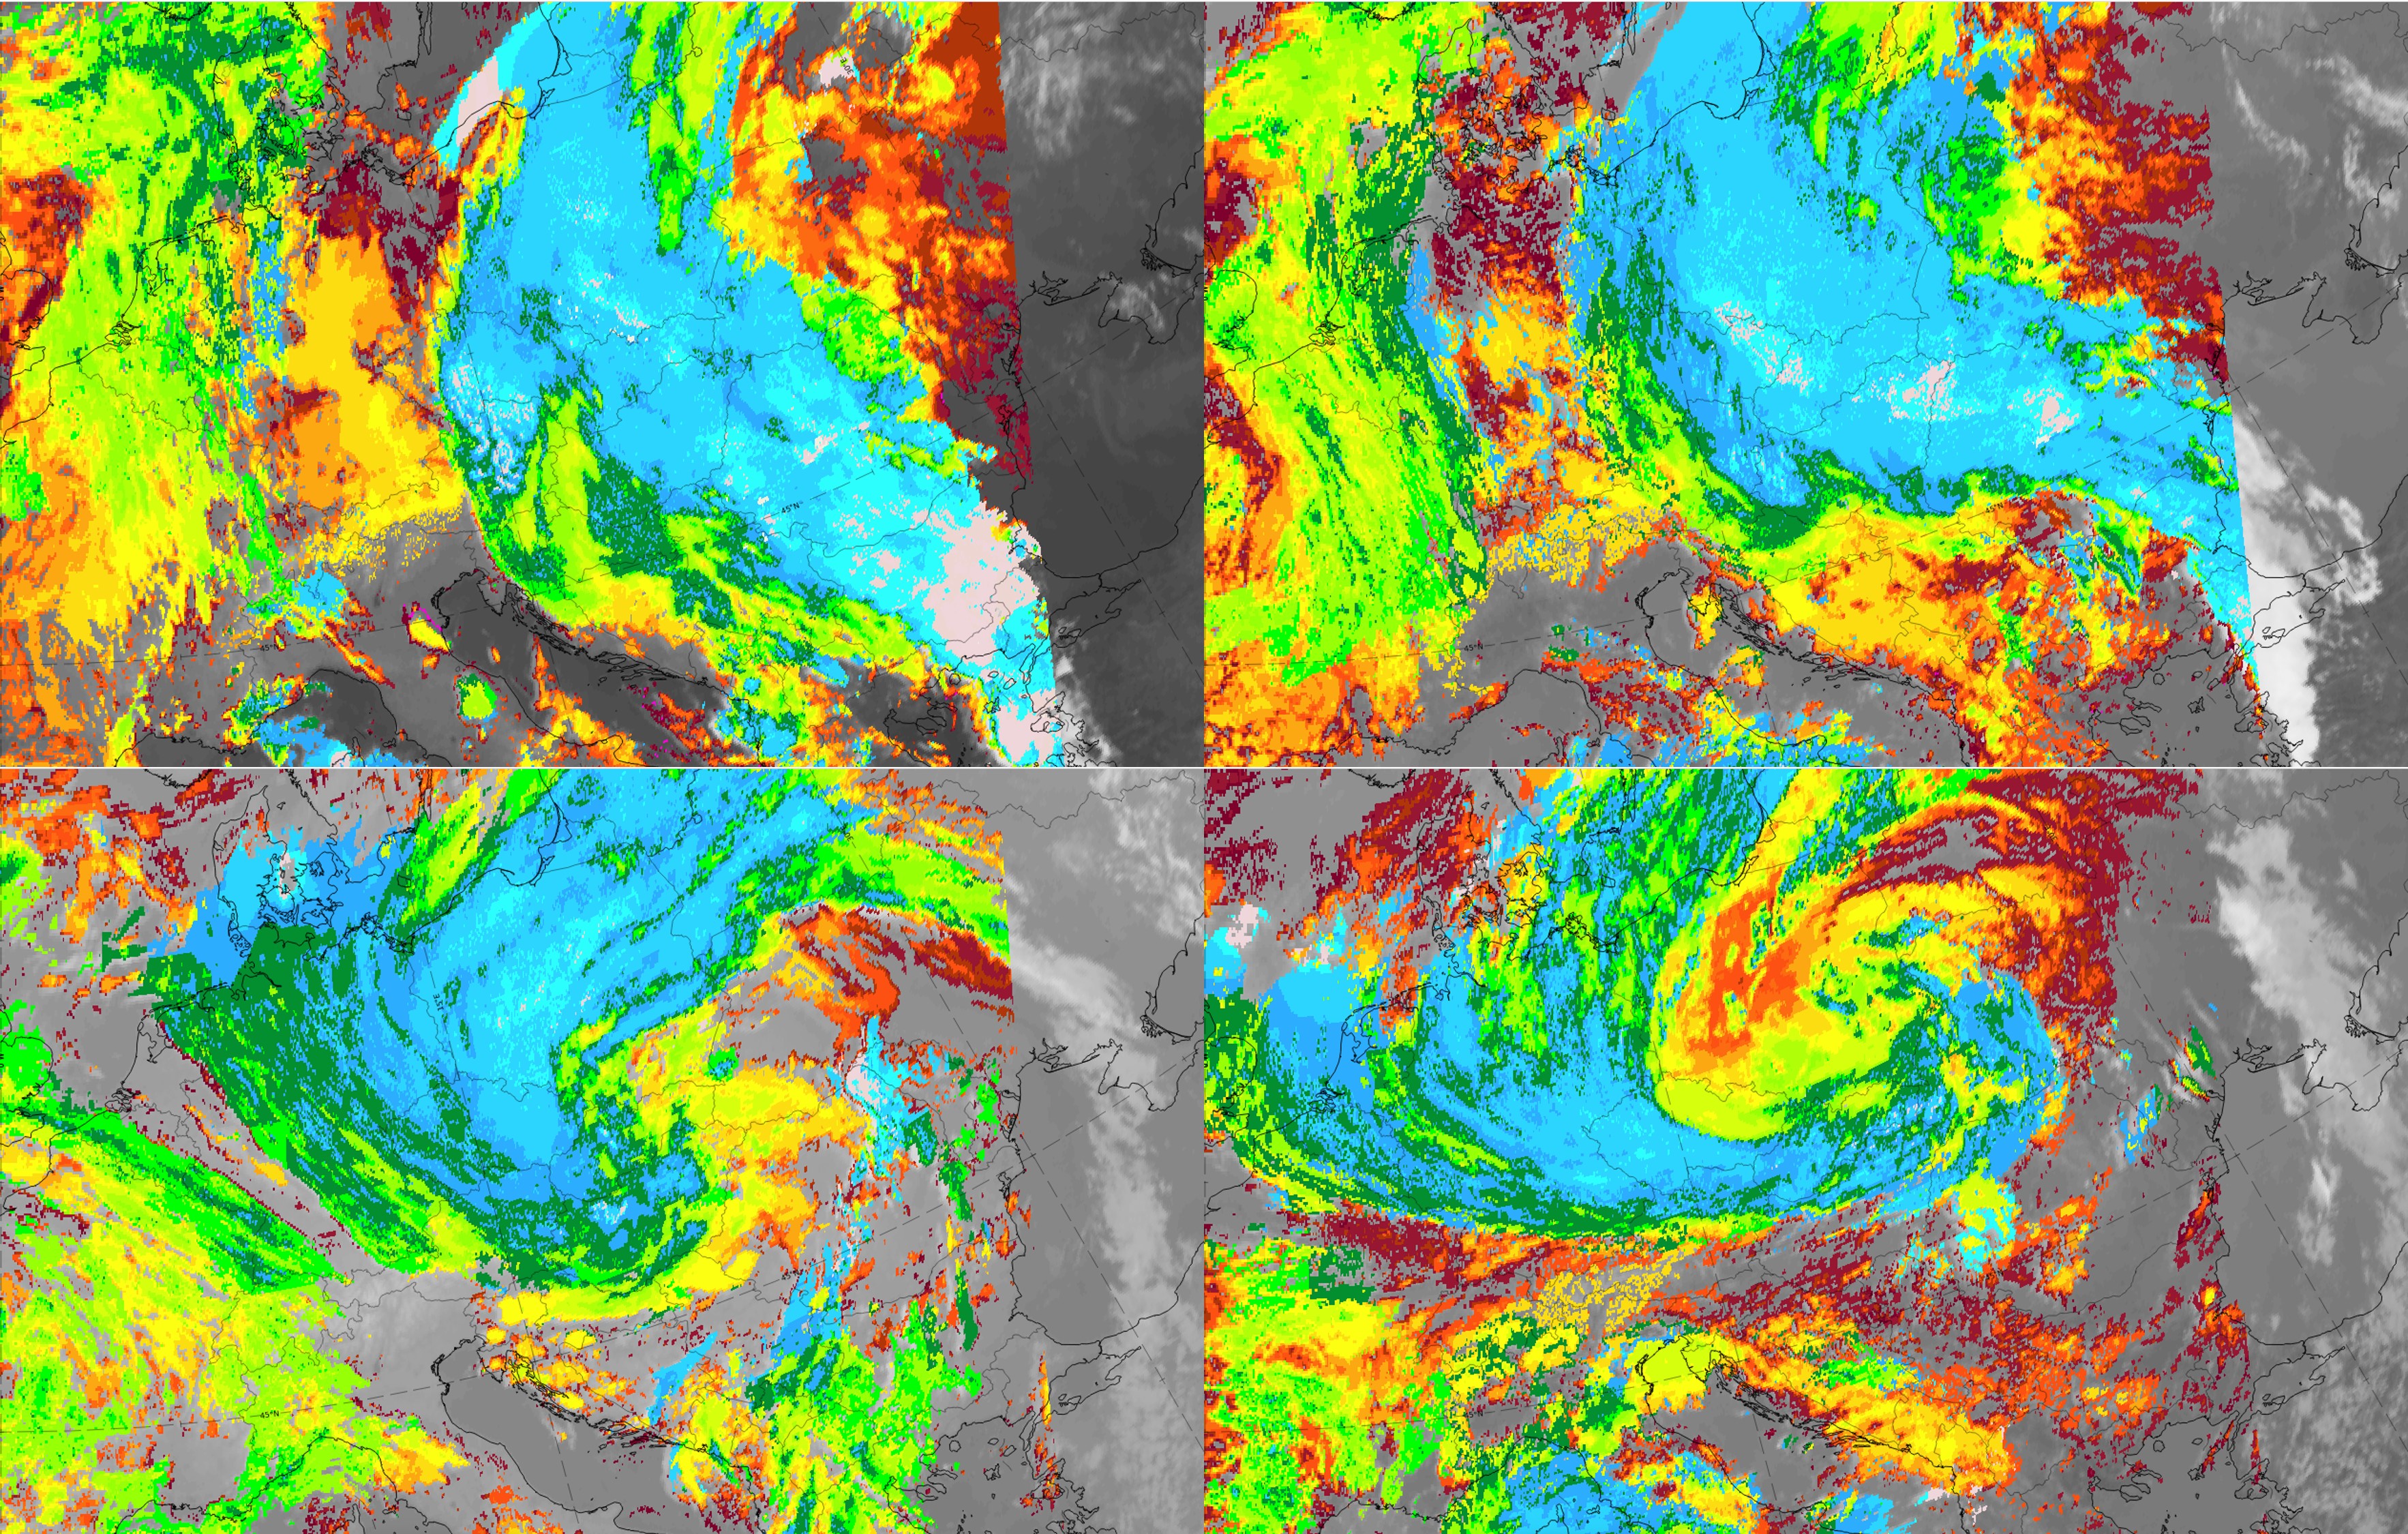
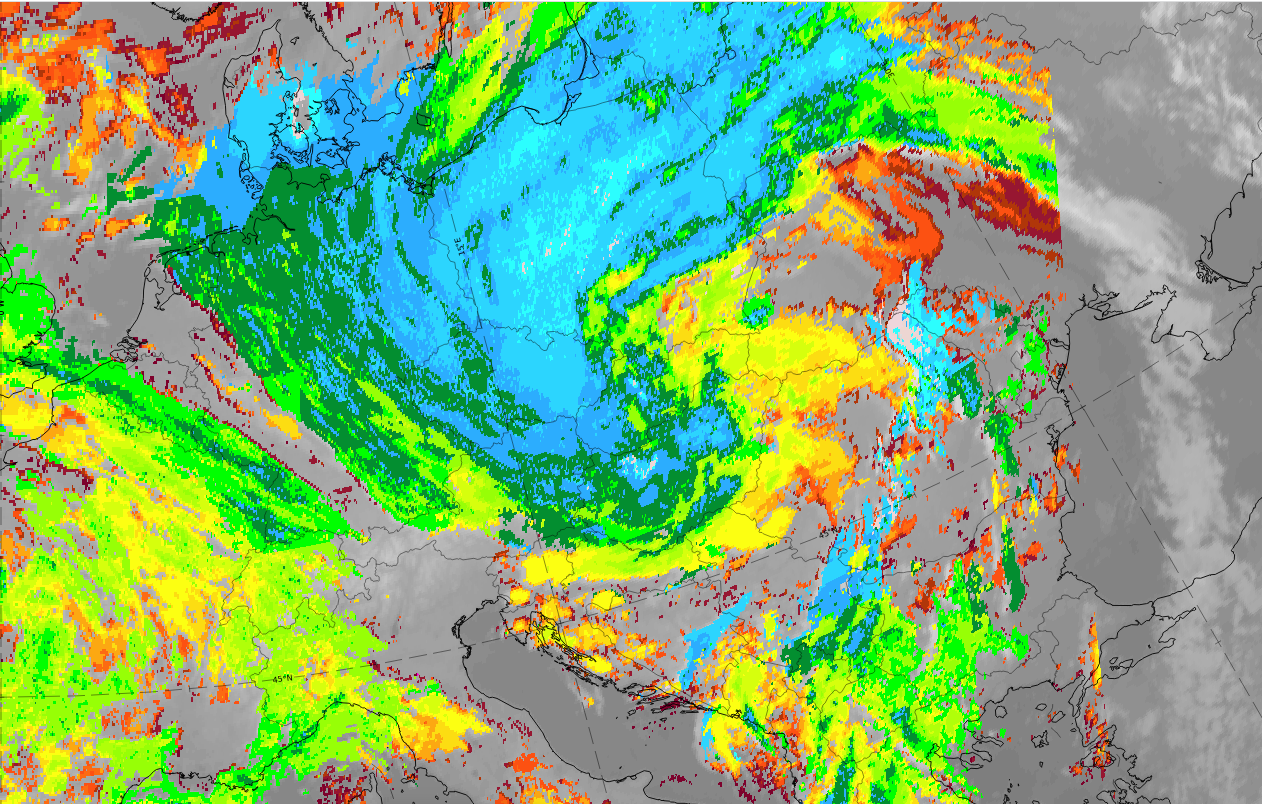
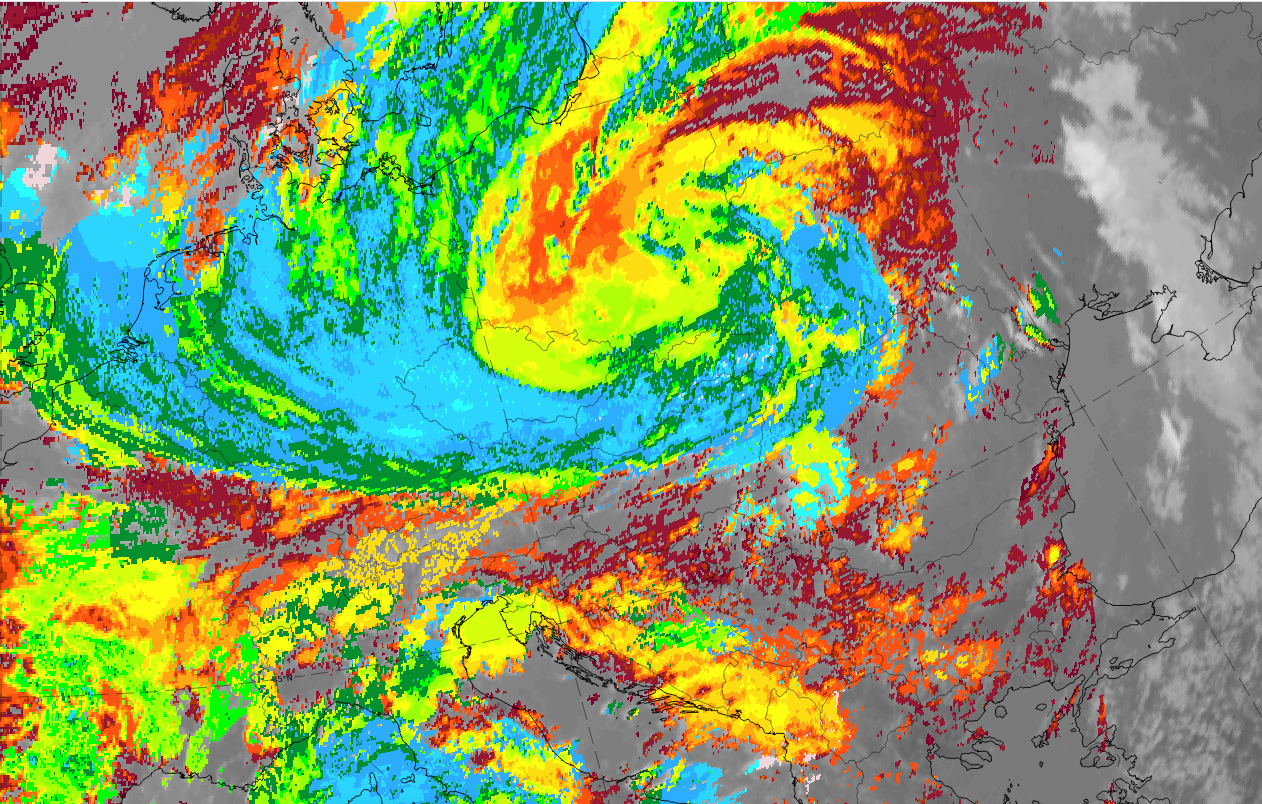
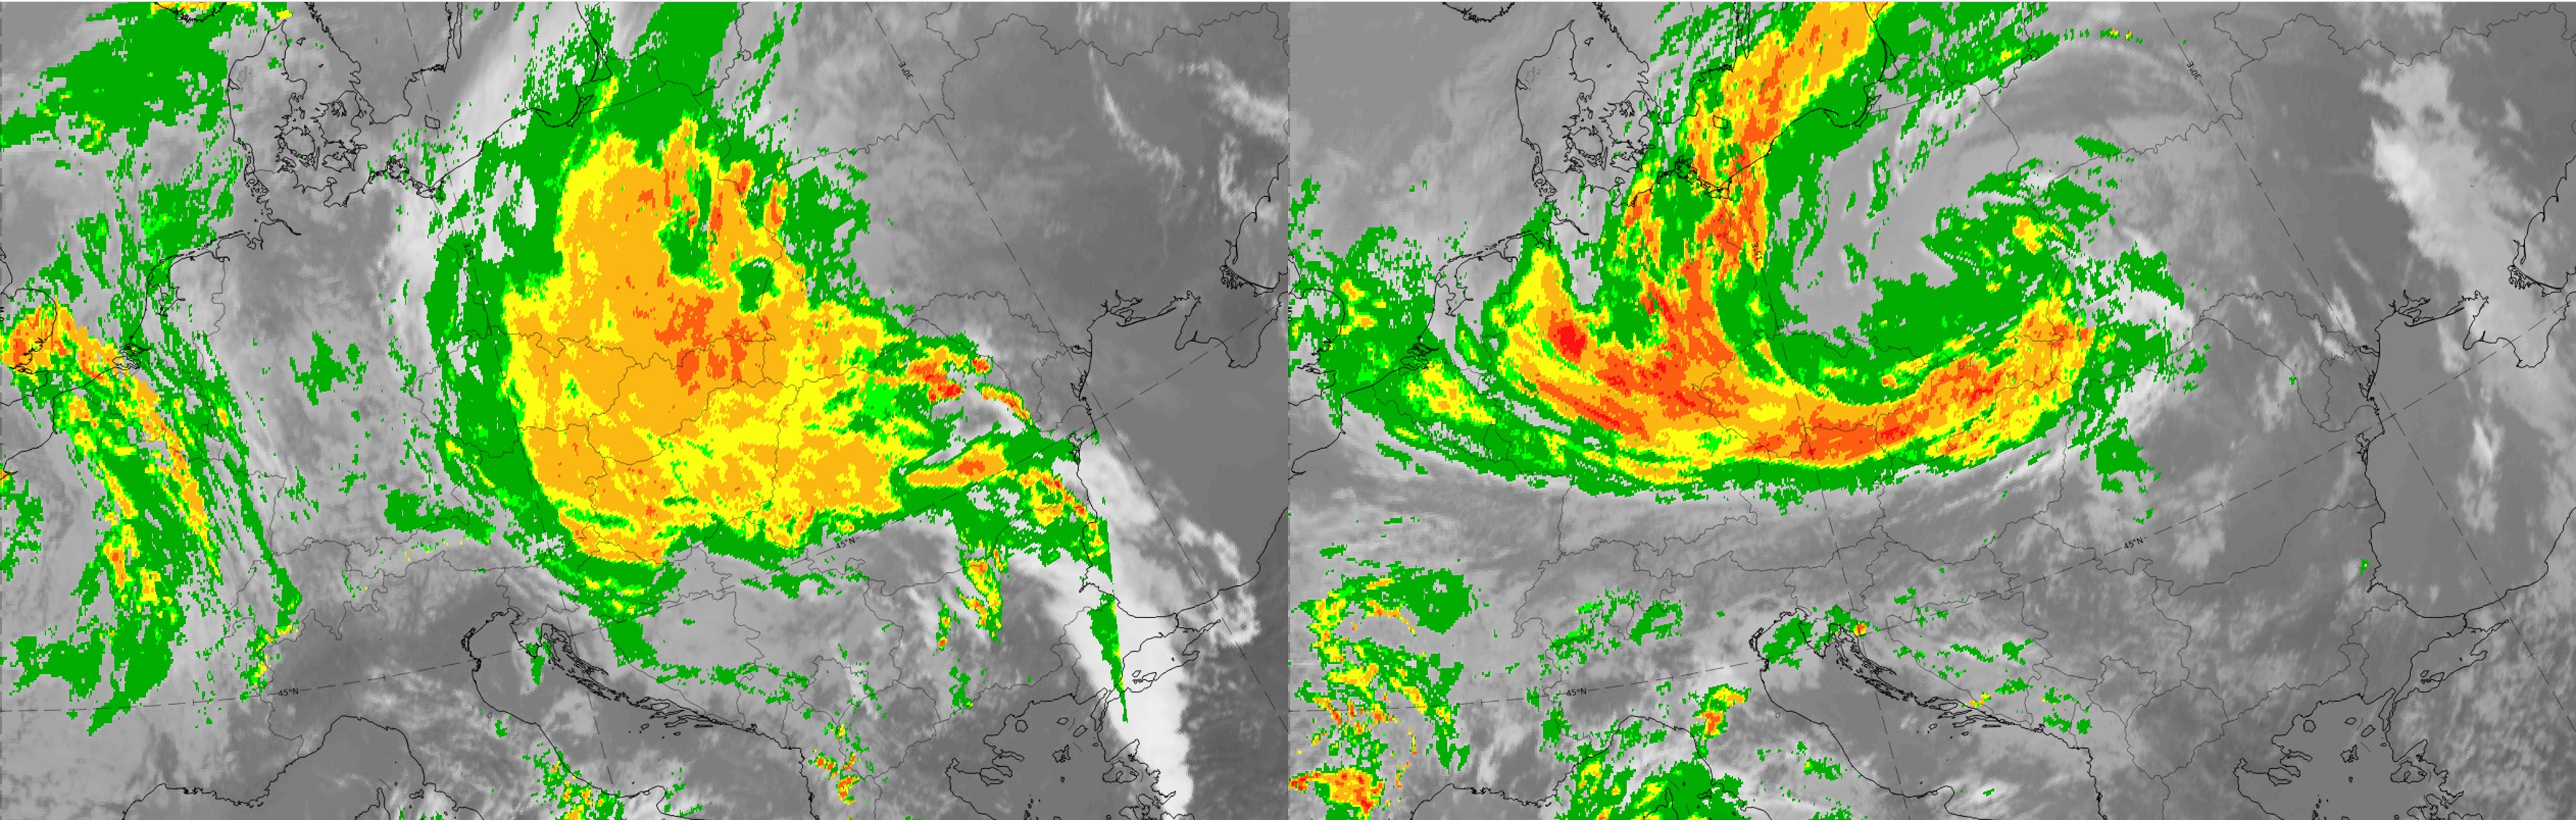
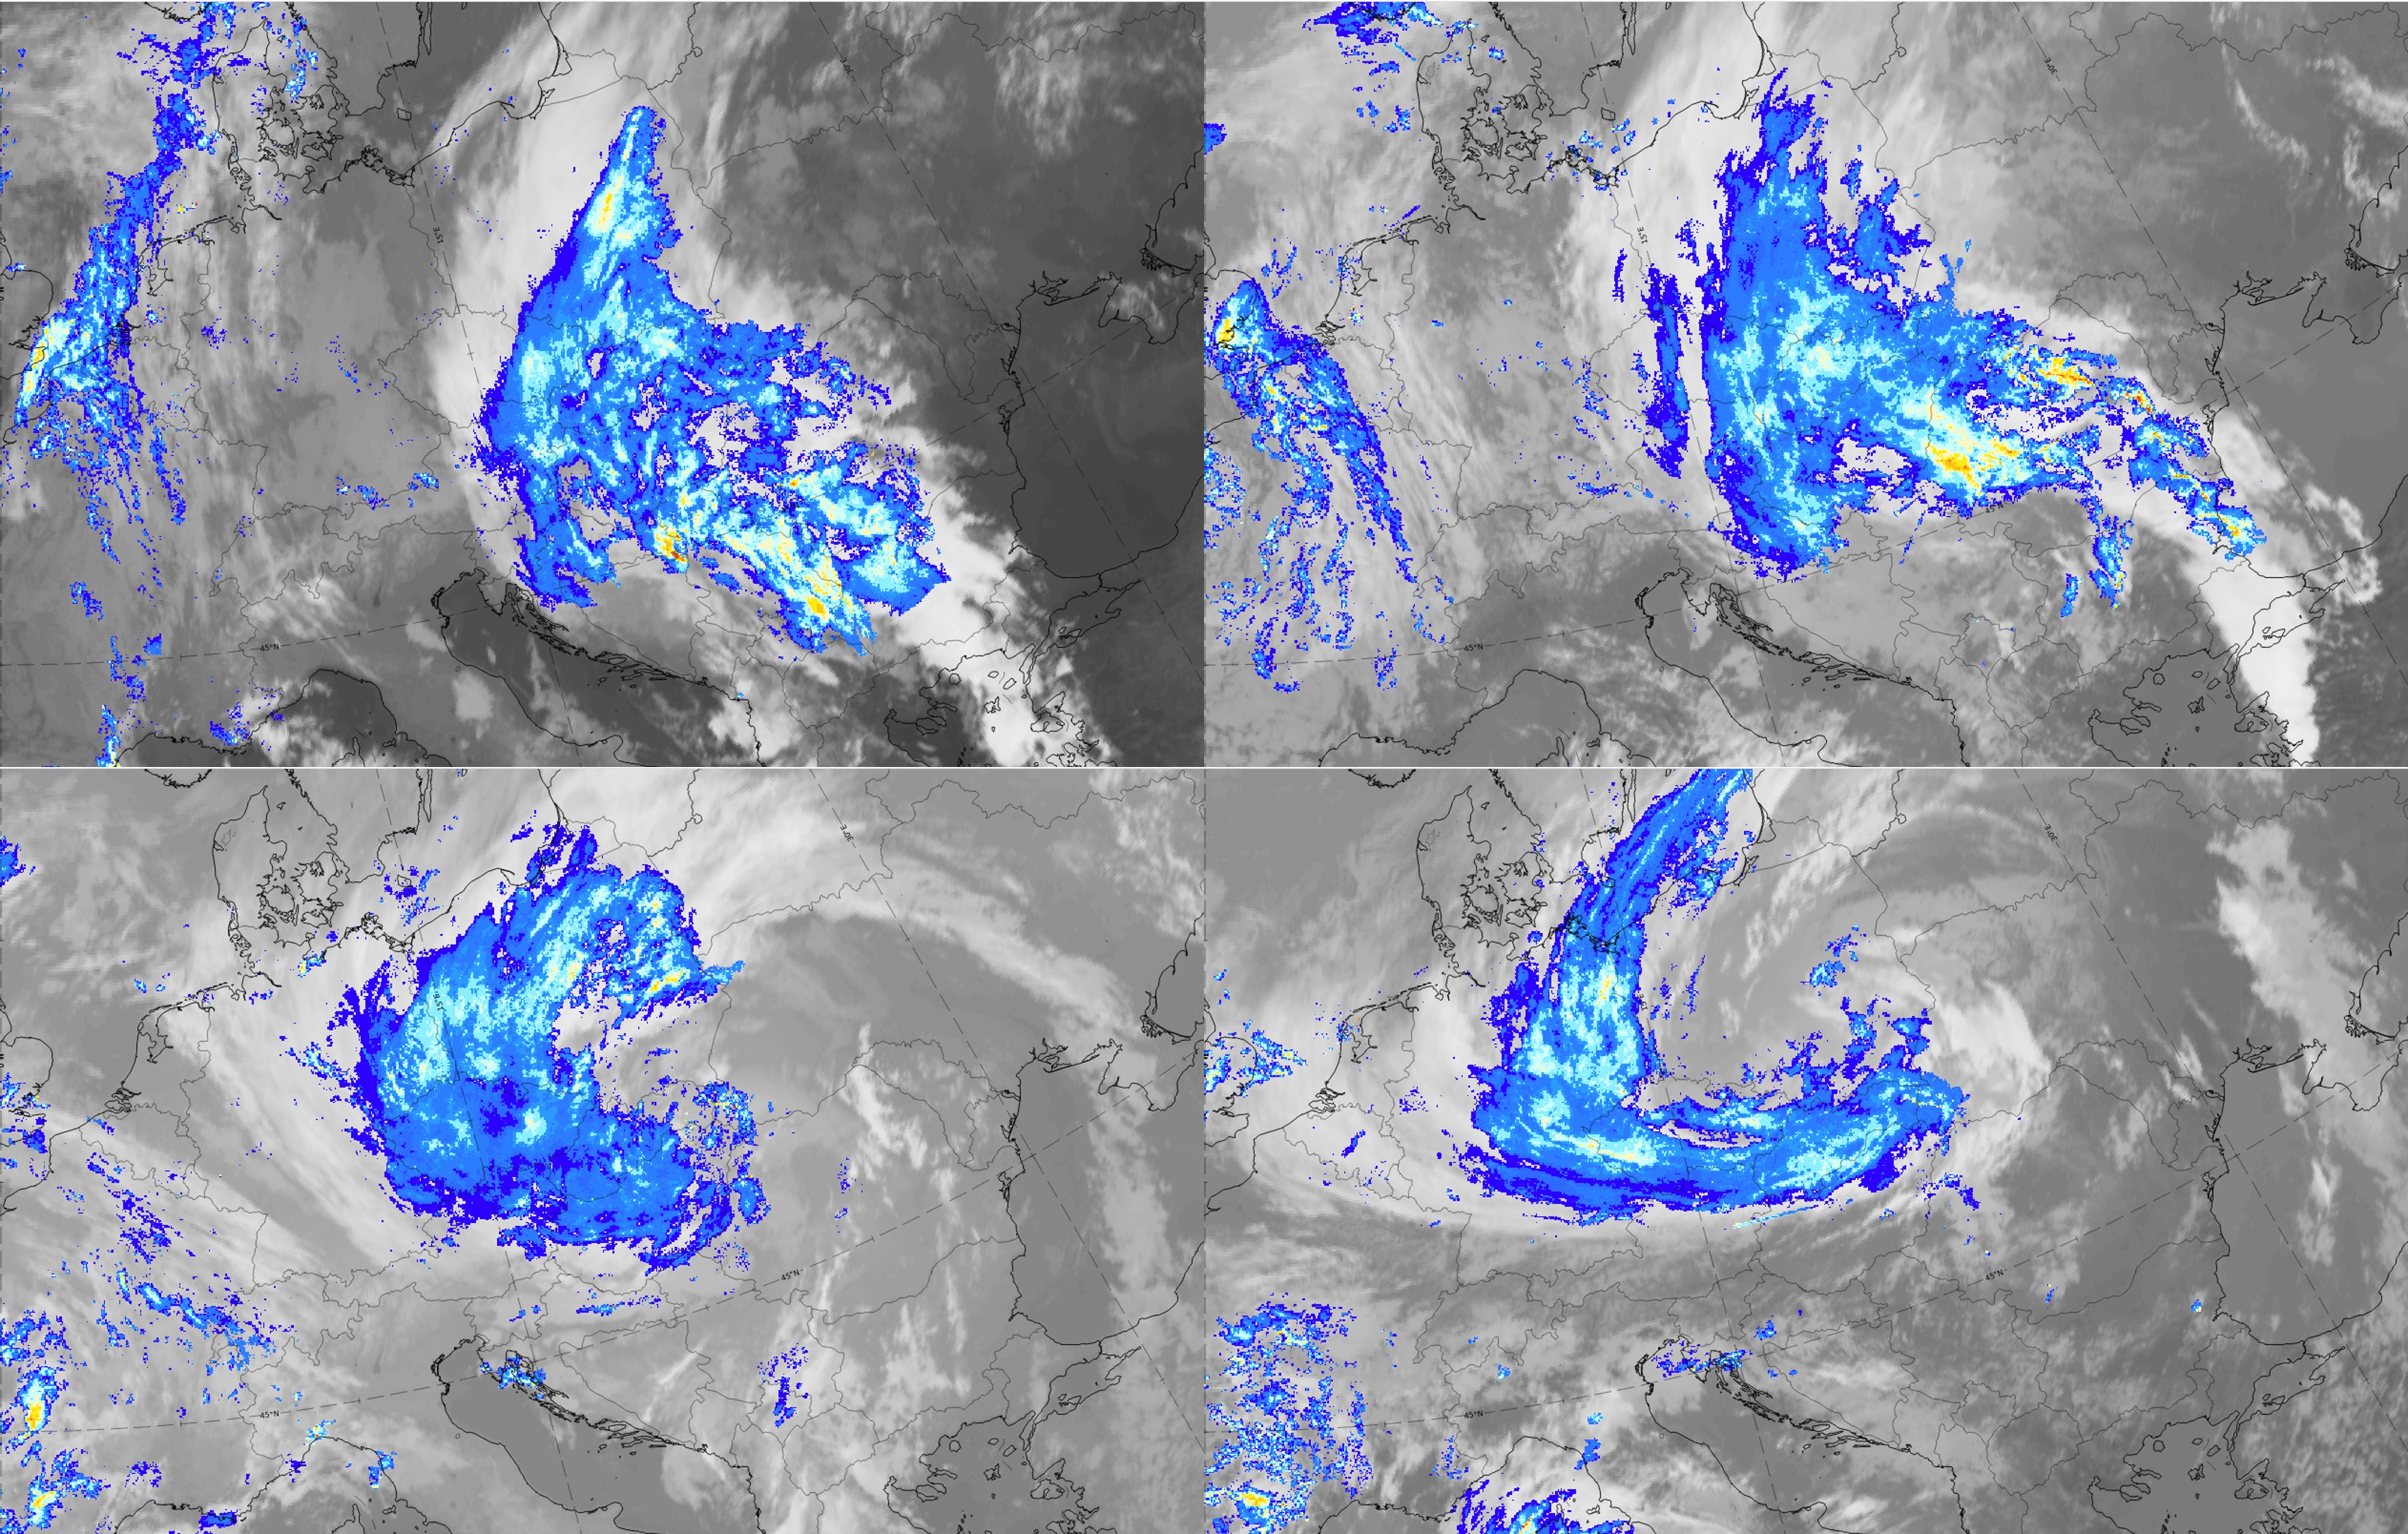
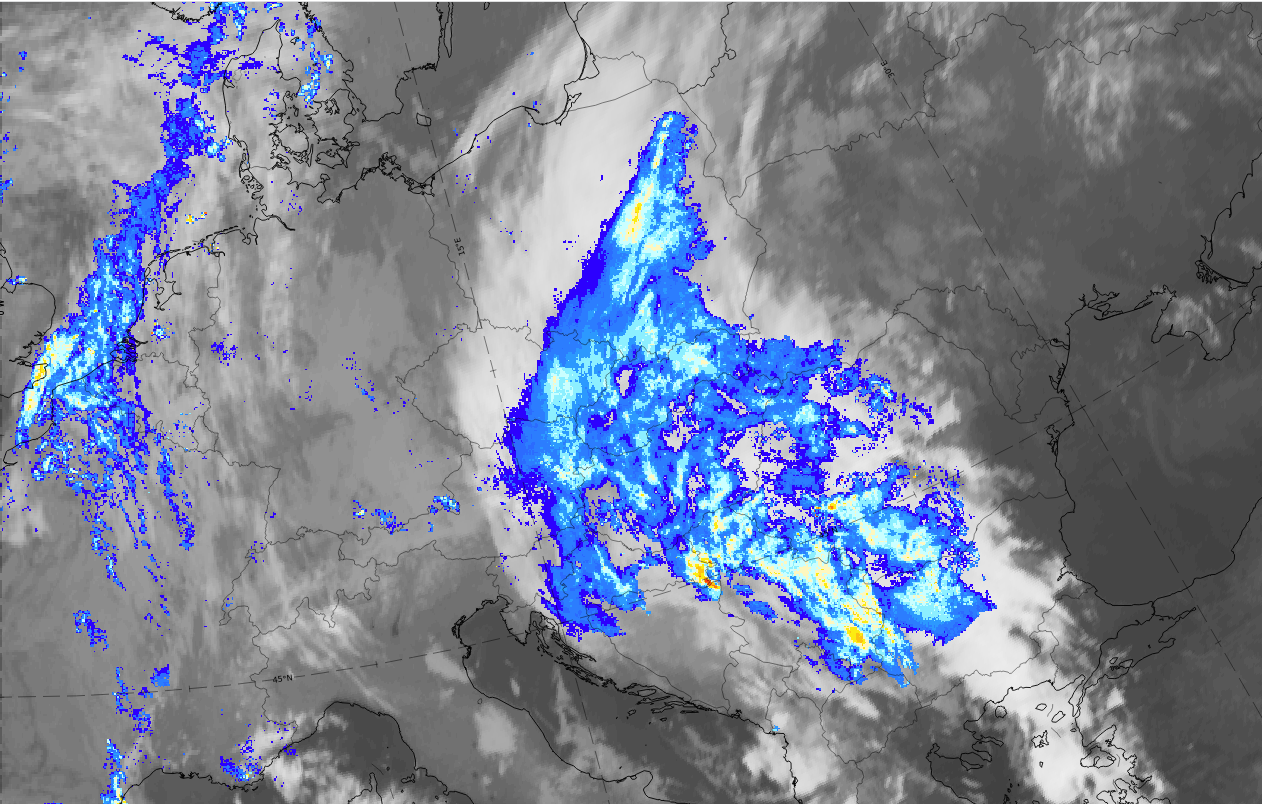
Legend: 13-14 October 2020, IR; Convective Rainfall Rate (CRR) from NWCSAF.
U.l.: 06 on 13 October 2020, Wave stage; u.r.: 12 UTC on 13 October 2020, Intensification stage; 00 UTC on 14 October 2020, Mature stage; 12 UTC on 14 October 2020, Dissipation stage.
Note: To enlarge the image, click on it.
Note: To access the gallery of individual images click here
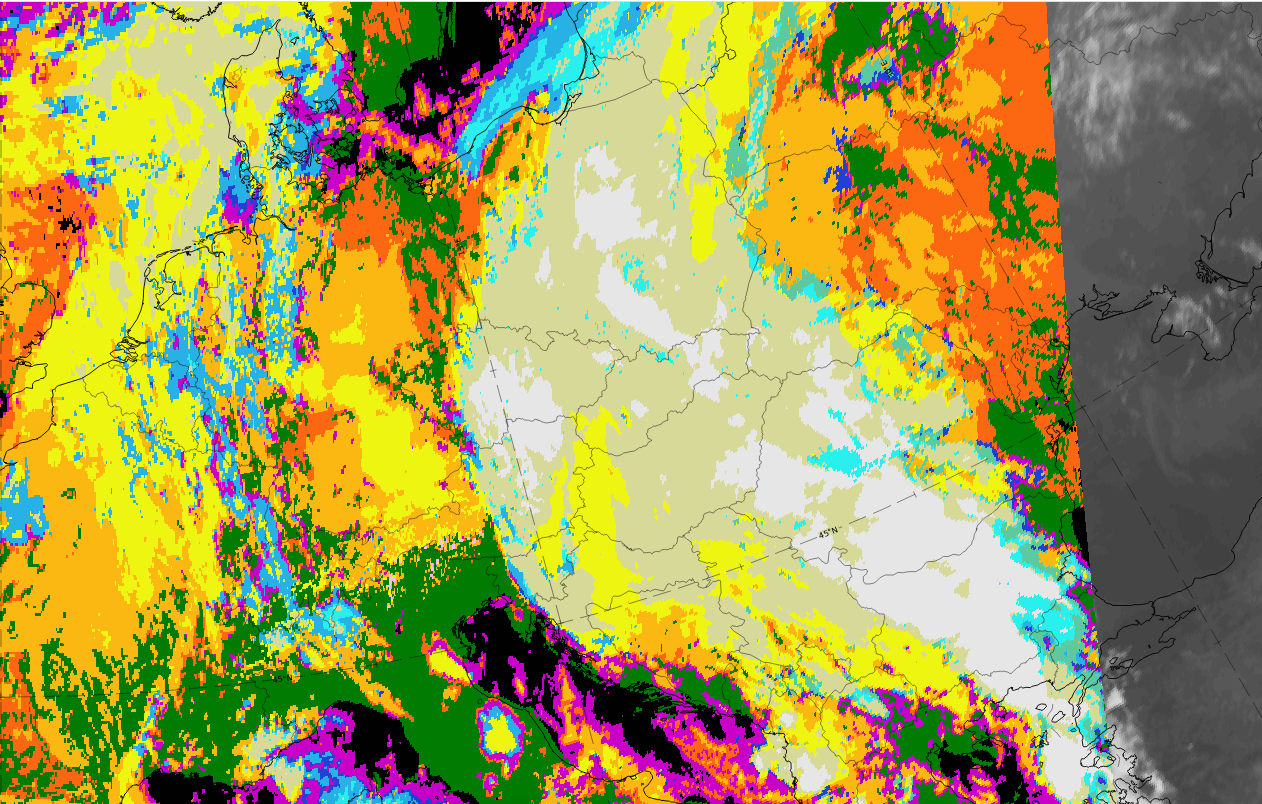
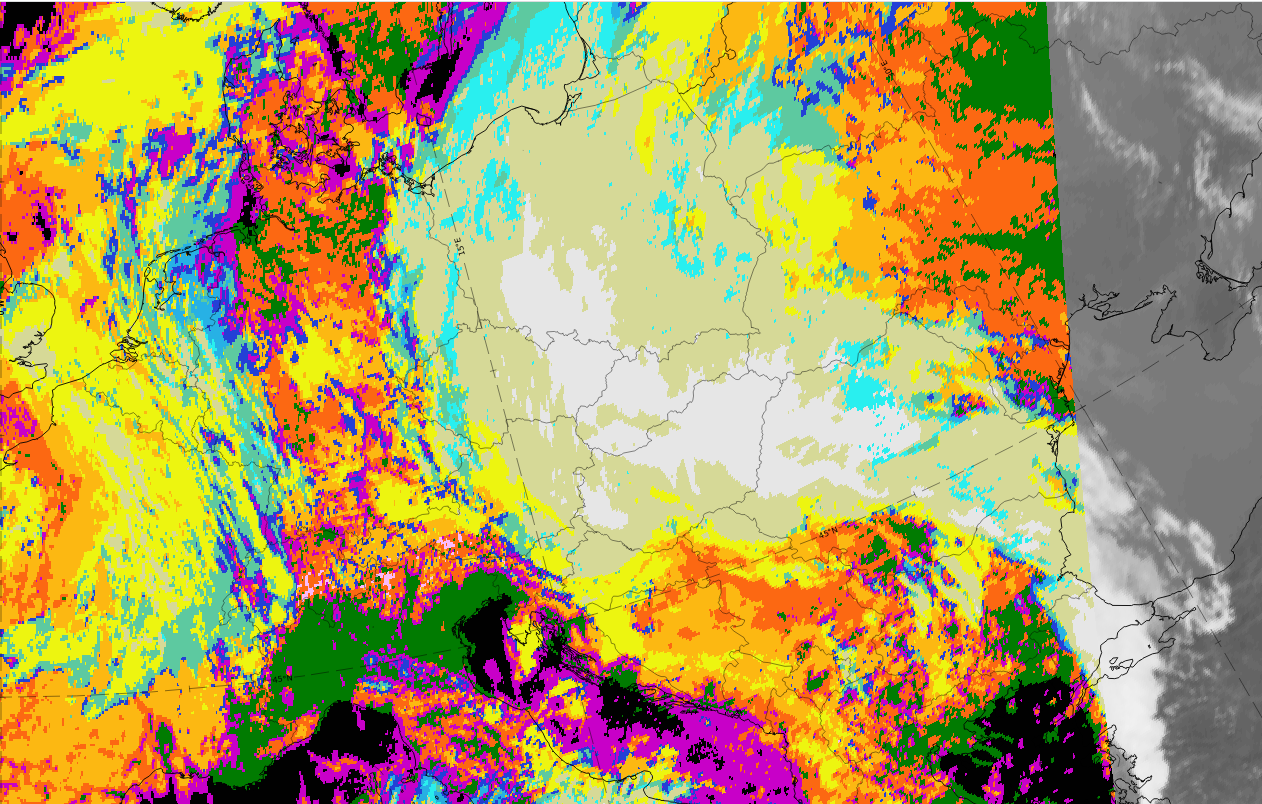
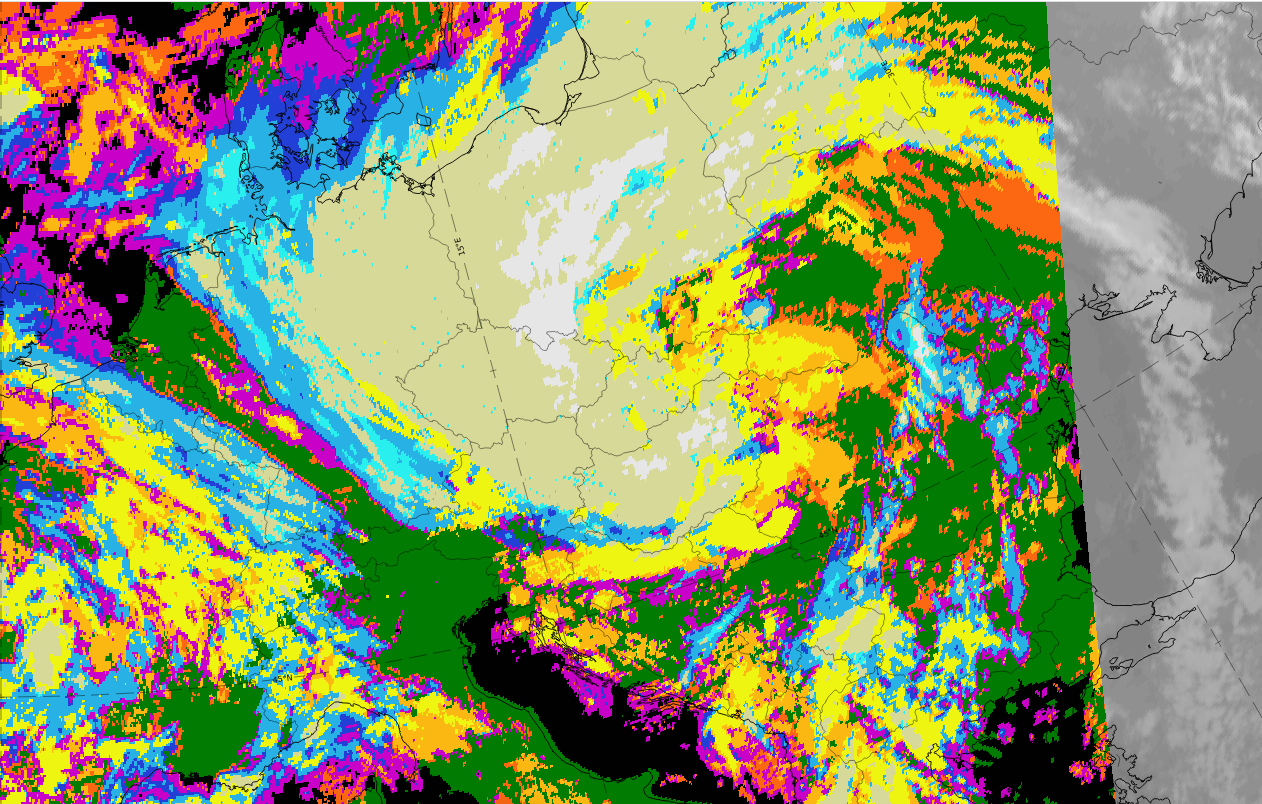
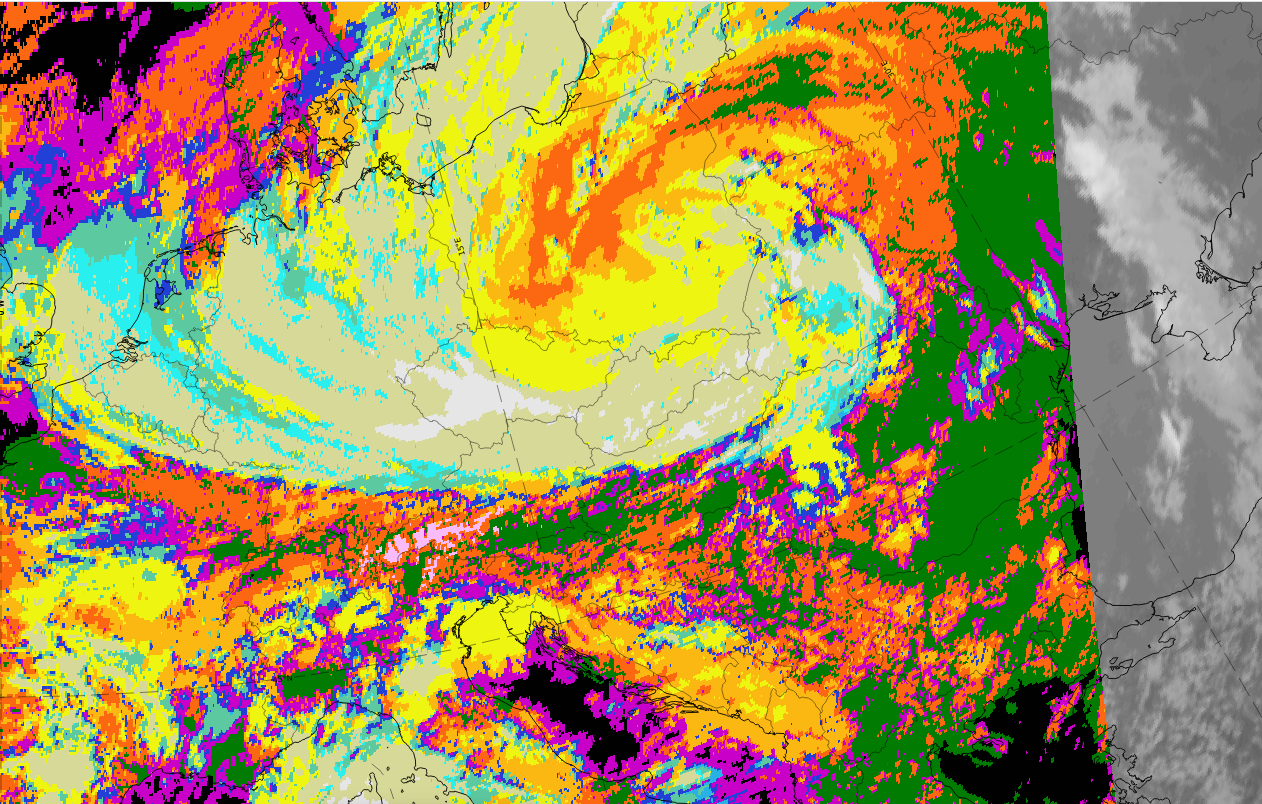
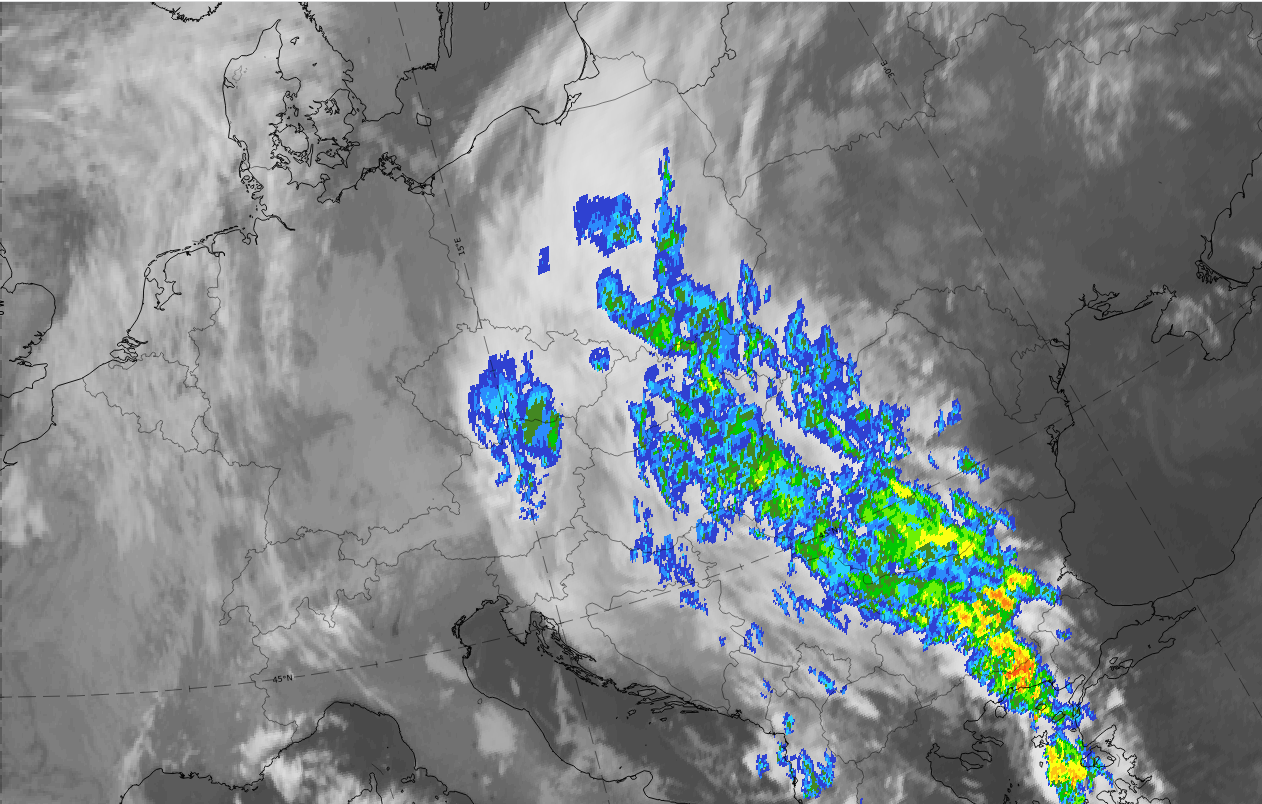
Legend: 13-14 October 2020, IR; Precipitating Clouds (PC) from NWCSAF.L.: 12 on 13 October 2020, Intensification stage; R.: 12 UTC on 14 October 2020, Dissipation stage.
Note: To enlarge the image, click on it.
Note: To access the gallery of individual images click here
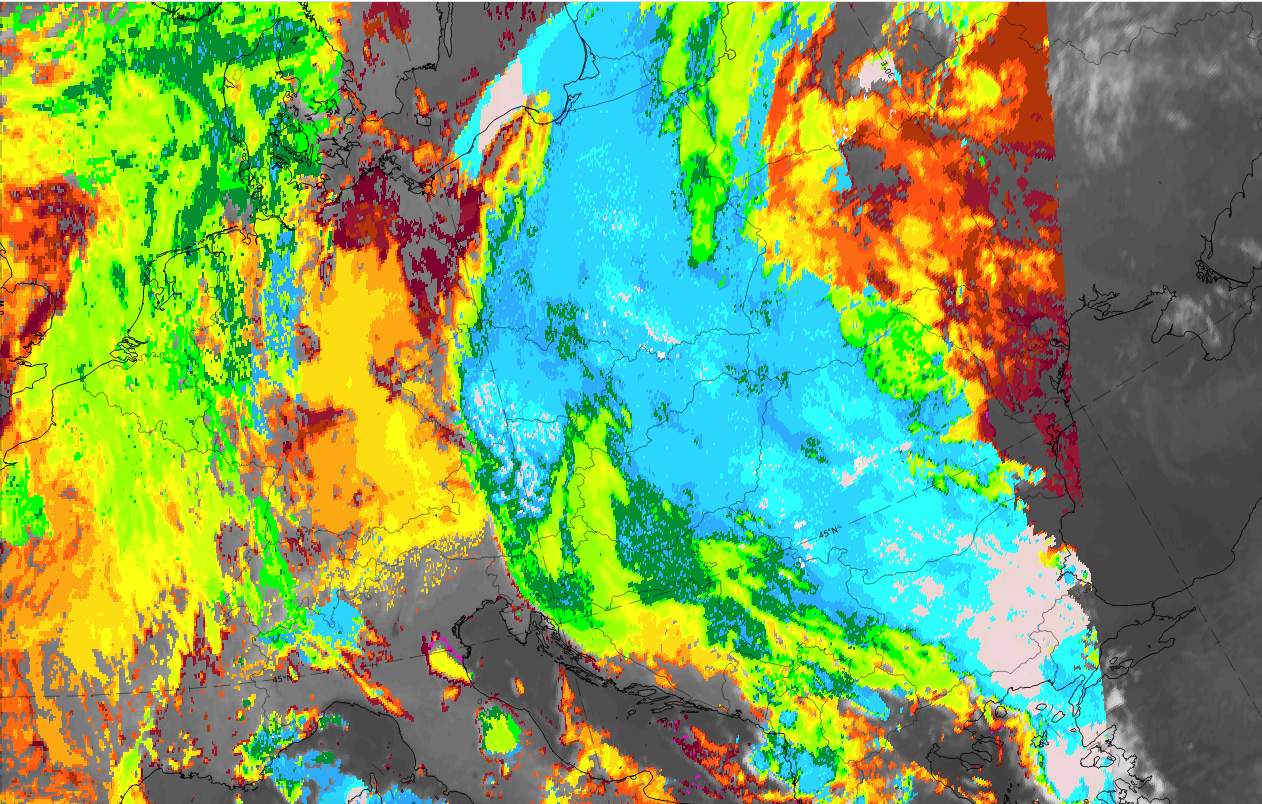
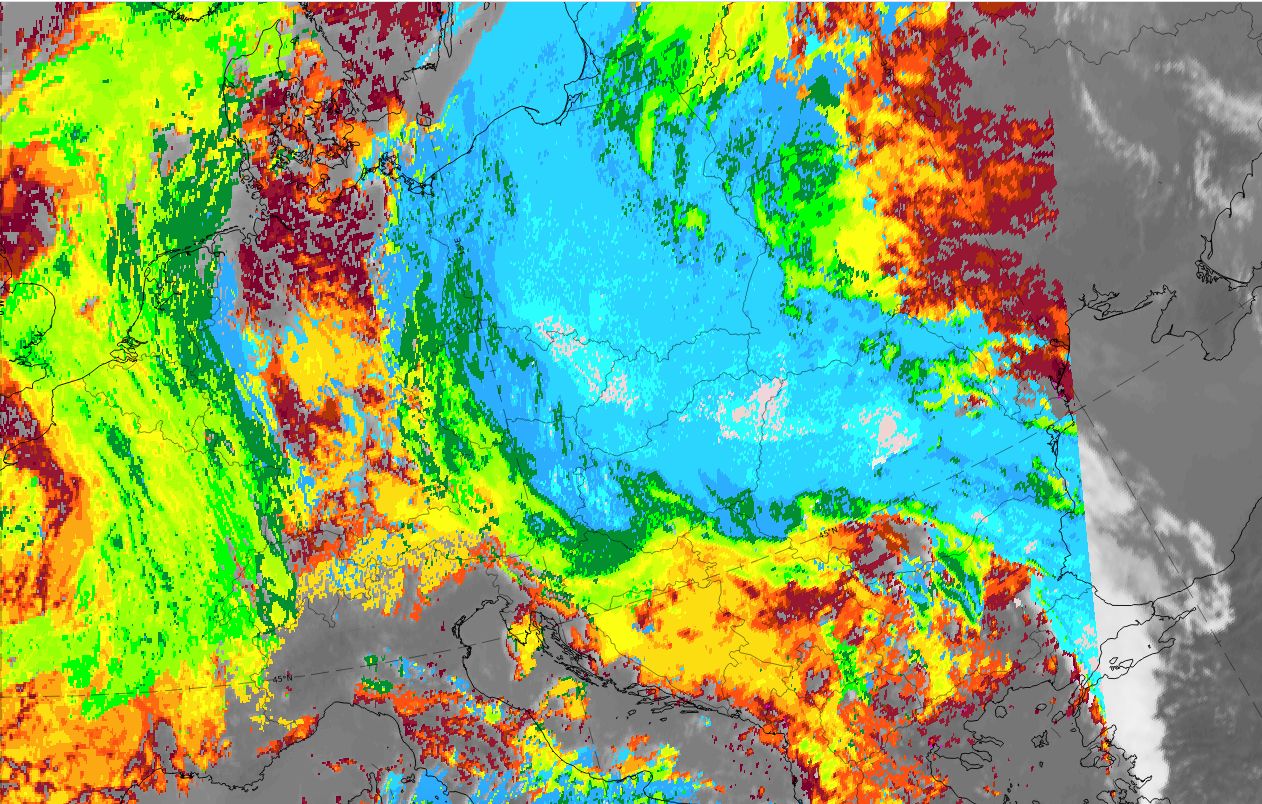
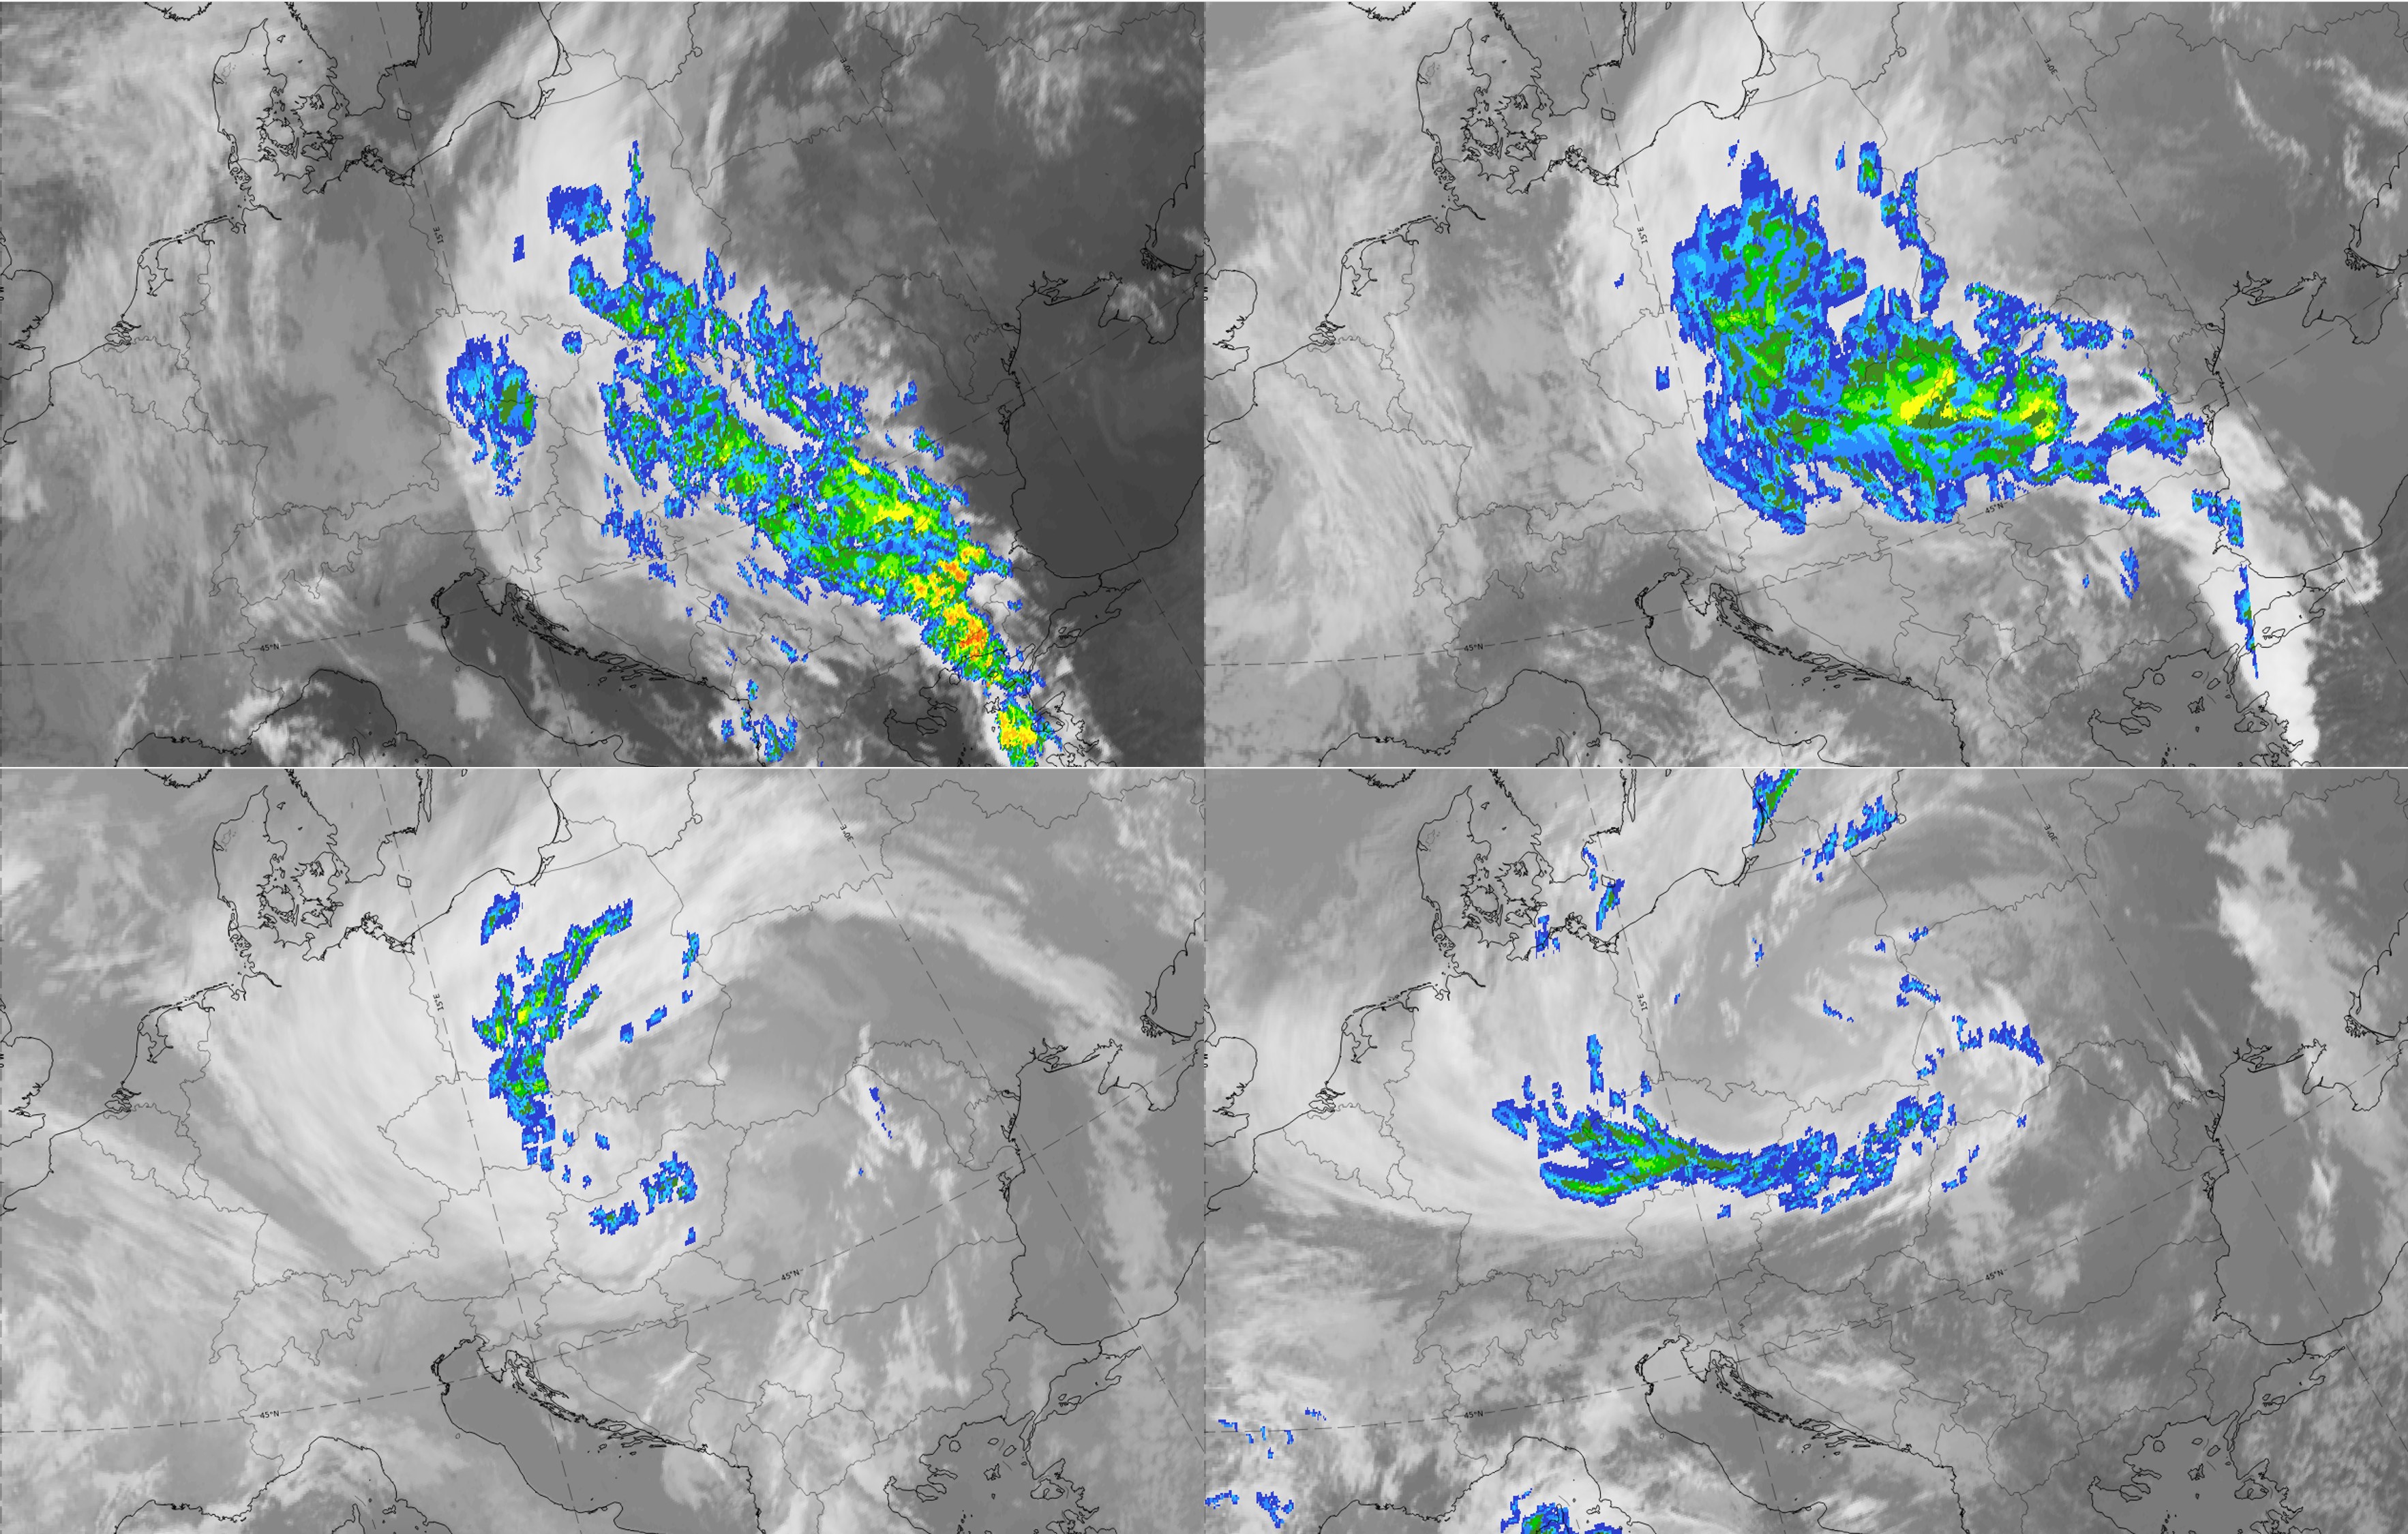
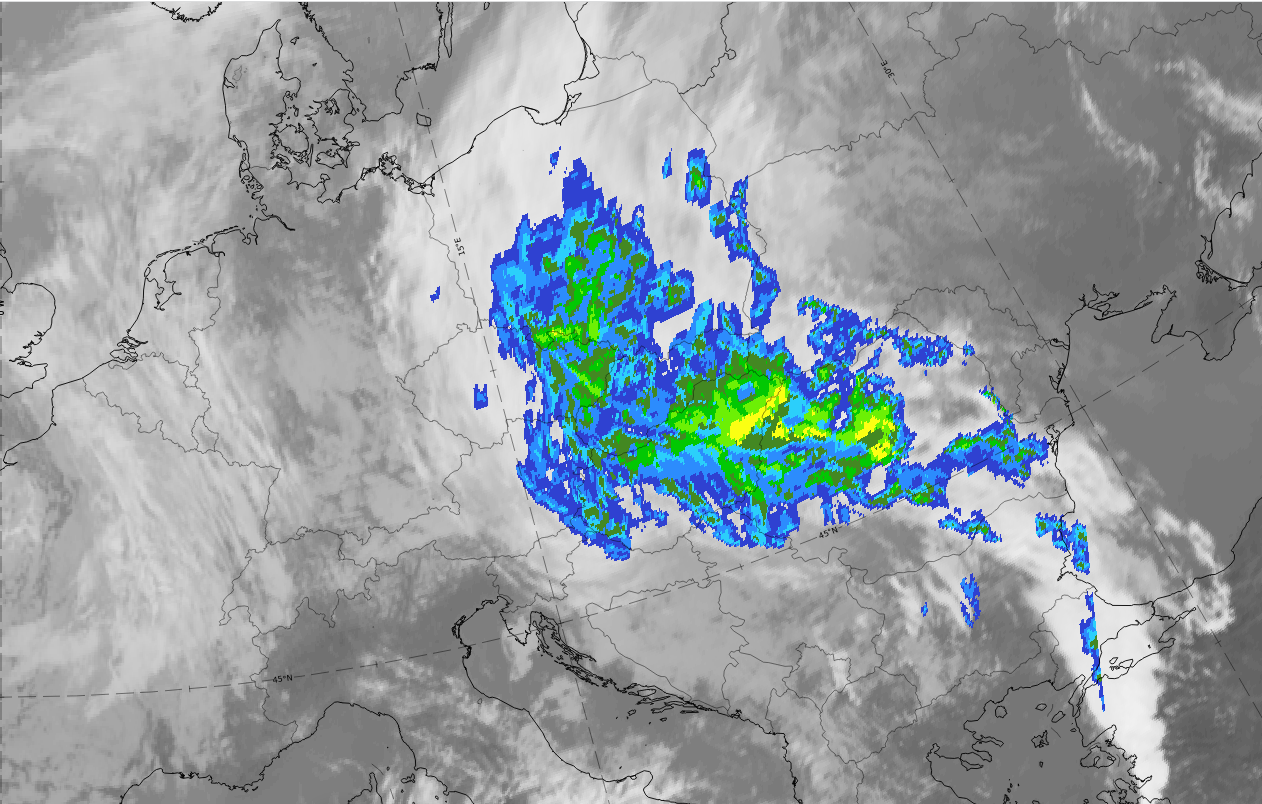
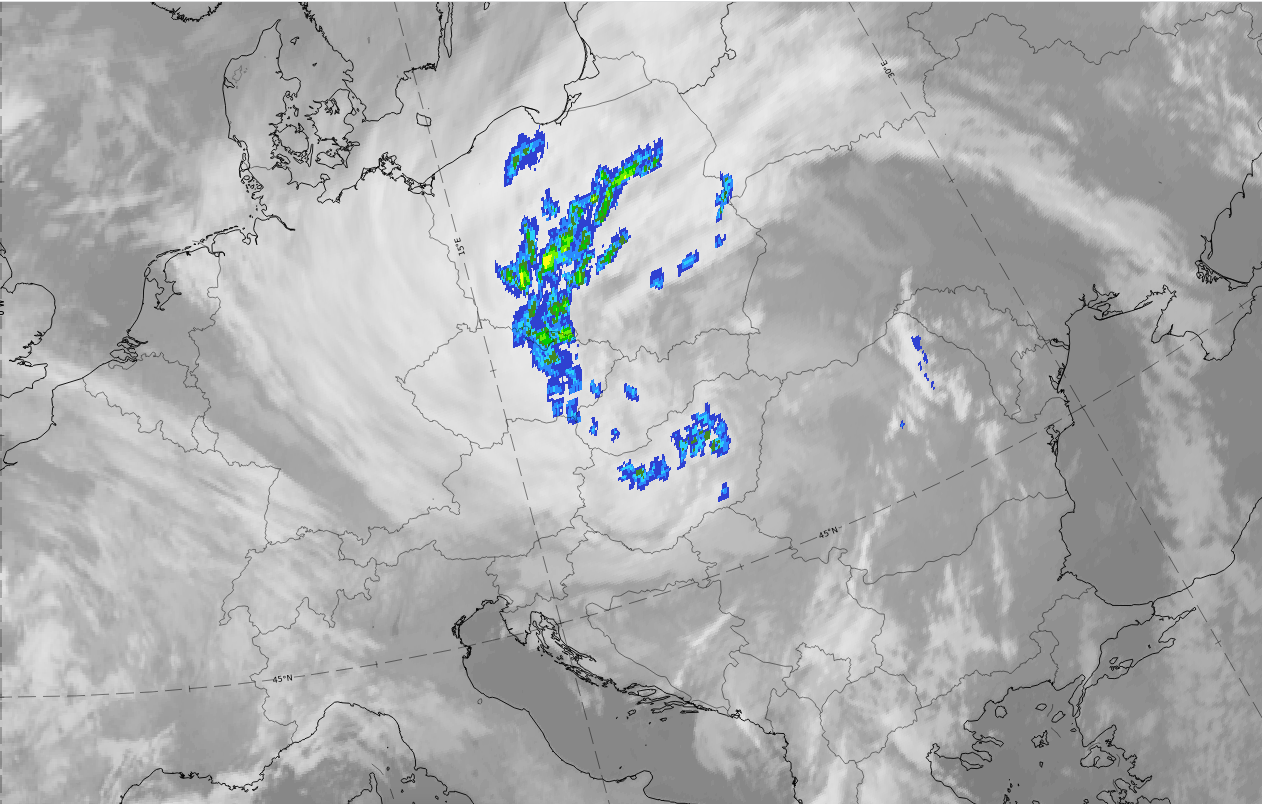
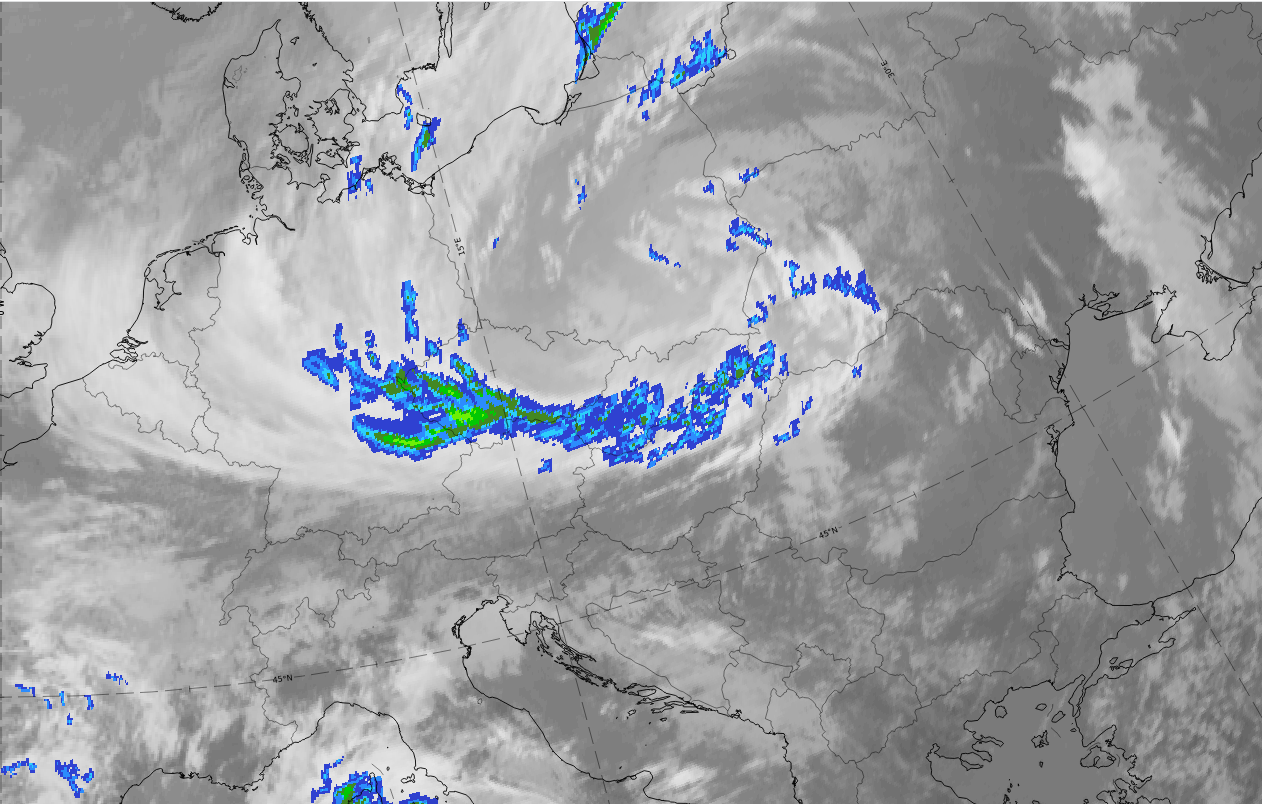
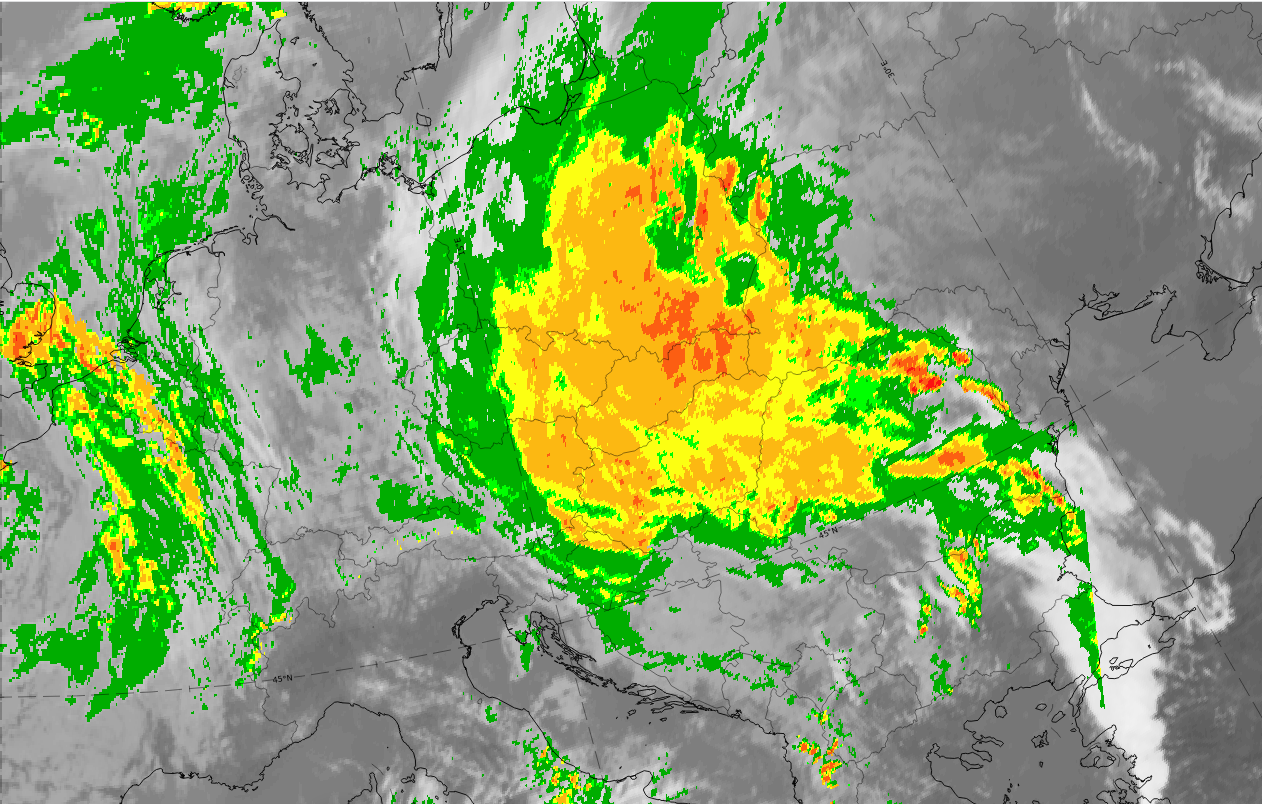
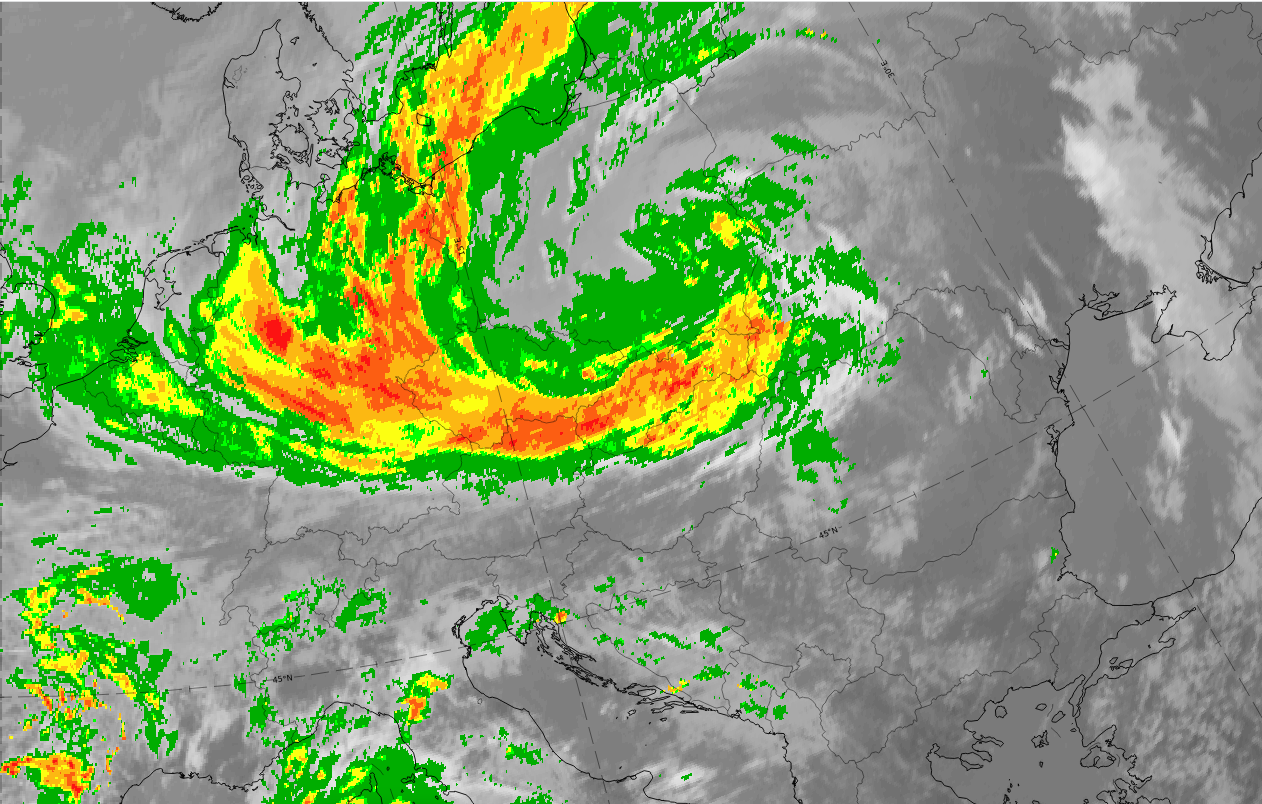
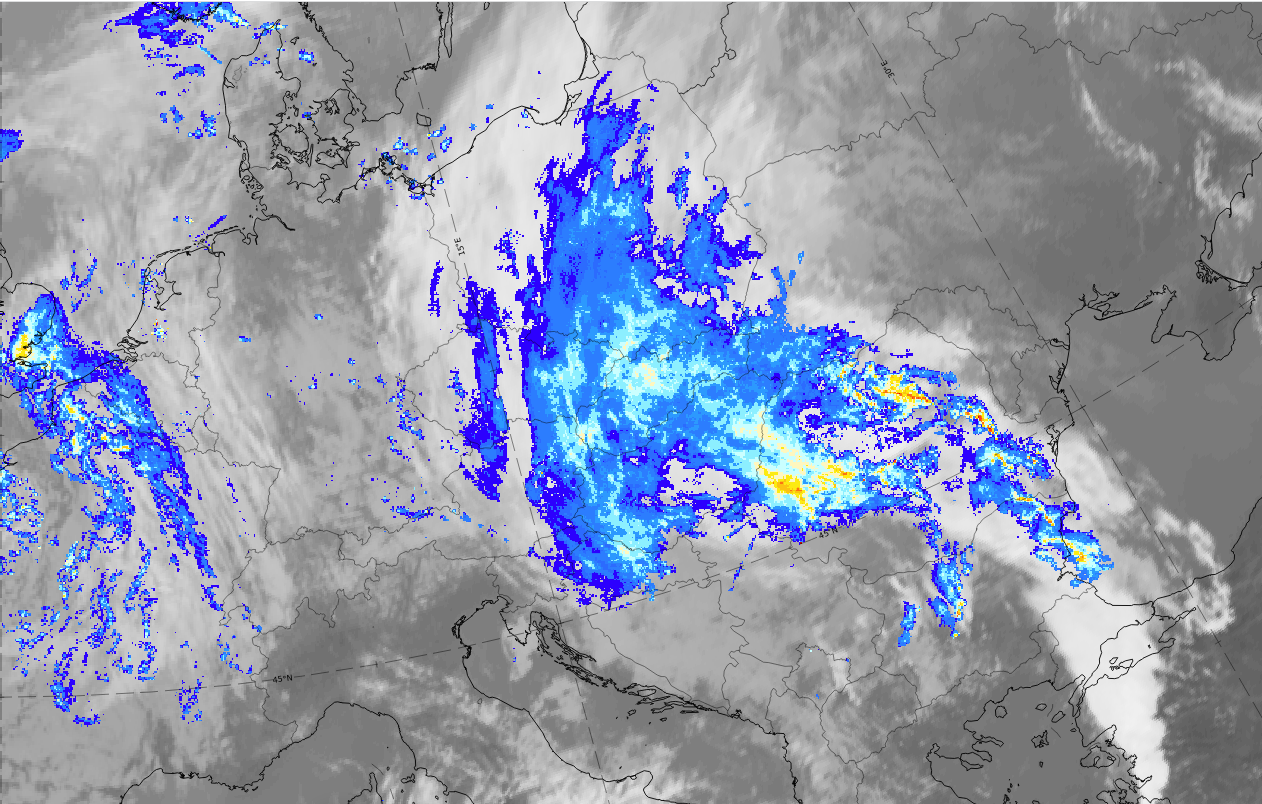
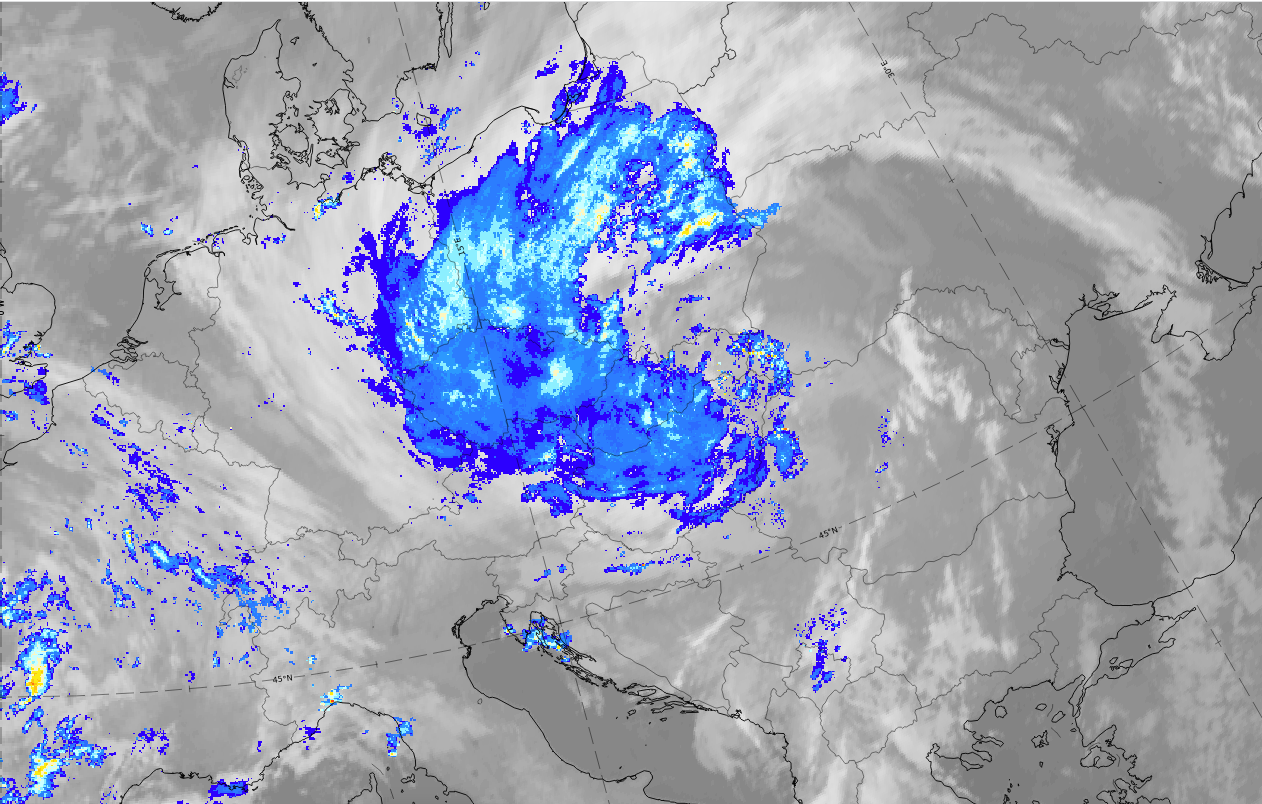
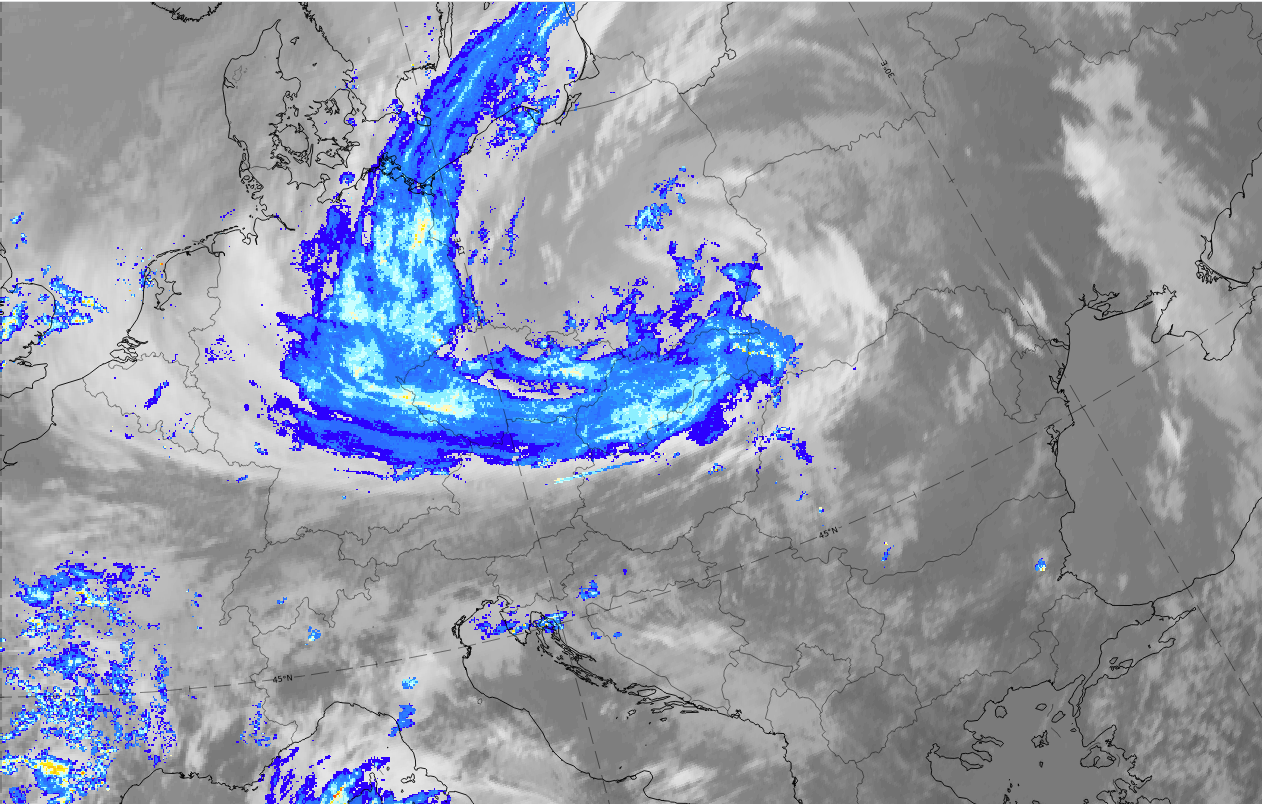
Legend: 13-14 October 2020, IR; Opera Radar system.
U.l.: 06 on 13 October 2020, Wave stage; u.r.: 12 UTC on 13 October 2020, Intensification stage; 00 UTC on 14 October 2020, Mature stage; 12 UTC on 14 October 2020, Dissipation stage.
Note: To enlarge the image, click on it.
Note: To access the gallery of individual images click here
Precipitation is shown in the following three parameters:
- Convective rainfall rate (CRR) from NWCSAF
- Precipitating clouds (PC) from NWCSAF
- Radar intensity from the Opera Radar System.
The parameter PC, which represents non-showery precipitation has reasonable values only at 12 UTC; CRR shows only showery precipitation, while the radar system does not differentiate between these two kinds of precipitation.
The largest areas of precipitation occur in the stages with a cloud bulge: the Wave stage and the Intensification stage. In these stages the convective rain appears more in the transition region between cold front and the wave bulge. In the stages with occlusion cloud spirals, the Mature stage and the Dissipation stage, rainfall intensity decreases overall and the convective rainfall is concentrated on the inner part of the occlusion spiral.