Cloud Structure In Satellite Images
The main cloud features and their changes during the development stages of a Polar Front Theory cyclogenesis are discussed here. Detailed descriptions are provided in the "Wave" and "Occlusion" CMs.
The Polar Front Theory defines 5 development stages defined for a cyclogenesis process according
- Initial stage
- Wave stage
- Intensification stage
- Mature stage
- Dissipation stage
However, in this manual the starting point is the satellite images, and - as the air mass boundary in the "Initial stage" is sometimes cloud-free or accompanied by randomly arranged cloud patches without any typical structure - it will not be treated in this and the following chapters. Schematics and cases representing the process will start from the Wave stage, where cloud systems have already developed and can be seen with their typical structure in the satellite images.

Appearance in the basic channels:
- Cloud Configurations:
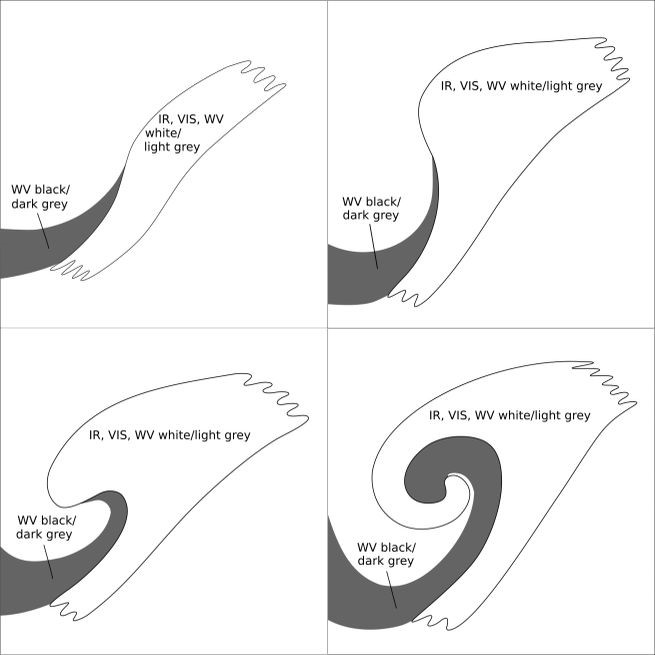
- The "Wave stage" is characterised by a convex cloud bulge at the rear of the cold front cloud band and ahead of the warm front cloud band, where the two fronts meet. In the Intensification stage, this bulge becomes more and more pronounced.
- The occlusion process leads to the development of a spiral cloud band, which is spirals more and more from the Mature stage to the Dissipation stage.
- Structures and patterns:
- The cloud configurations consist of thick clouds with colour gradations from light grey to white in all three basic channels. The details are described in the "Wave" and "Warm Conveyor Belt Occlusion" CMs.
- In the WV image, a dark to black stripe can be seen at the rear of the cold front band, reaching from north-western areas to the southern/south-western edge of wave bulge and, after further development, into the centre of the occlusion spiral. It represents very dry air in the upper levels of the troposphere.
Appearance in the basic RGBs:
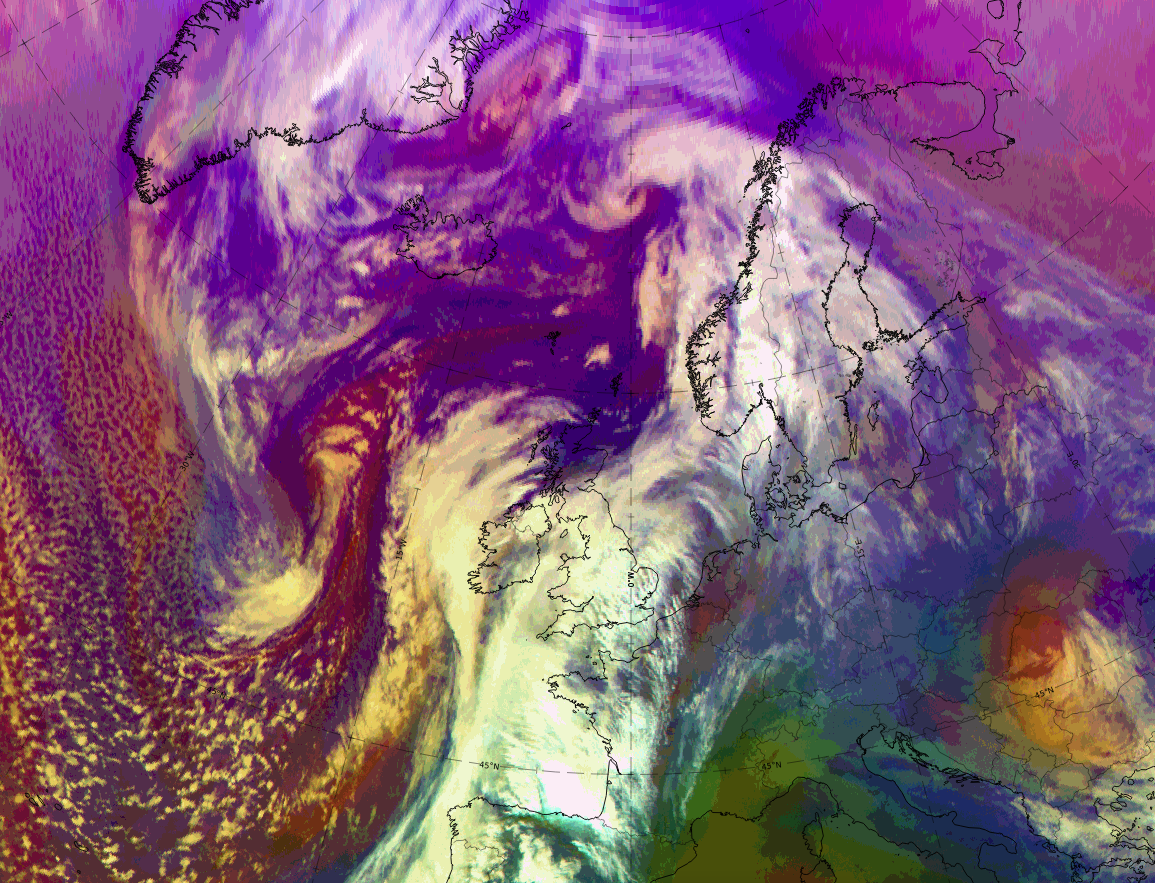
The RGB that best shows the cyclogenesis process is the Airmass RGB
- The main feature is the dark brown stripe, representing cold and very dry, mostly stratospheric air from the north origin sinking south- and south-eastward and becoming finally involved into the cyclogenesis process.
- During the Wave stage, it streams along the edge of the cold front to the area of the cloud bulge where the low centre is developing. In the Mature stage, while becoming wider, the dark brown area spreads into the centre of the growing occlusion spiral.
- The cloud system structures appear similar to their appearance in the basic IR channel.
- The area surrounding the cloud configurations appears in blue colours, representing cold air, and can contain other cold air cloud features.
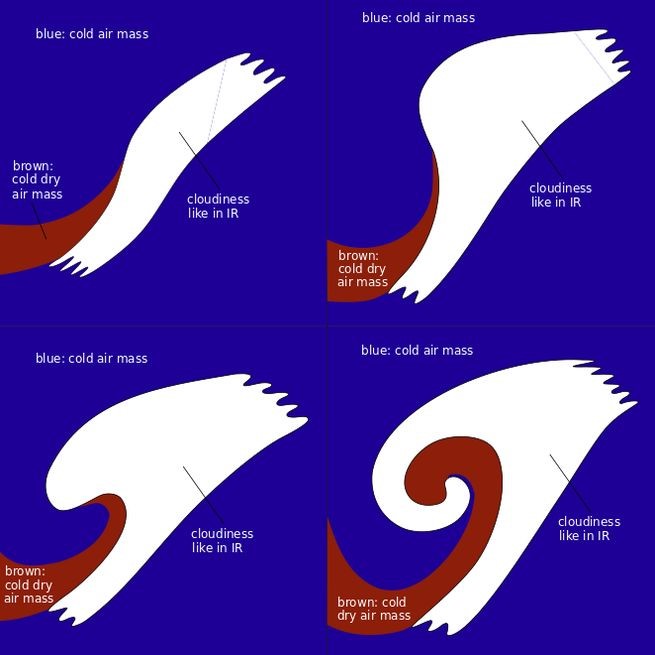
Legend: Schematics for the Airmass RGB
This case from 20-21 February 2021 shows a secondary cyclogenesis, which develops at a cold front over the Atlantic to the west of Ireland and the British Isles and moves northward over Scotland into the Norwegian Sea. In the beginning of the sequence there is a double structure of two fronts, which merge between Wave and Intensification stages.
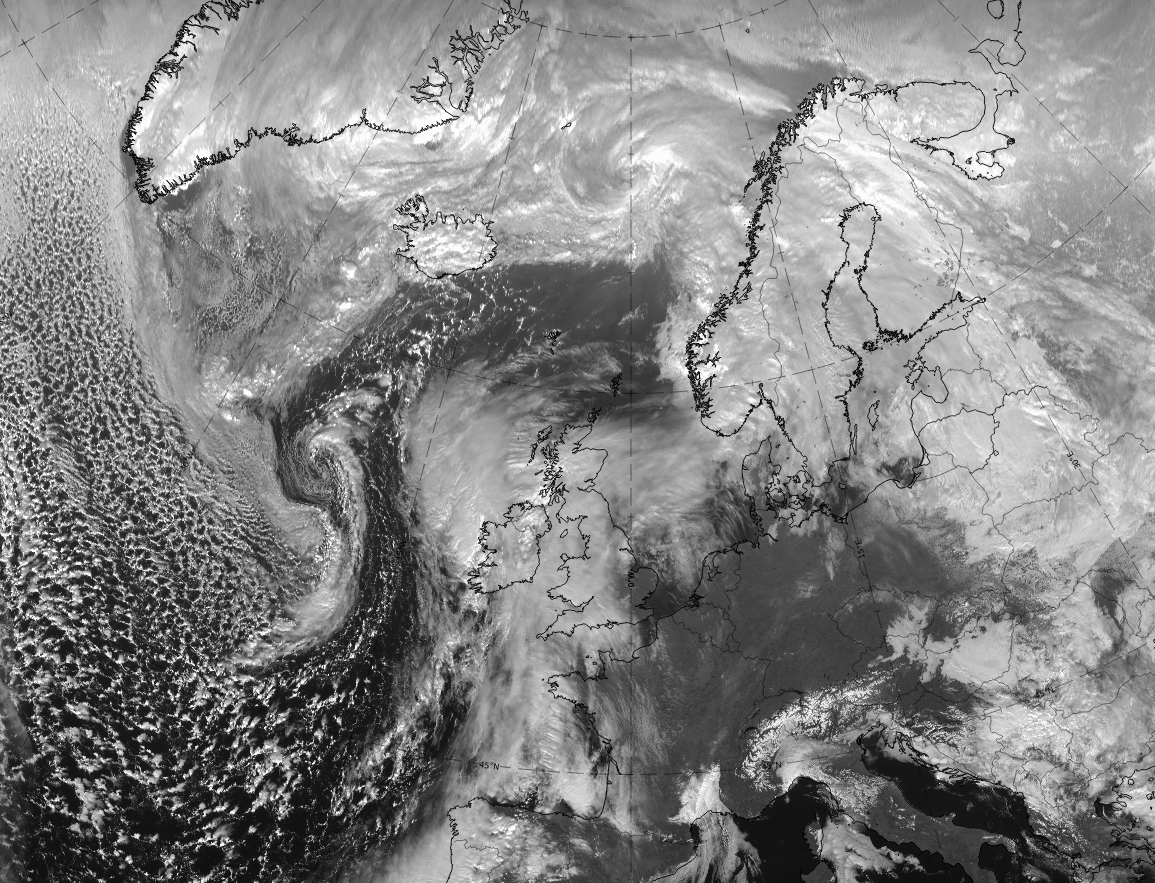
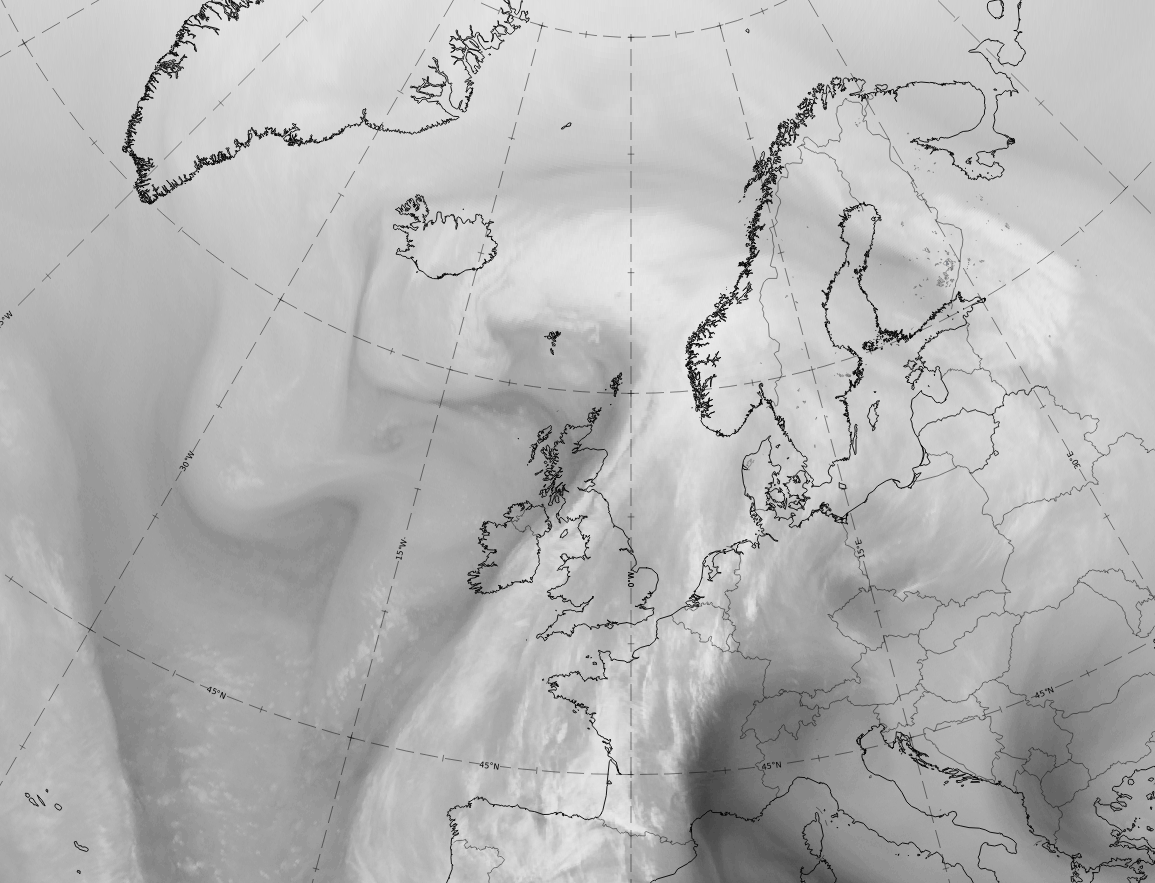
Legend: 20-21 February 2021, IR.
U.l.: 09 UTC on 20 February 2021, Wave stage; u.r.: 12 UTC on 20 February 2021, Intensification stage; l.l: 00 UTC on 21 February 2021, Mature stage; 12 UTC on 21 February 2021, Dissipation stage.
Note: To enlarge the image, click on it.
Note: To access the gallery of individual images click here

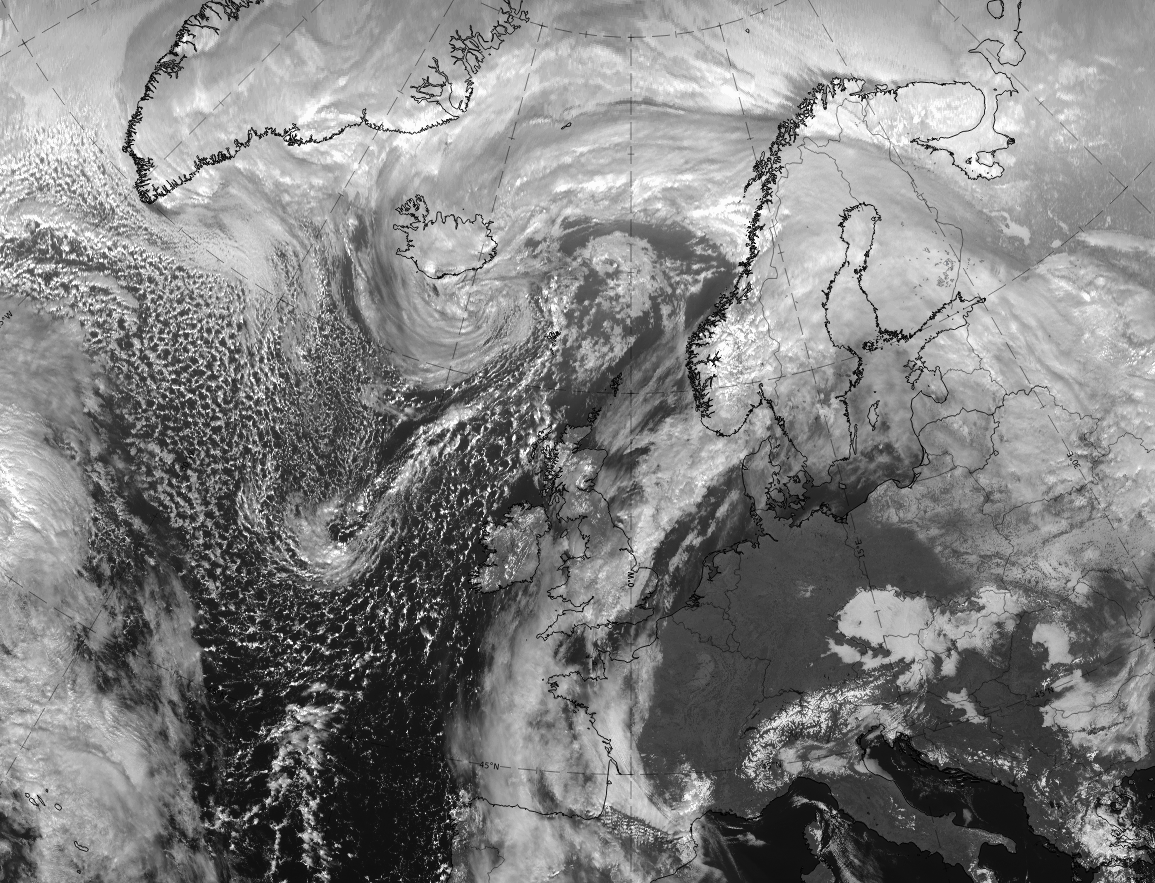
Legend: 20-21 February 2021, HRV.
U.l.: 9 UTC on 20 February 2021, Wave stage; u.r.: 12 UTC on 20 February 2021, Intensification stage; l.r.: 12 UTC on 21 February 2021, Dissipation stage.
Note: To enlarge the image, click on it.
Note: To access the gallery of individual images click here
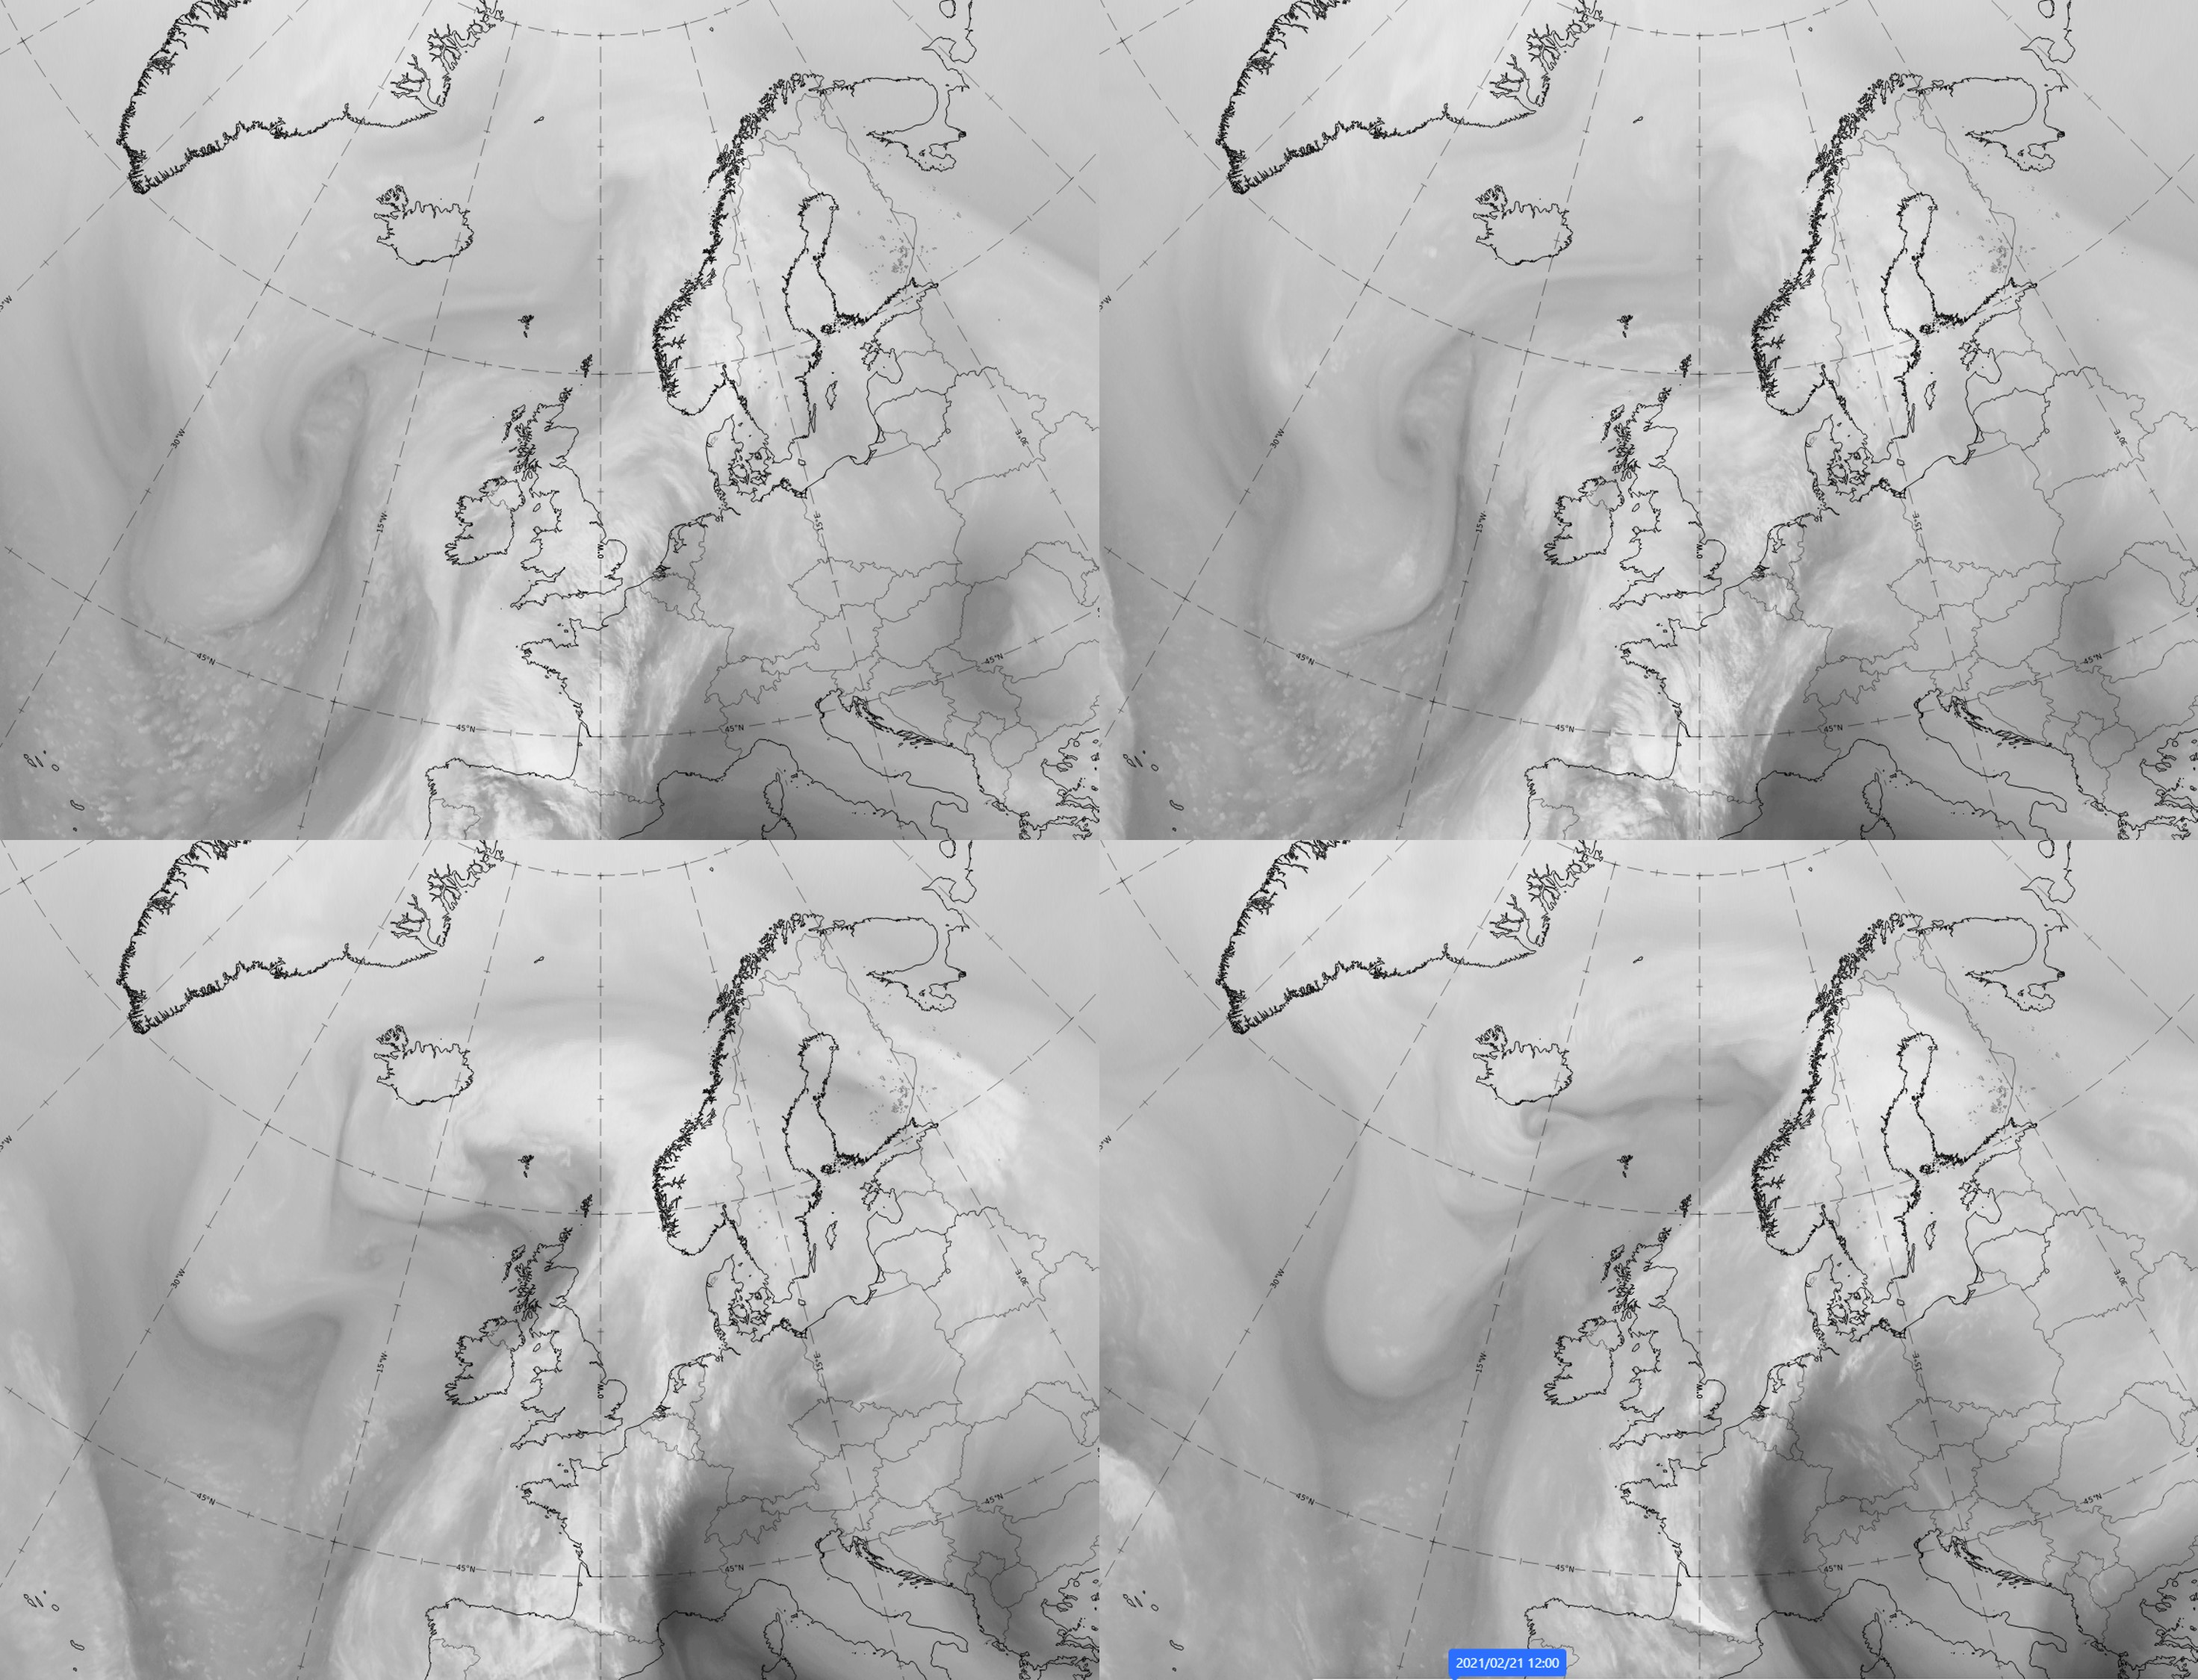
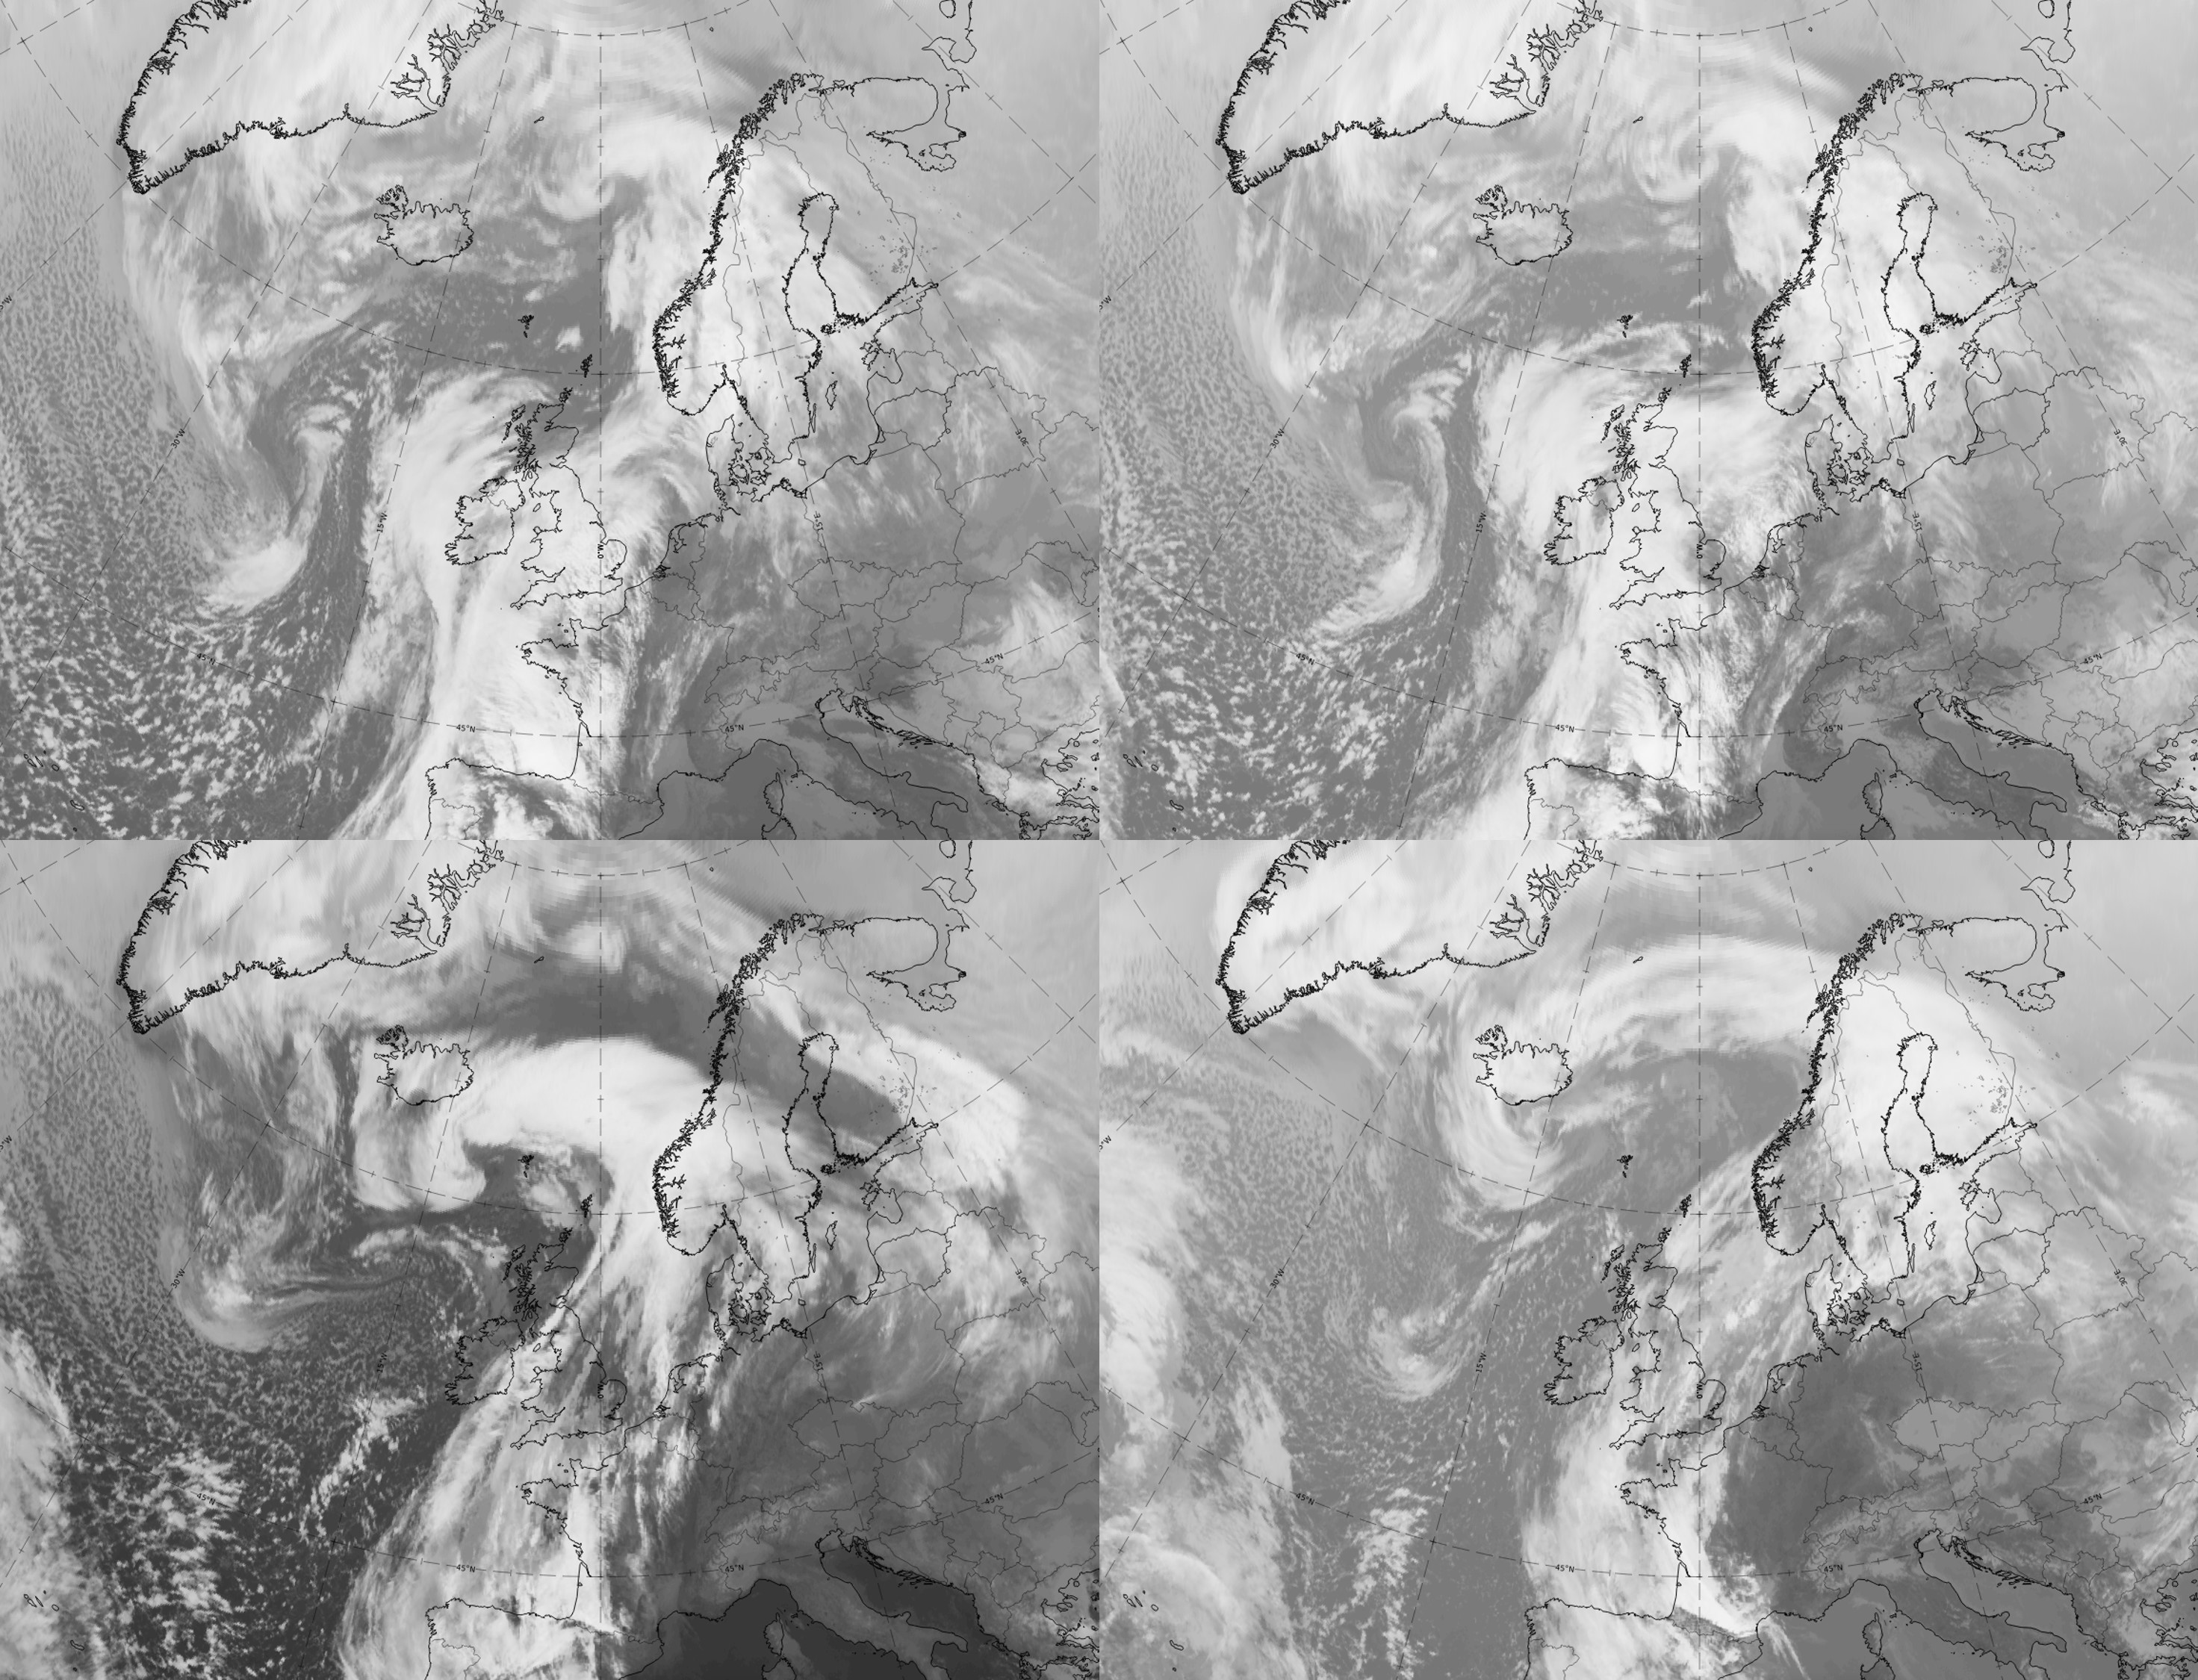
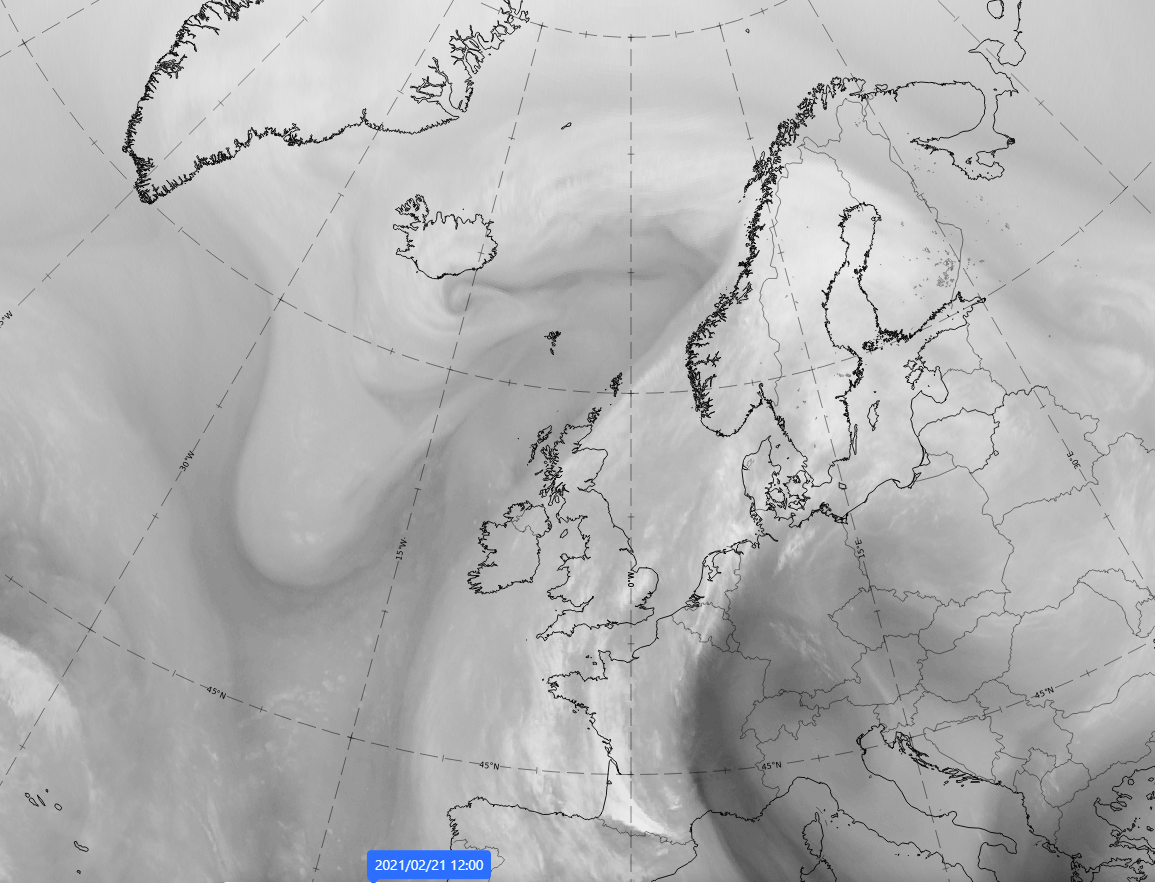
Legend: 20-21 February 2021, WV.
U.l.: 9 UTC on 20 February 2021, Wave stage; u.r.: 12 UTC on 20 February 2021, Intensification stage; 00 UTC on 21 February 2021, Mature stage; 12 UTC on 21 February 2021, Dissipation stage.
Note: To enlarge the image, click on it.
Note: To access the gallery of individual images click here
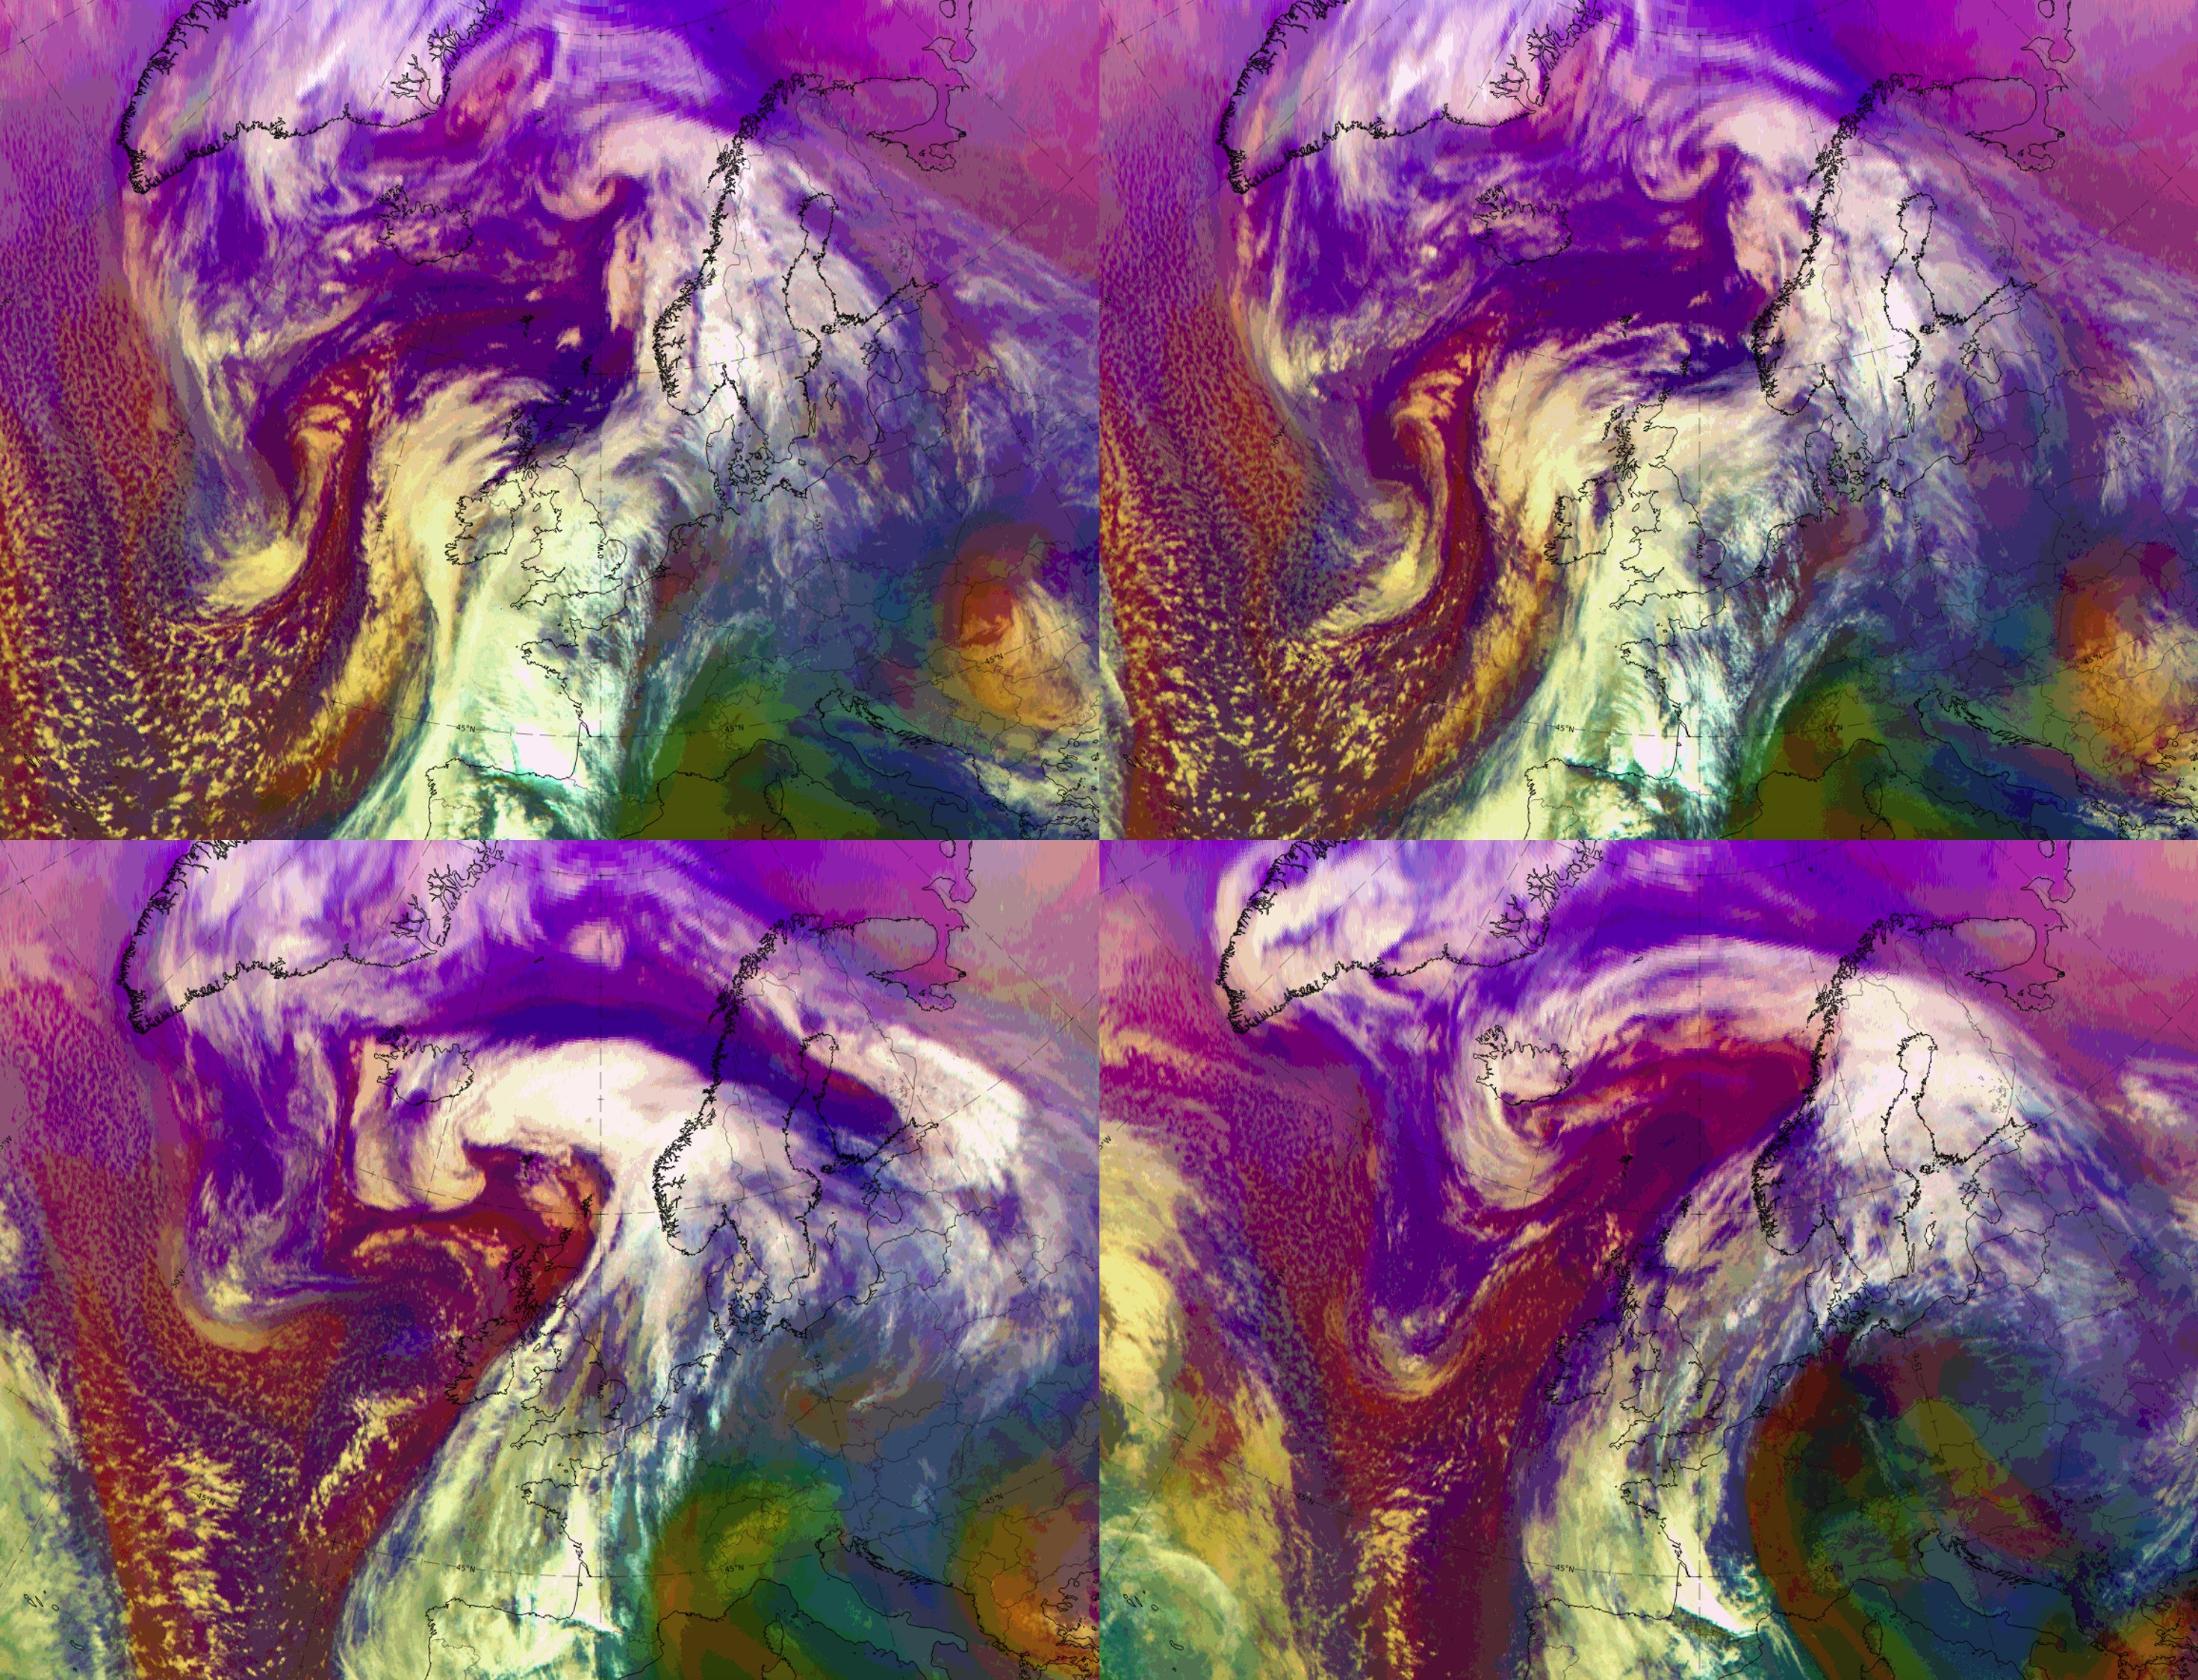
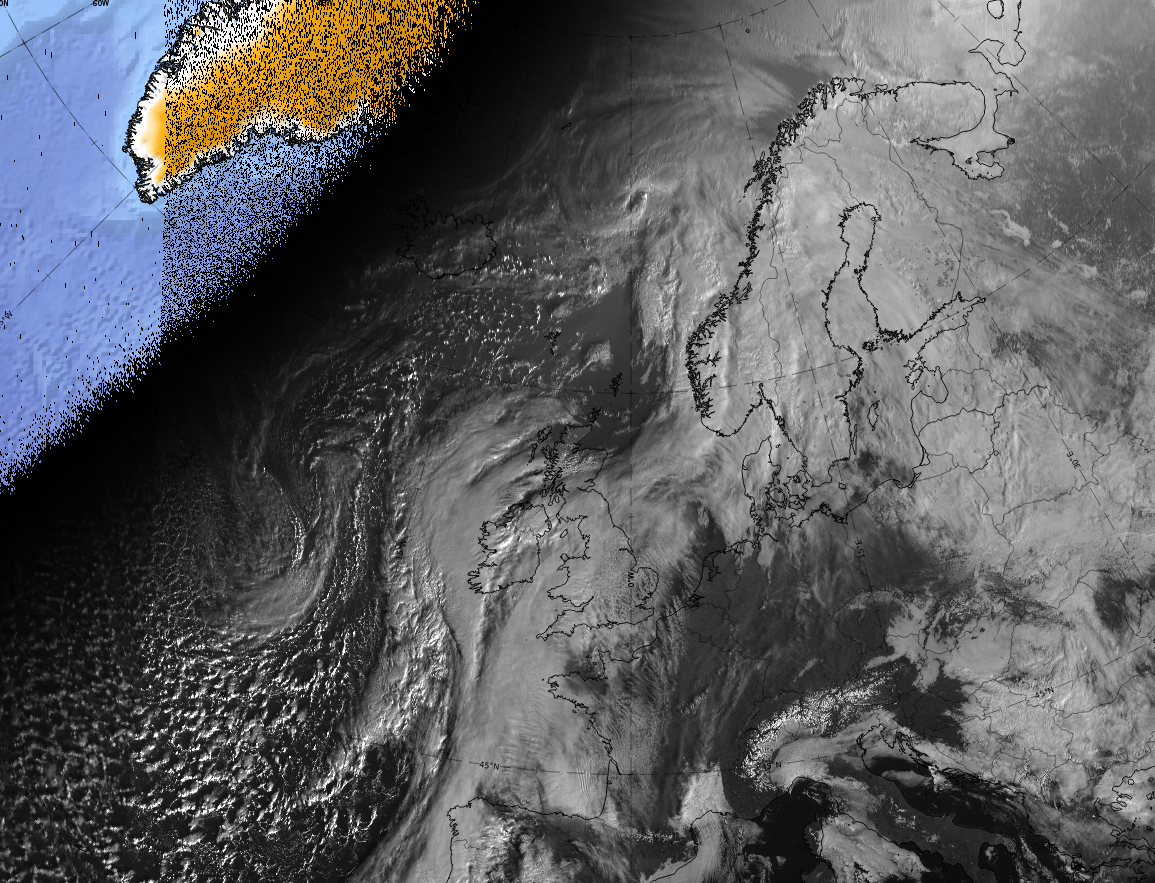
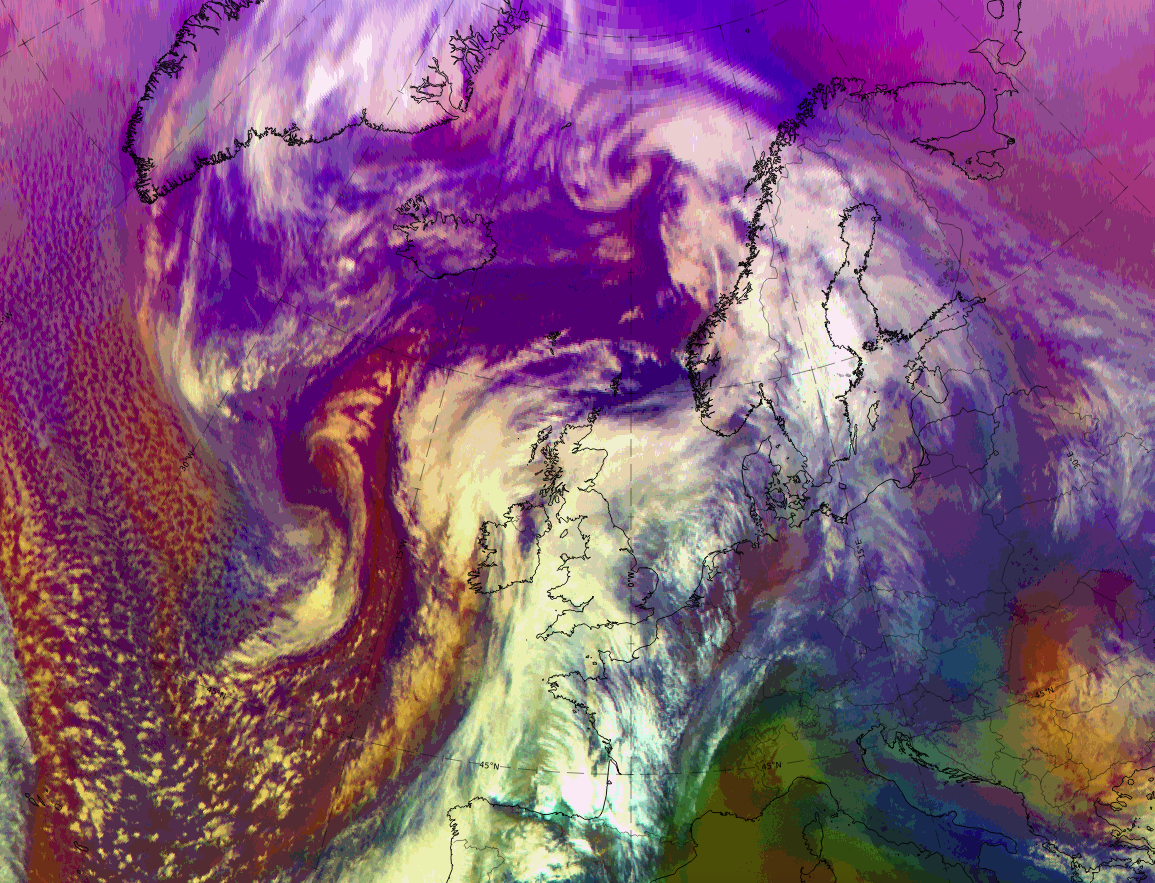
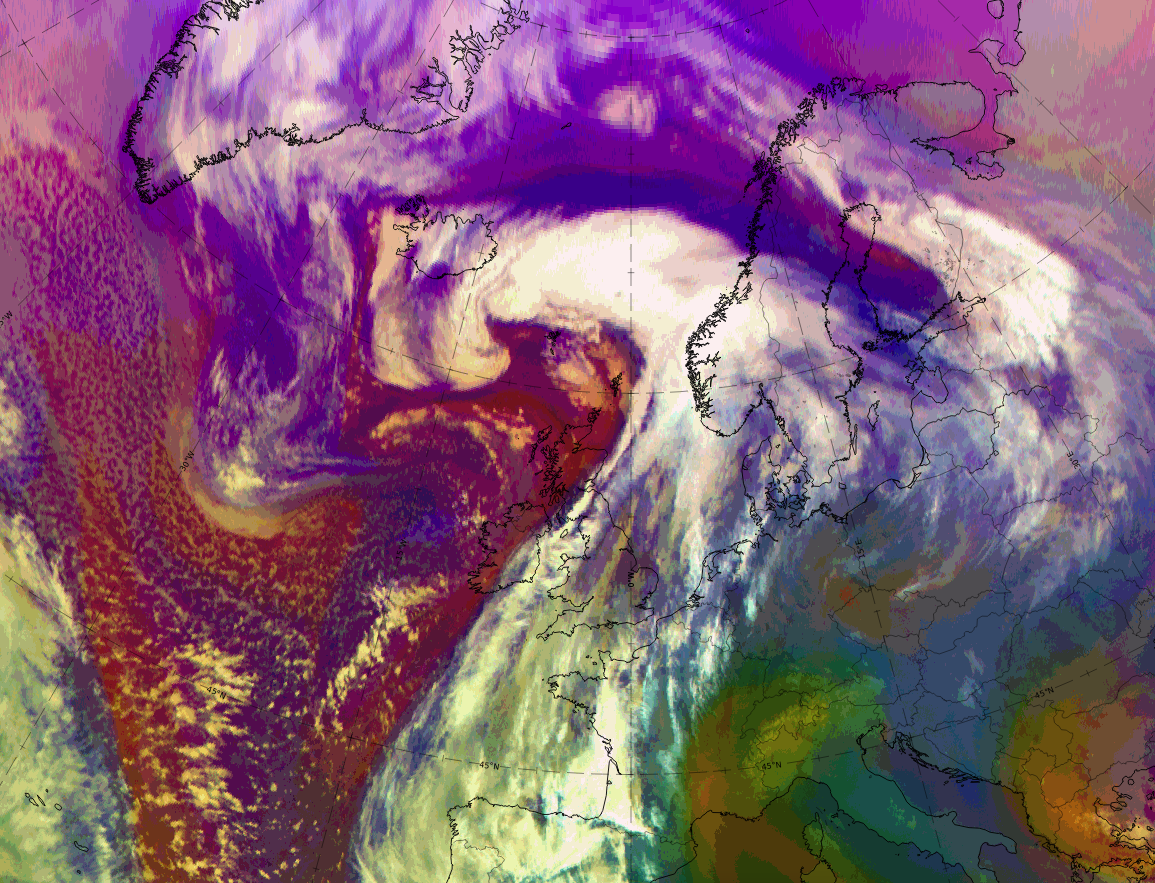
Legend: 20-21 February 2021, Airmass RGB.
U.l.: 9 UTC on 20 February 2021, Wave stage; u.r.: 12 UTC on 20 February 2021, Intensification stage; 00 UTC on 21 February 2021, Mature stage; 12 UTC on 21 February 2021, Dissipation stage.
Note: To enlarge the image, click on it.
Note: To access the gallery of individual images click here
| IR | Both the Wave and Intensification stages show a bright cloud bulge, representing cold cloud tops. In the Wave stage, two frontal systems are just merging with the wave bulge at the western system; in the Intensification stage the cloud bulge has become broader. The Mature stage shows a very bright cloud spiral; this spiral is larger in the Dissipation stage but less bright and the clouds are partly broken. The innermost part of the cloud spiral close to Iceland seems to split off from the eastern part. |
| HRV | Both the Wave and Intensification stages show very bright values, which, together with the IR image, indicate a thick cloud layer. The Dissipation stage shows the splitting of the huge cloud spiral in the innermost part very well. |
| WV | The most important feature in the WV images is the dark stripe at the rearward edge of cold front and within the cloud spiral; it represents sinking dry air. This case shows such a dark stripe very well, however, there seems to be higher humidity at some levels and there are more structures accompanied by dark stripes to the west. These represent a different cloud system, for instance a comma configuration. |
| Airmass RGB | The most important features, indicating dry, possibly stratospheric air, are represented as dark-brown stripes and areas. |