Table of Contents
Cloud Structure In Satellite Images
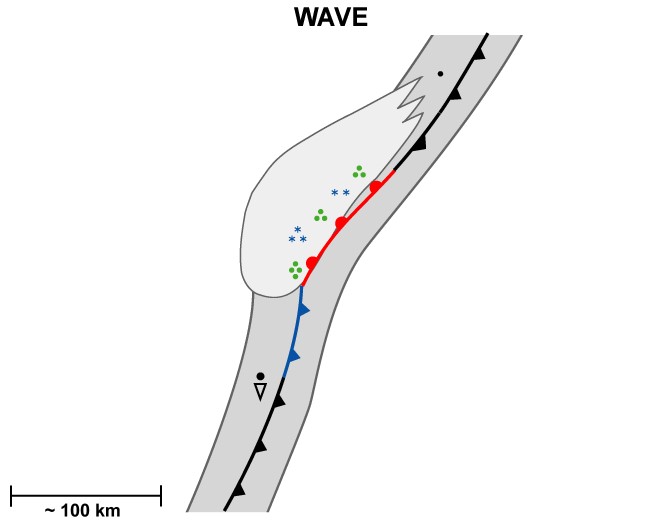
The main cloud features and their changes during the development stages of a Polar Front Theory cyclogenesis are discussed here. Detailed descriptions are provided in the "Wave" and "Occlusion" CMs.
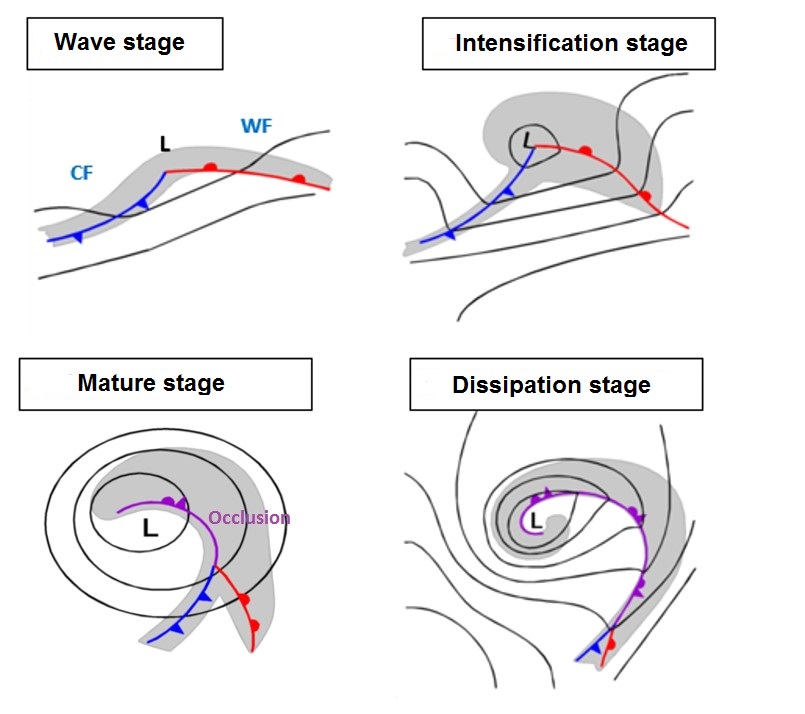
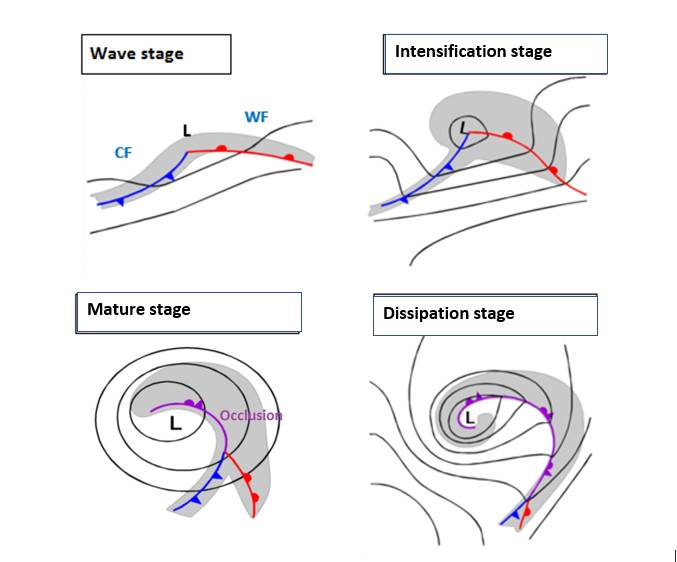
The Polar Front Theory defines 5 development stages defined for a cyclogenesis process according
- Initial stage
- Wave stage
- Intensification stage
- Mature stage
- Dissipation stage
However, in this manual the starting point is the satellite images, and - as the air mass boundary in the "Initial stage" is sometimes cloud-free or accompanied by randomly arranged cloud patches without any typical structure - it will not be treated in this and the following chapters. Schematics and cases representing the process will start from the Wave stage, where cloud systems have already developed and can be seen with their typical structure in the satellite images.

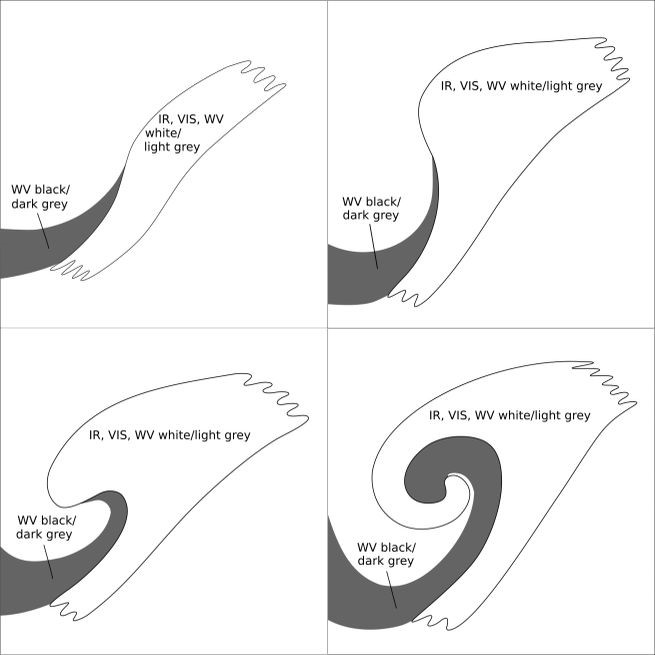
Appearance in the basic channels:
- Cloud Configurations:
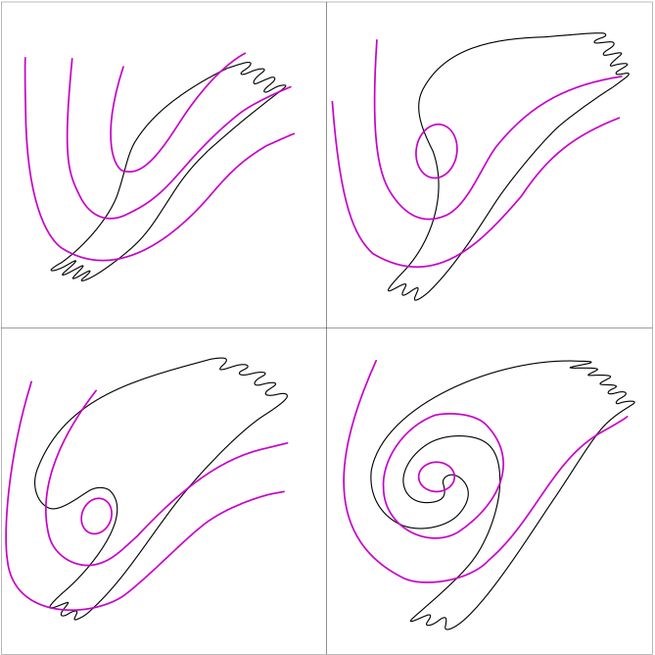
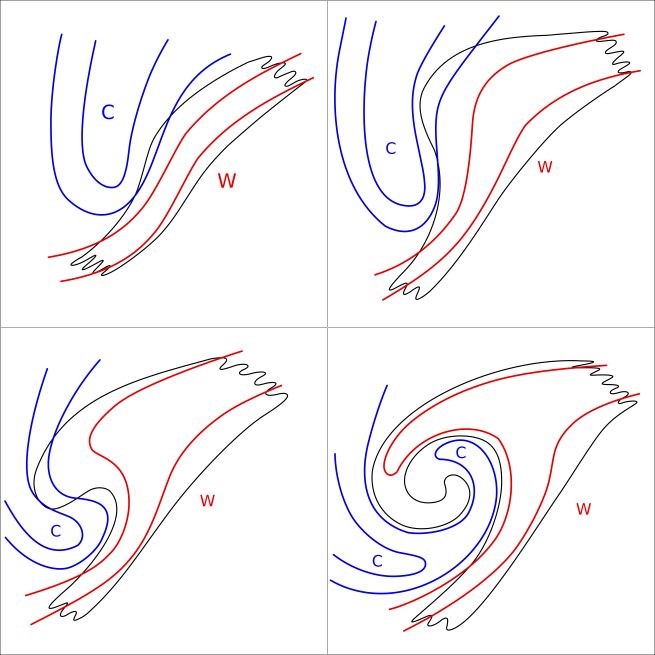
- The "Wave stage" is characterised by a convex cloud bulge at the rear of the cold front cloud band and ahead of the warm front cloud band, where the two fronts meet. In the Intensification stage, this bulge becomes more and more pronounced.
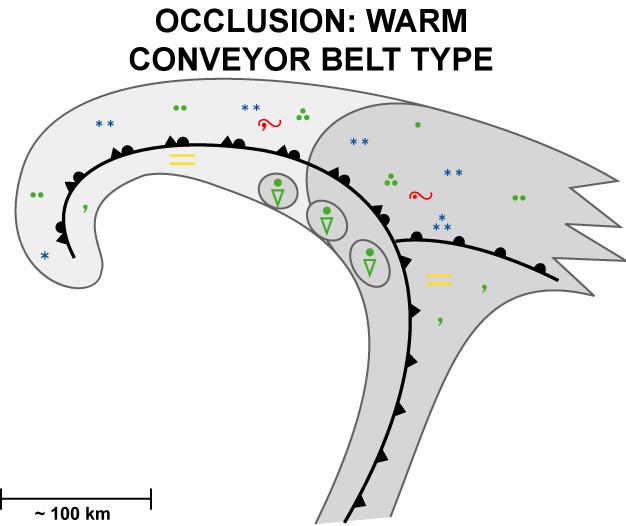
- The occlusion process leads to the development of a spiral cloud band, which is spirals more and more from the Mature stage to the Dissipation stage.
- Structures and patterns:
- The cloud configurations consist of thick clouds with colour gradations from light grey to white in all three basic channels. The details are described in the "Wave" and "Warm Conveyor Belt Occlusion" CMs.
- In the WV image, a dark to black stripe can be seen at the rear of the cold front band, reaching from north-western areas to the southern/south-western edge of wave bulge and, after further development, into the centre of the occlusion spiral. It represents very dry air in the upper levels of the troposphere.
Appearance in the basic RGBs:
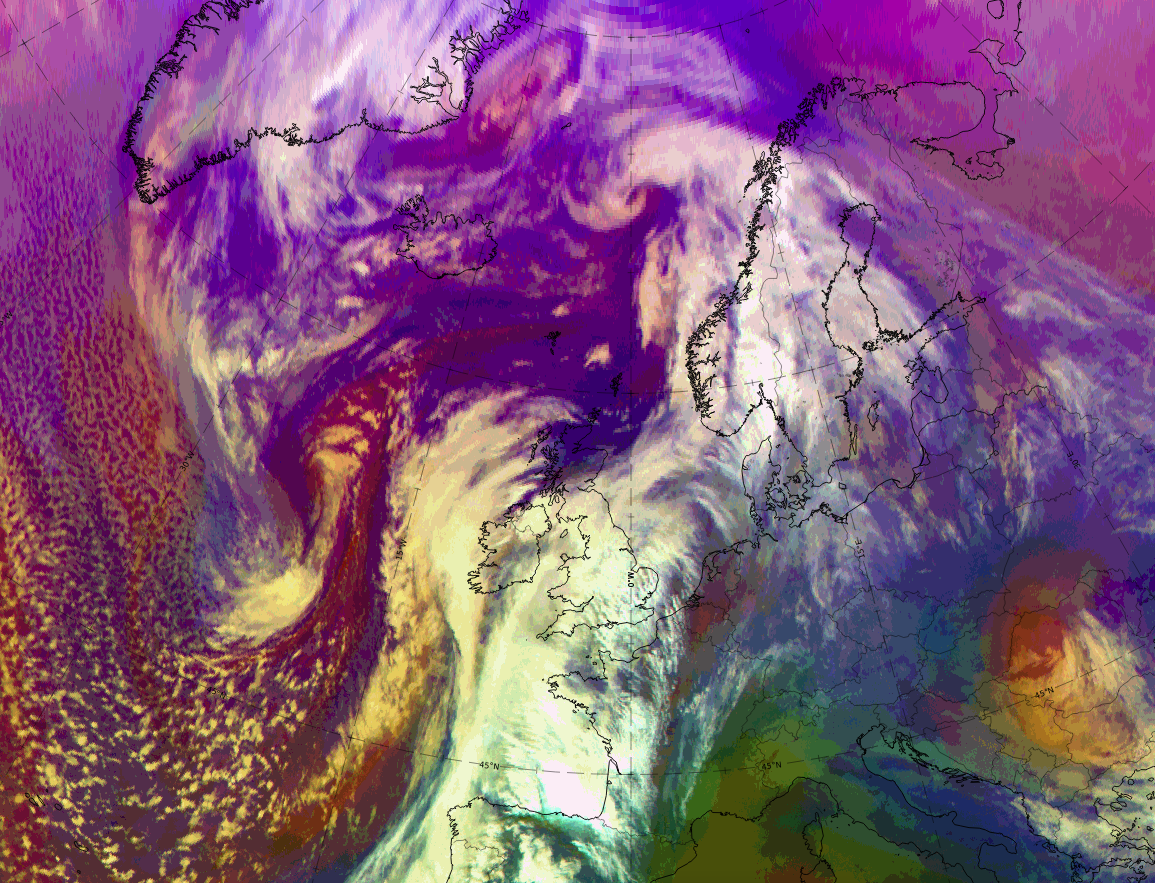
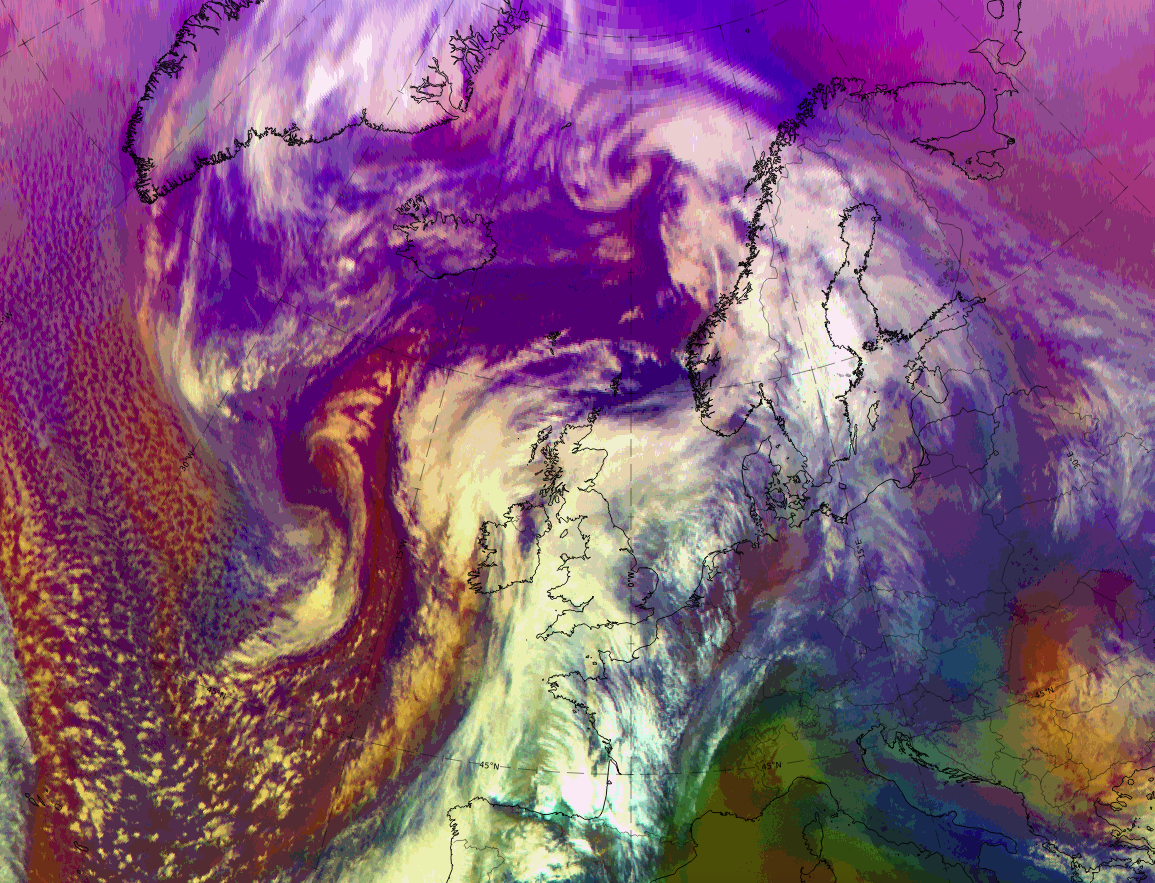
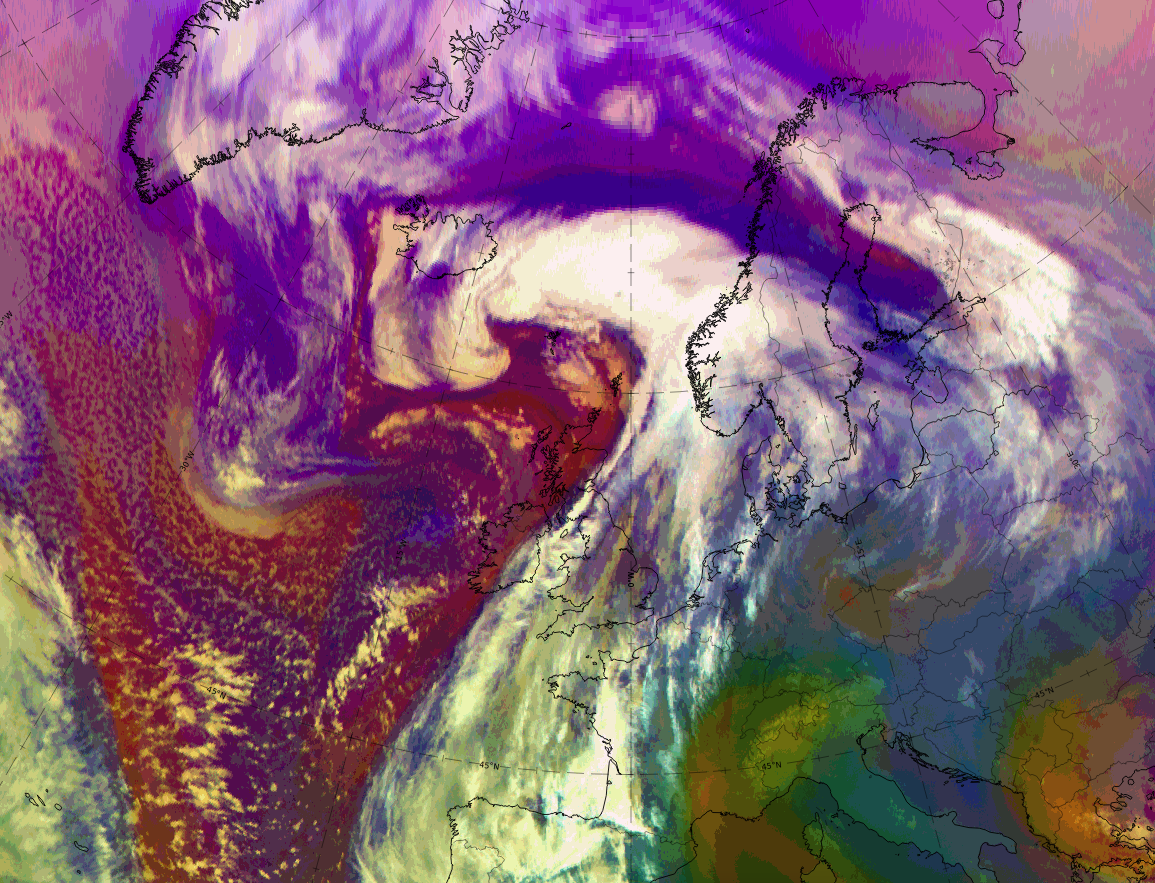
The RGB that best shows the cyclogenesis process is the Airmass RGB
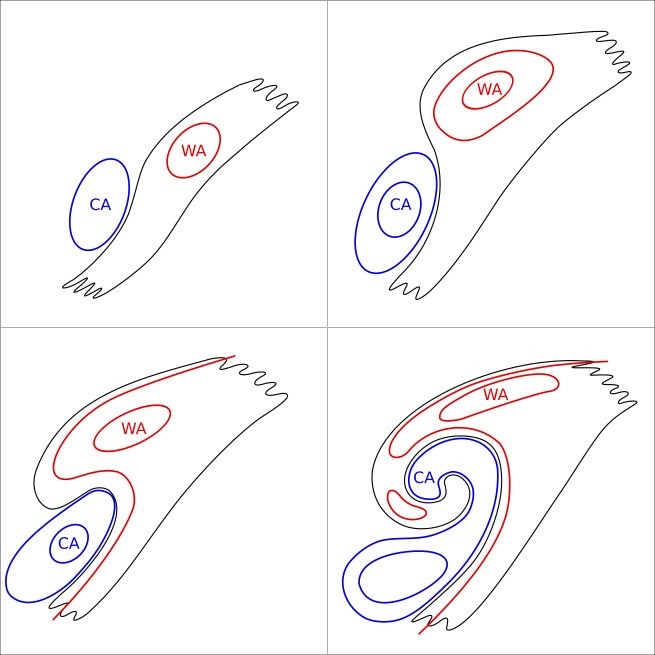
- The main feature is the dark brown stripe, representing cold and very dry, mostly stratospheric air from the north origin sinking south- and south-eastward and becoming finally involved into the cyclogenesis process.
- During the Wave stage, it streams along the edge of the cold front to the area of the cloud bulge where the low centre is developing. In the Mature stage, while becoming wider, the dark brown area spreads into the centre of the growing occlusion spiral.
- The cloud system structures appear similar to their appearance in the basic IR channel.
- The area surrounding the cloud configurations appears in blue colours, representing cold air, and can contain other cold air cloud features.
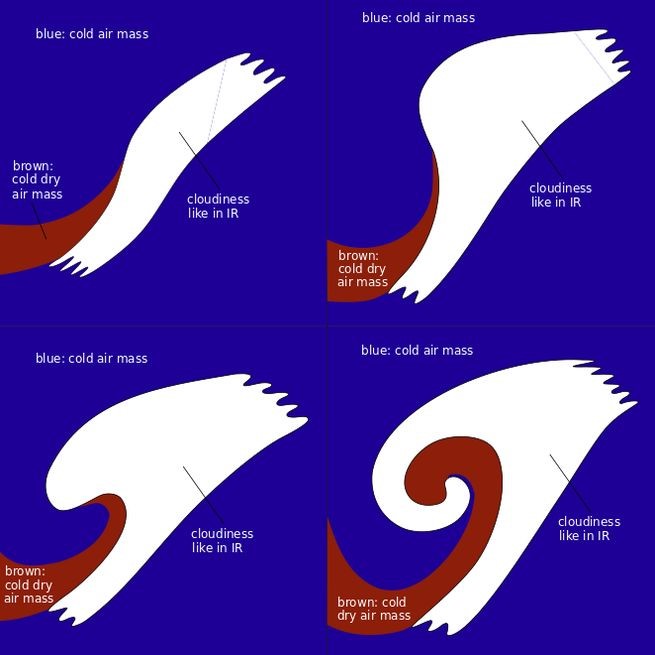
Legend: Schematics for the Airmass RGB
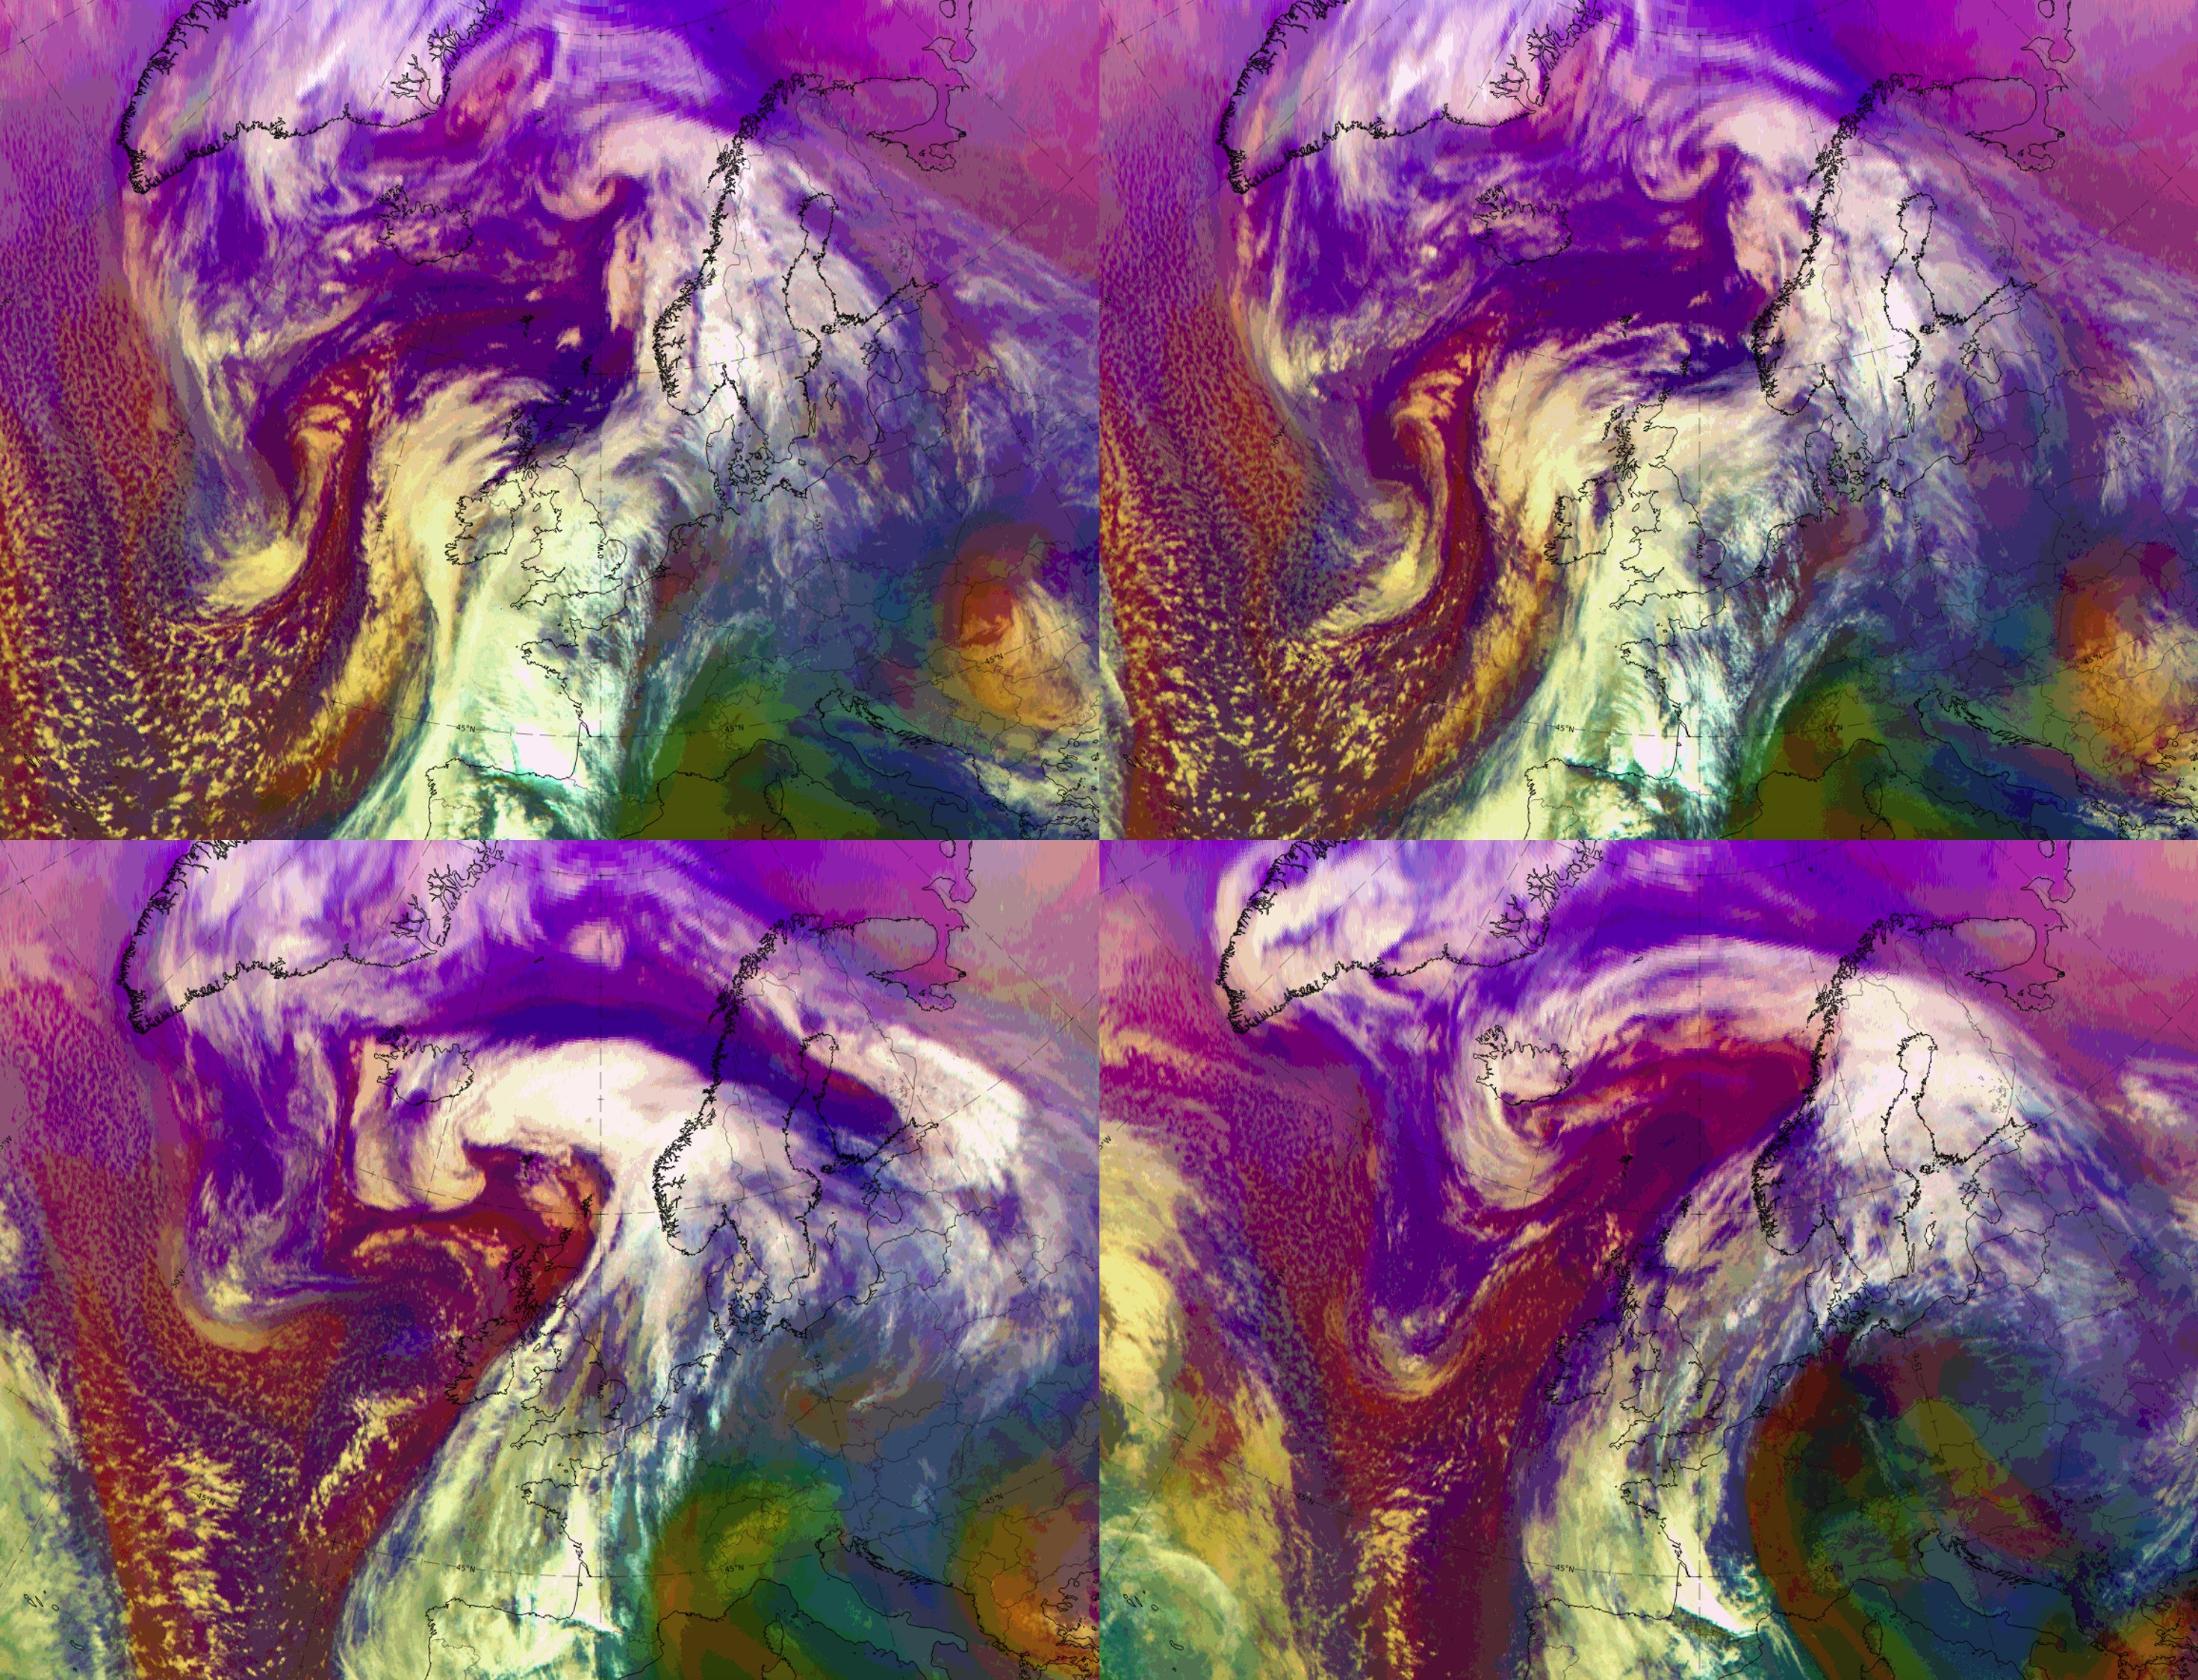
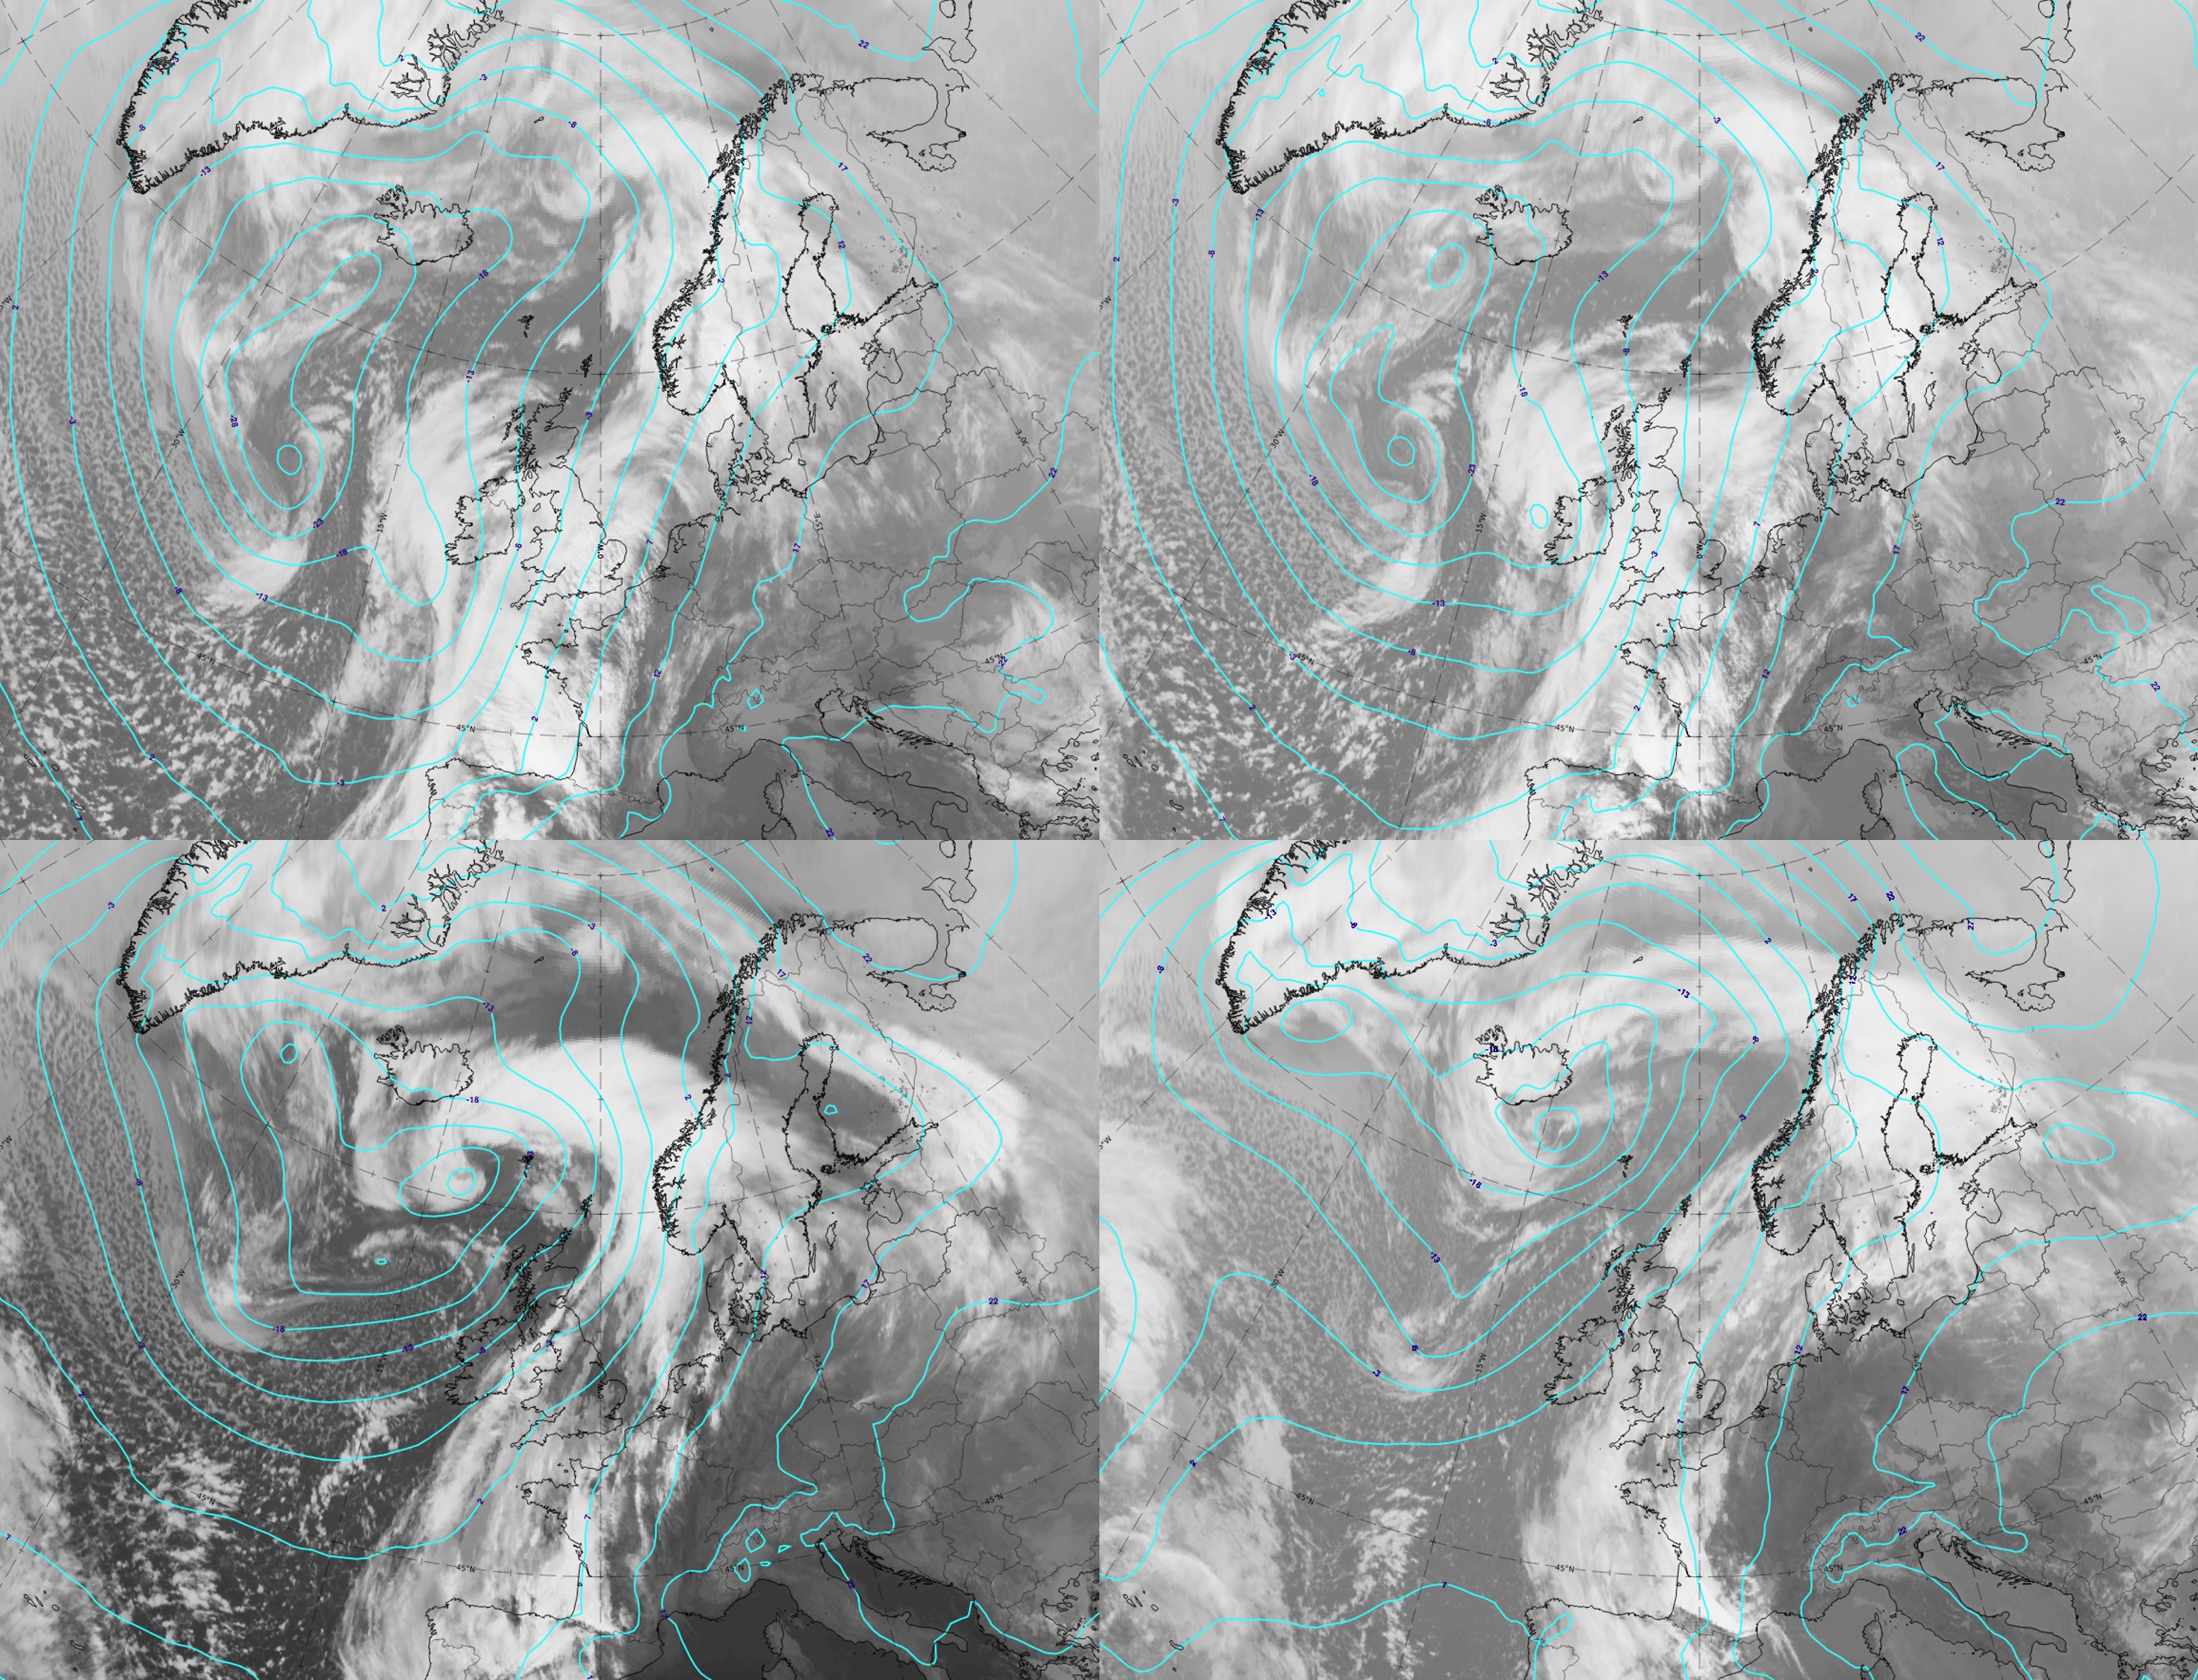
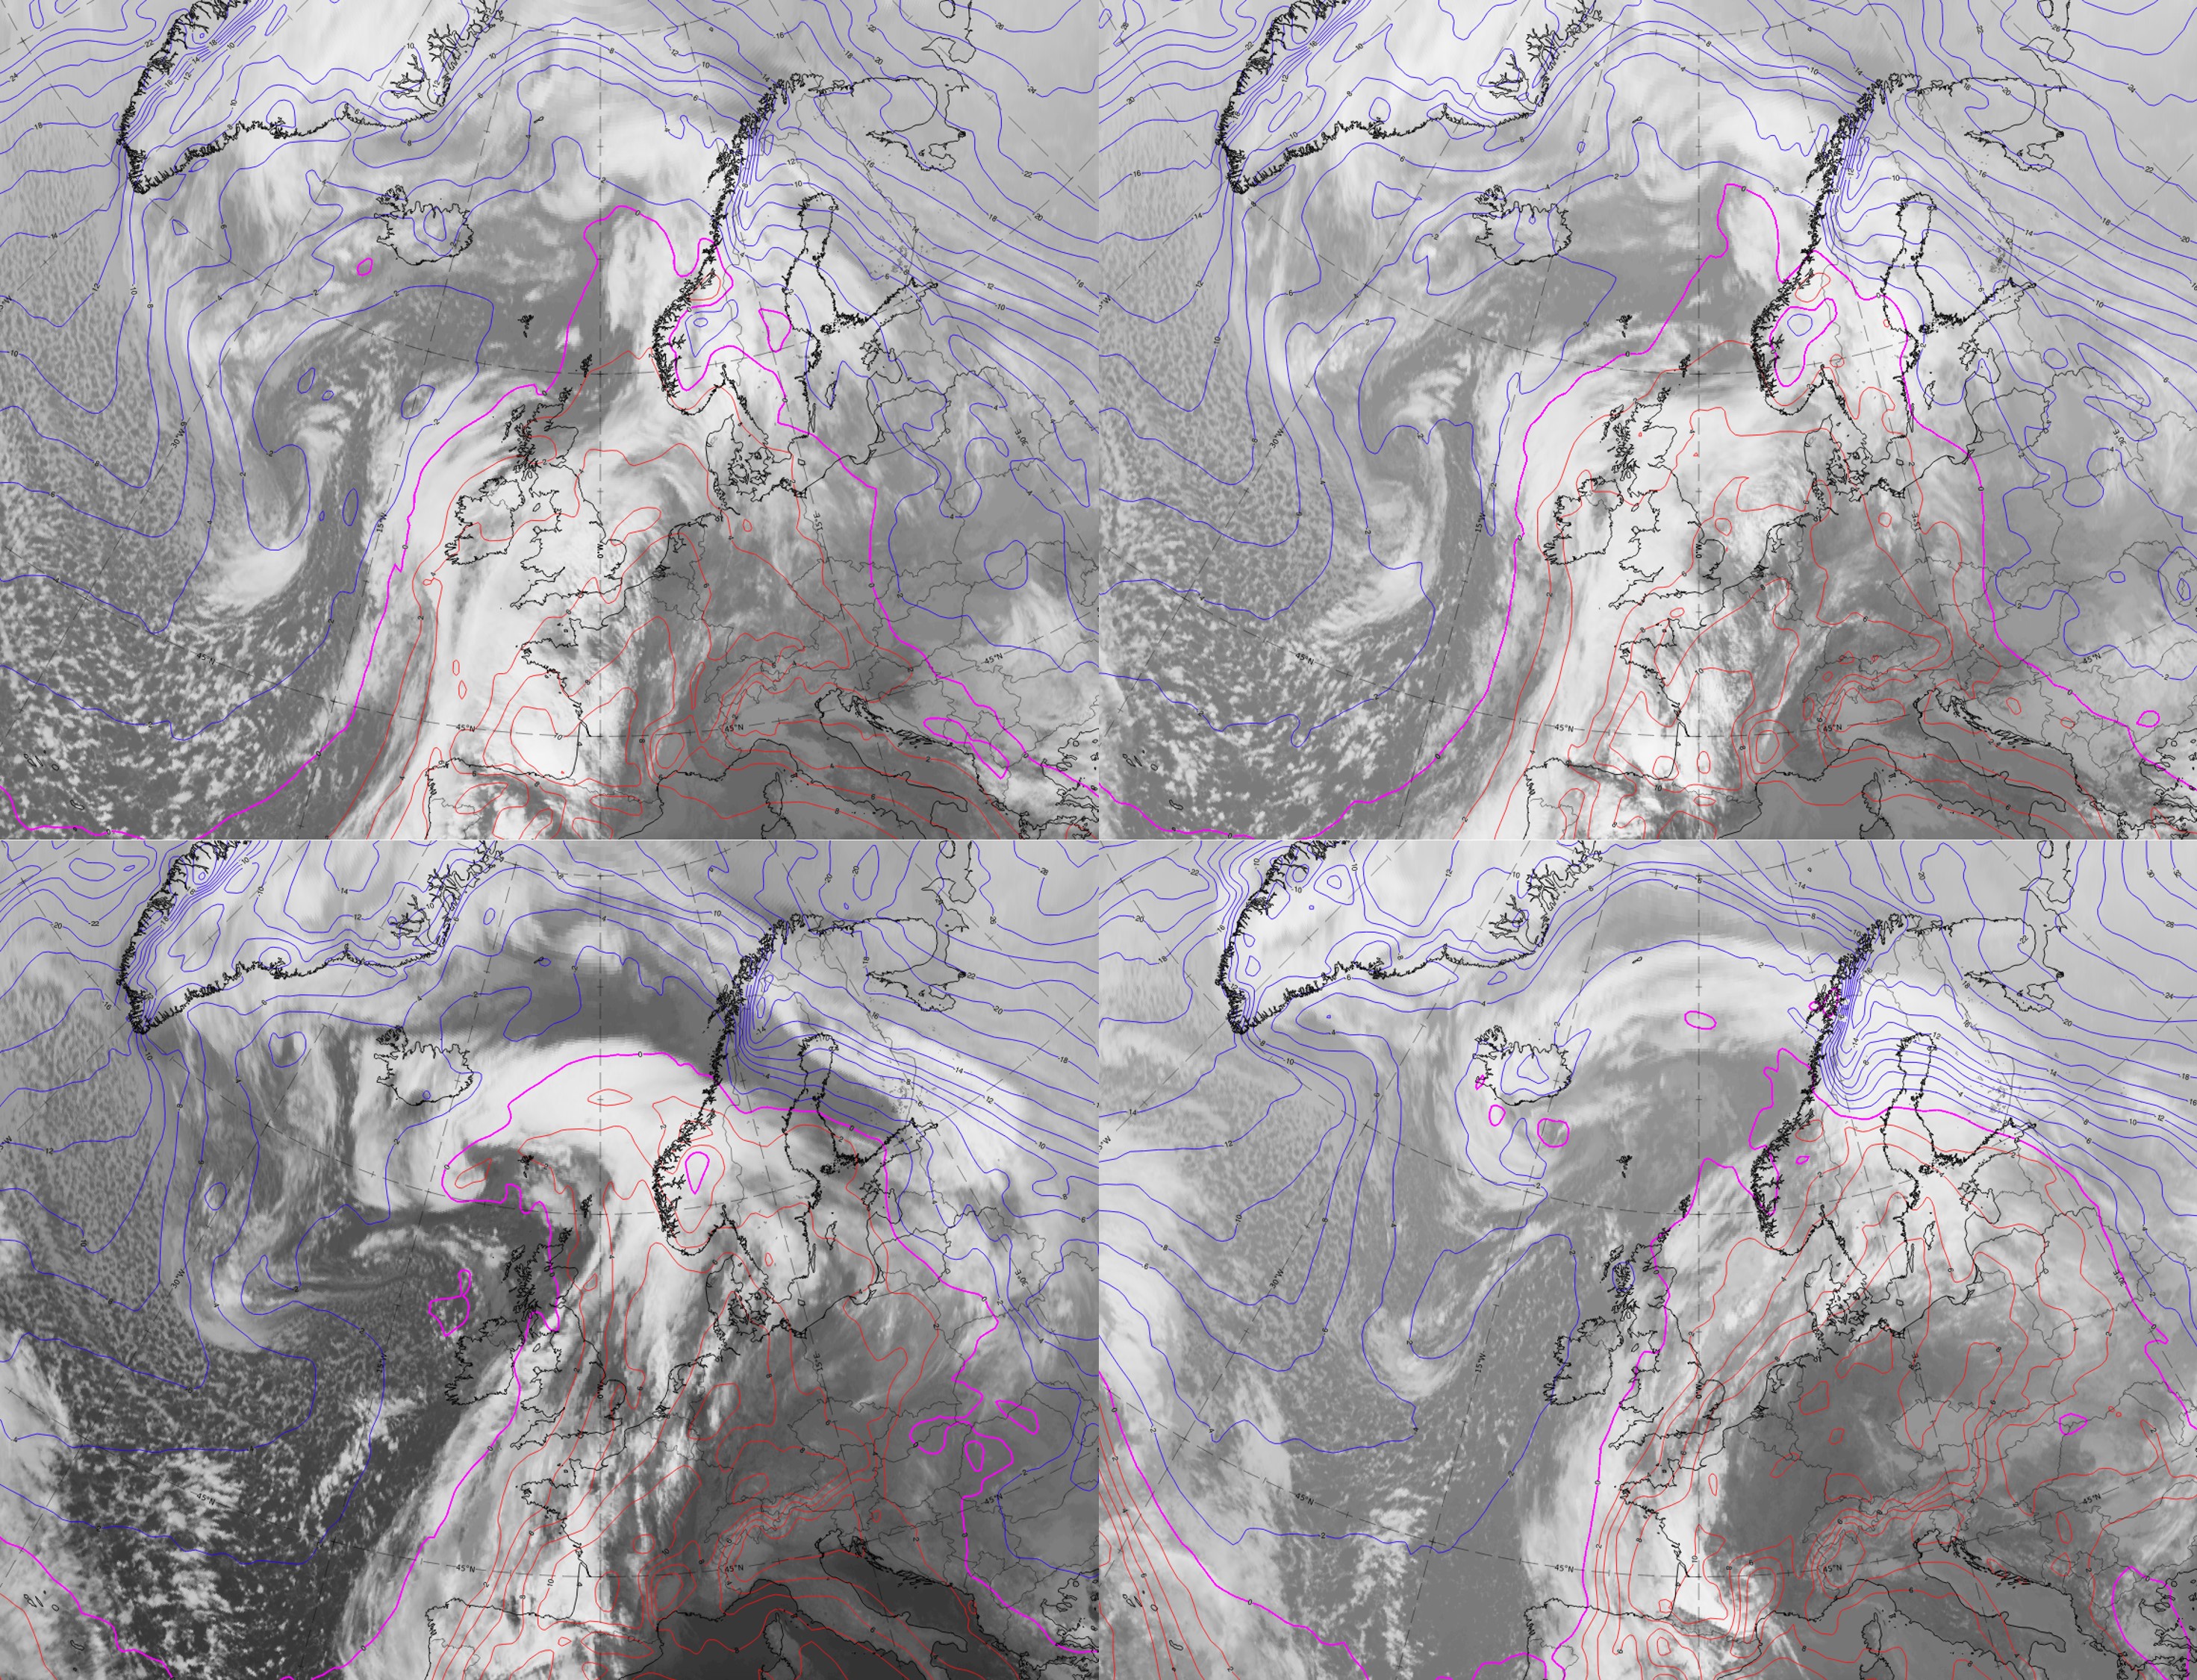
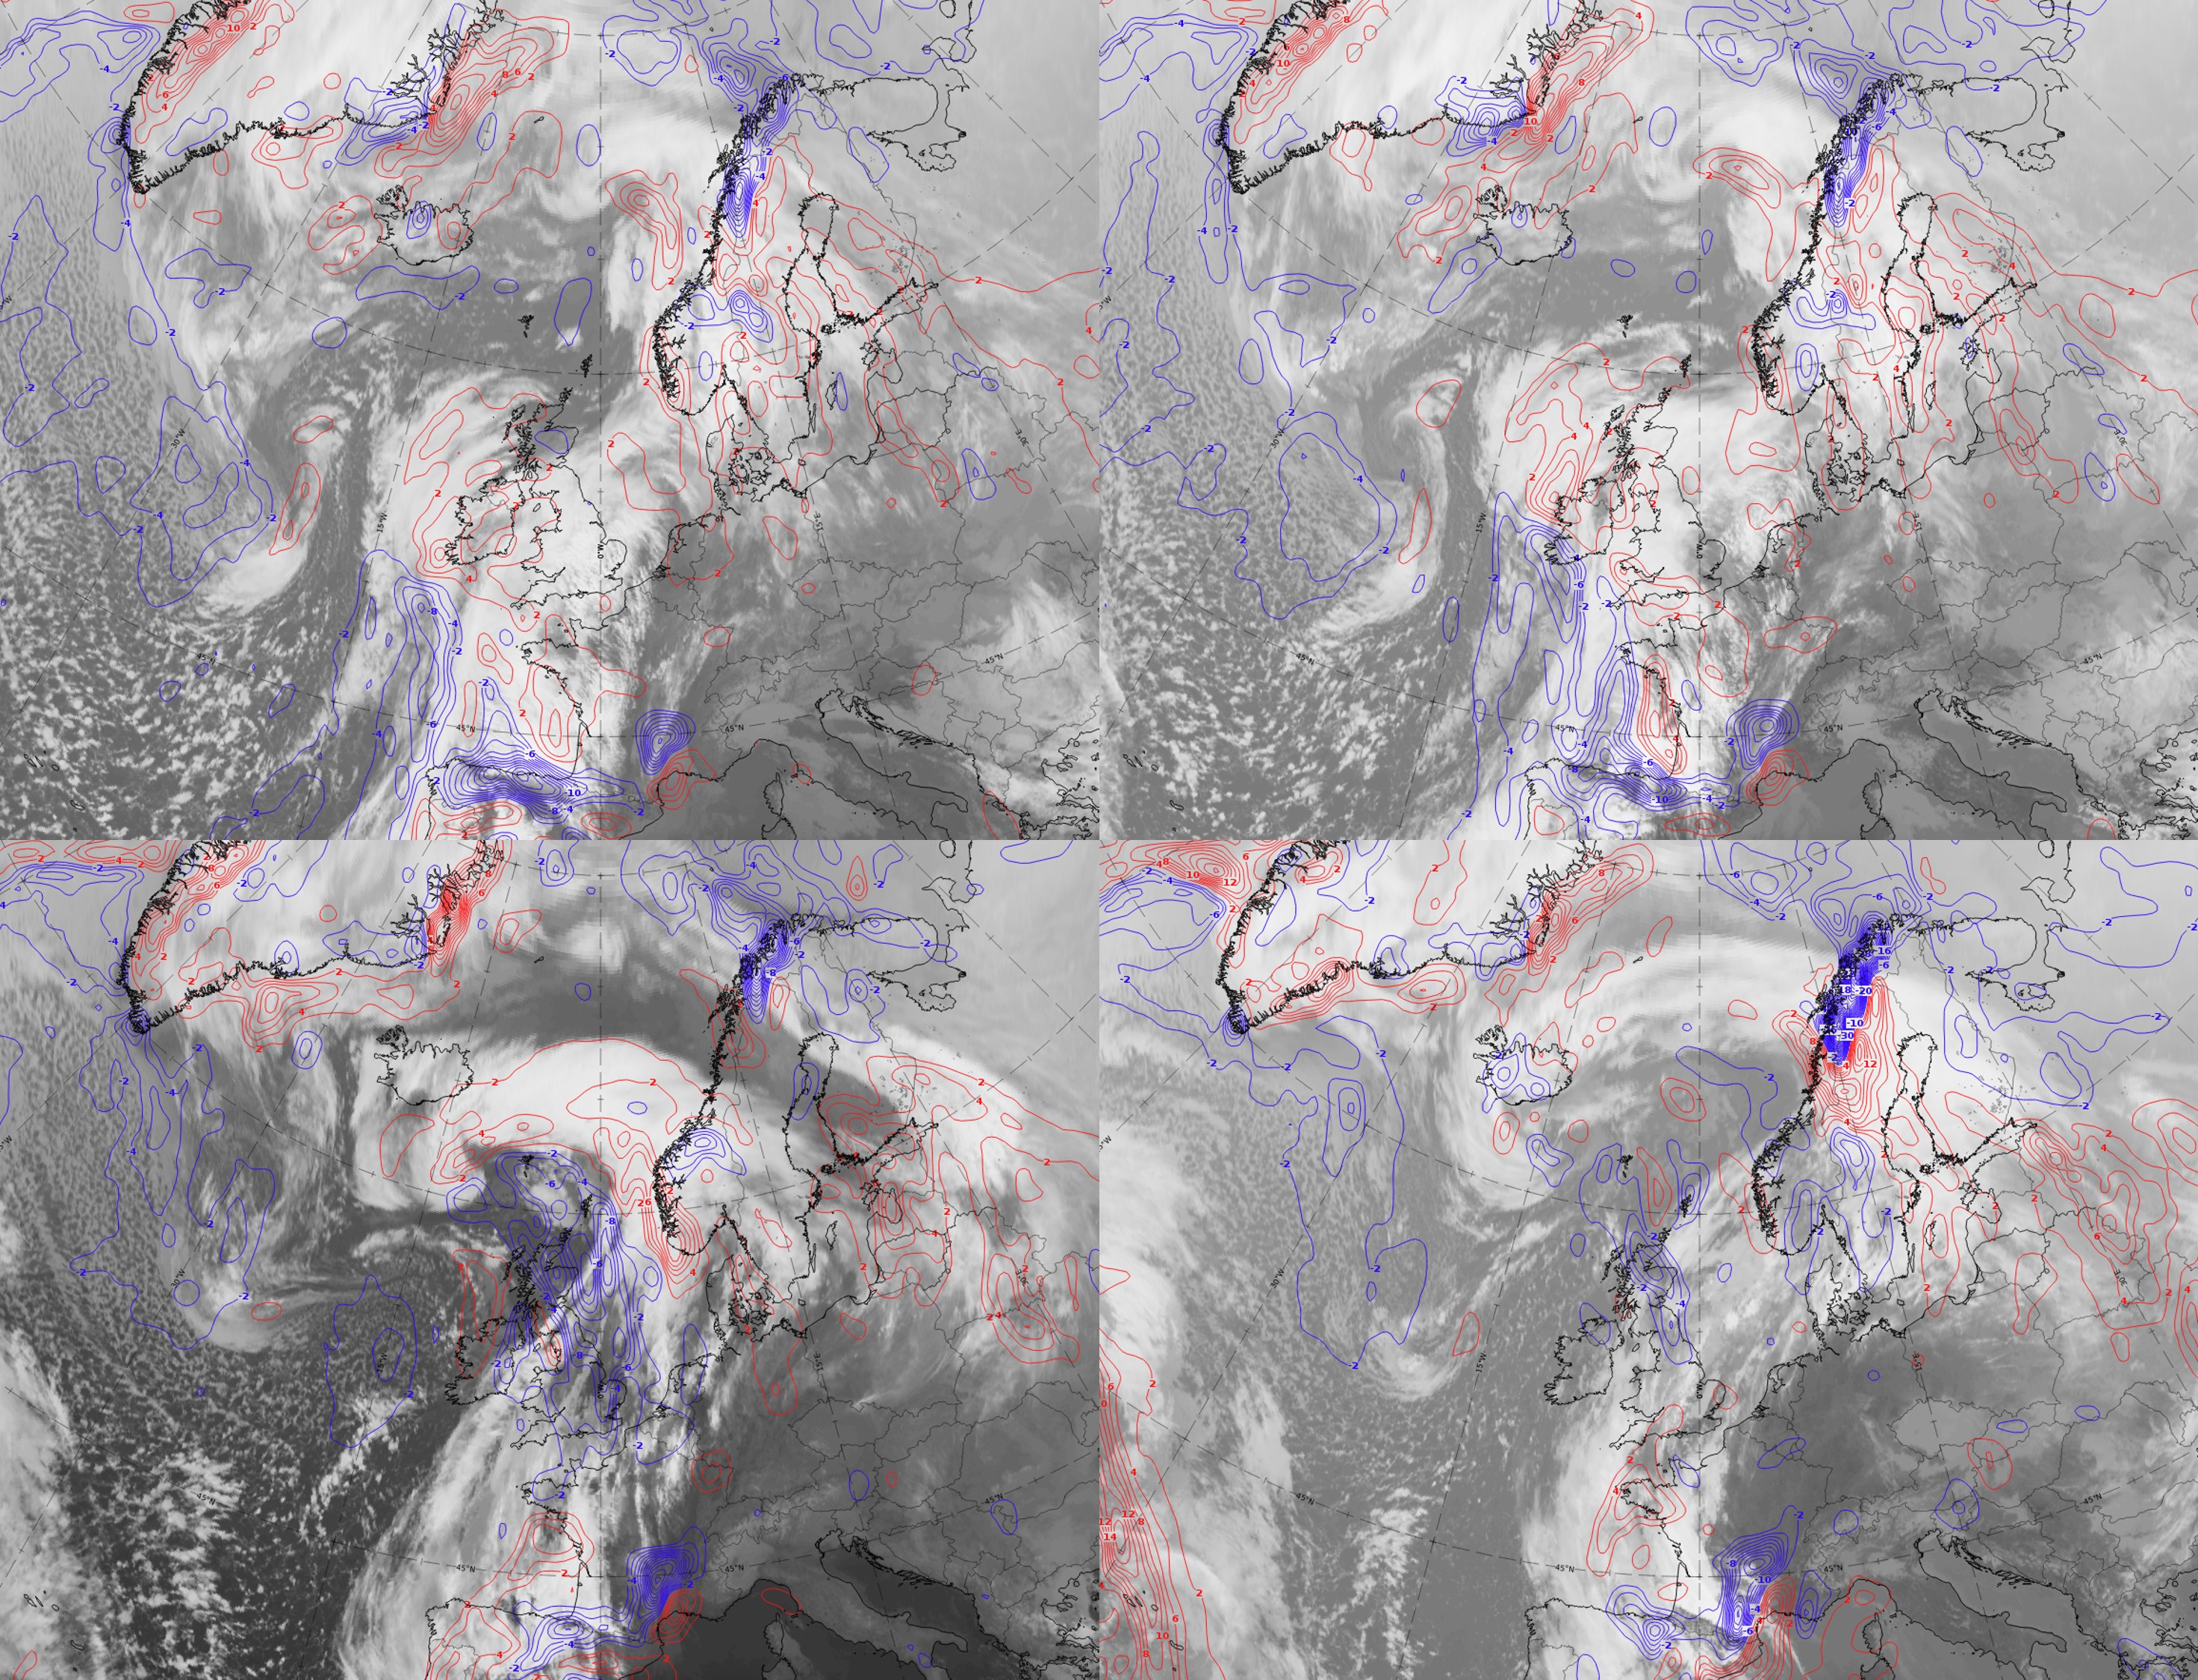
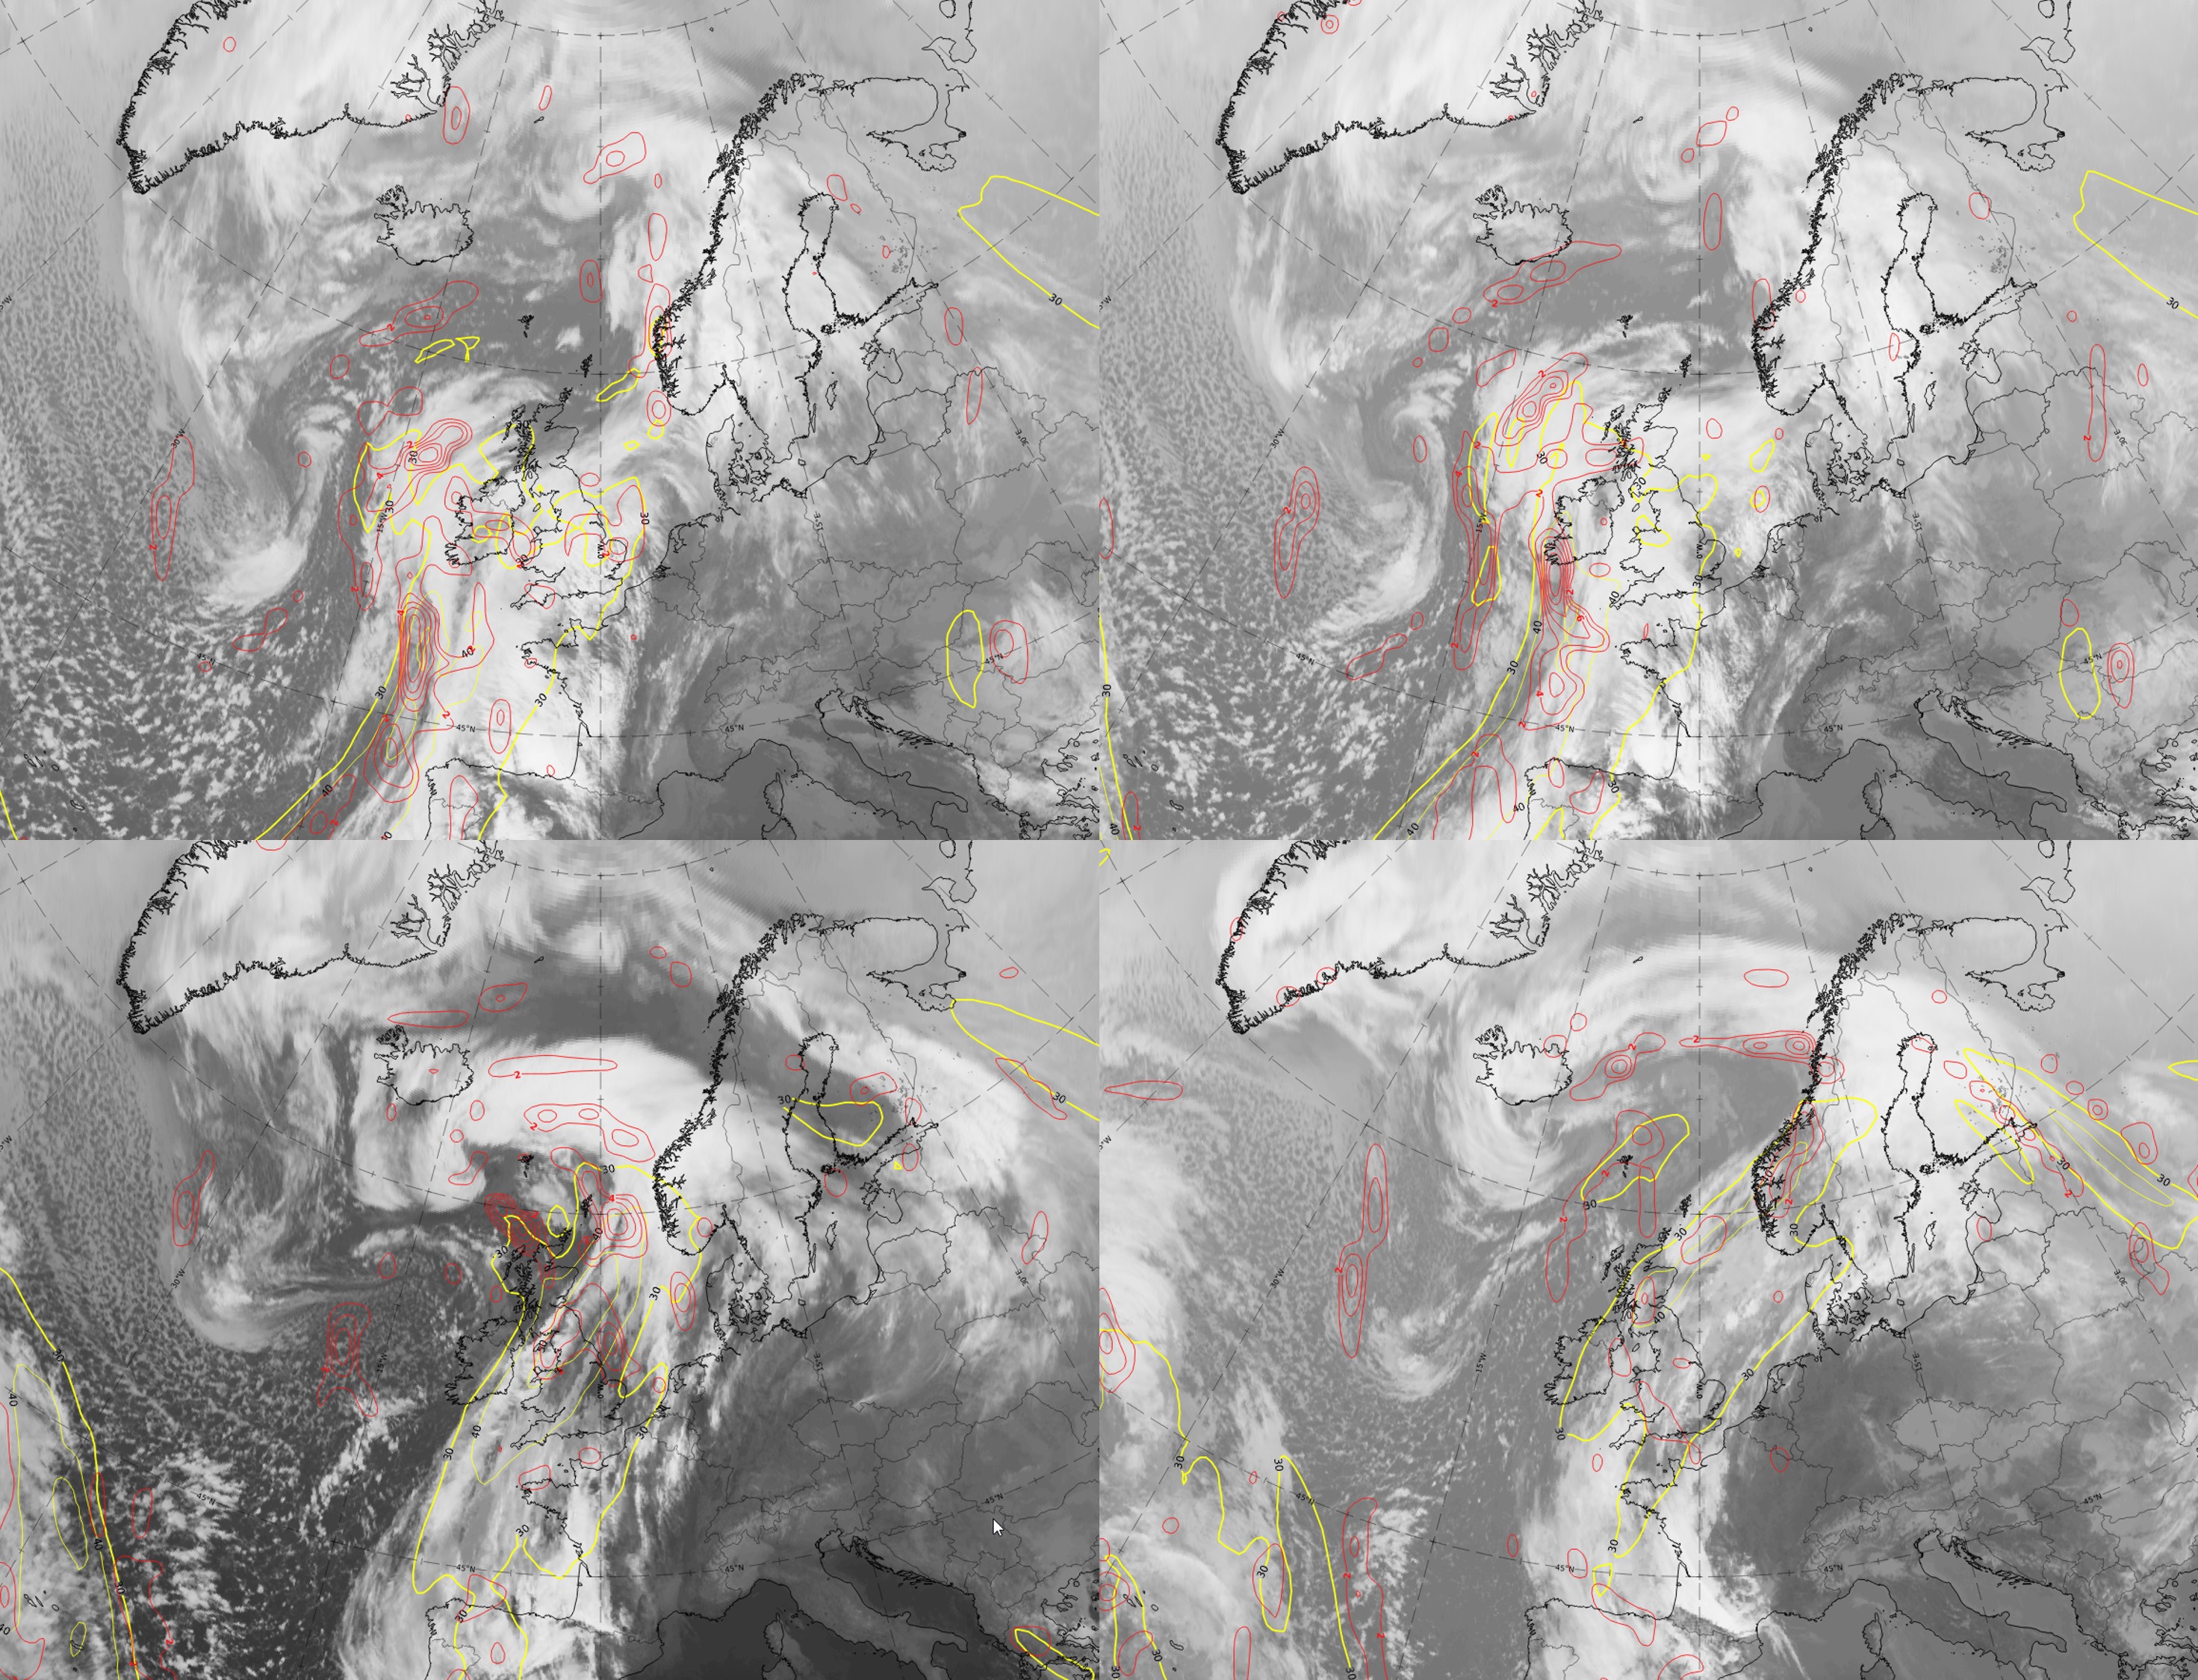
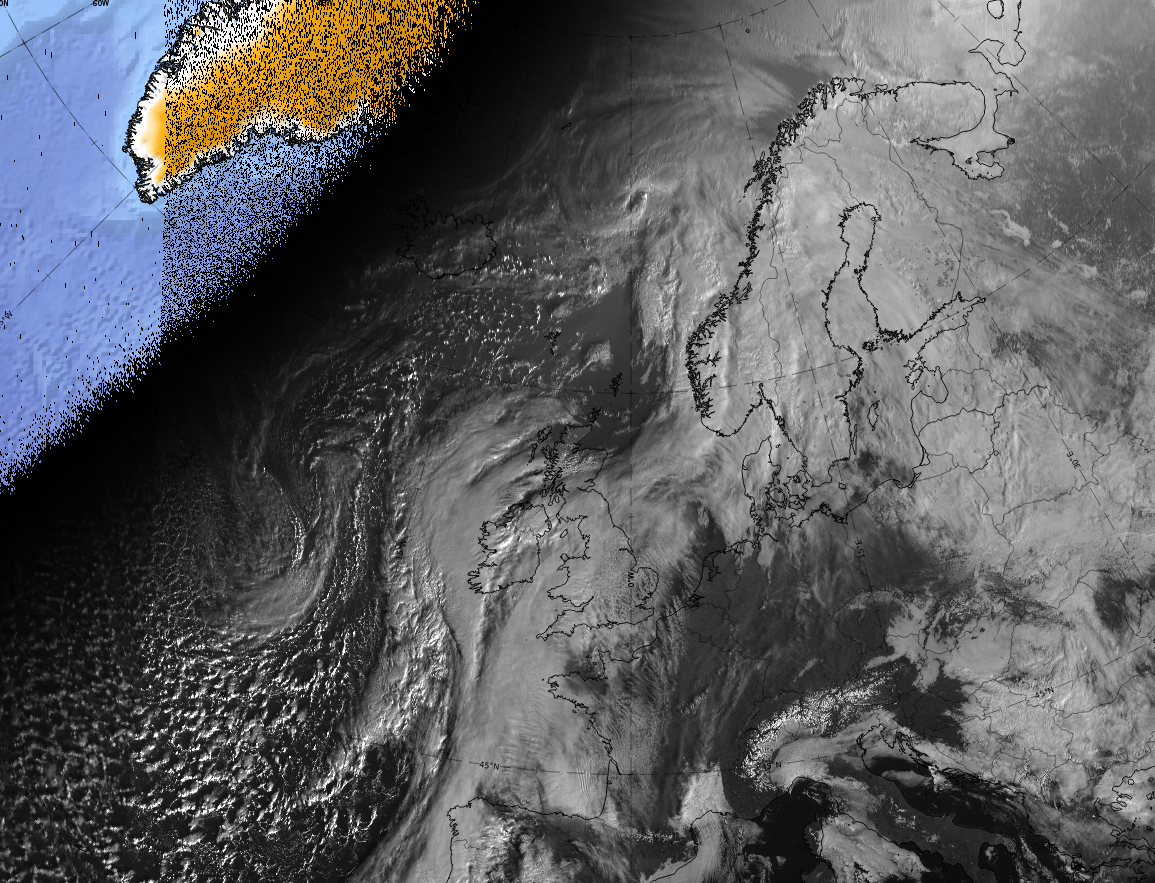
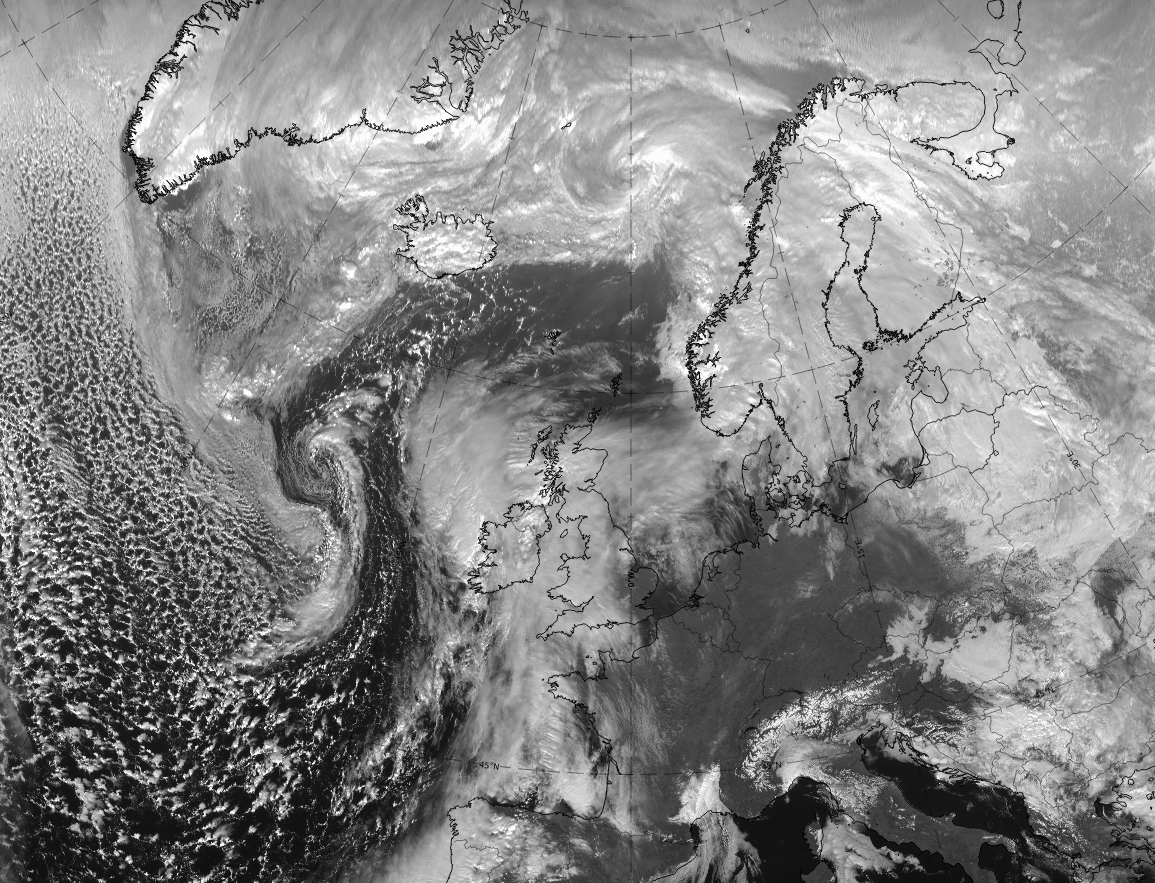
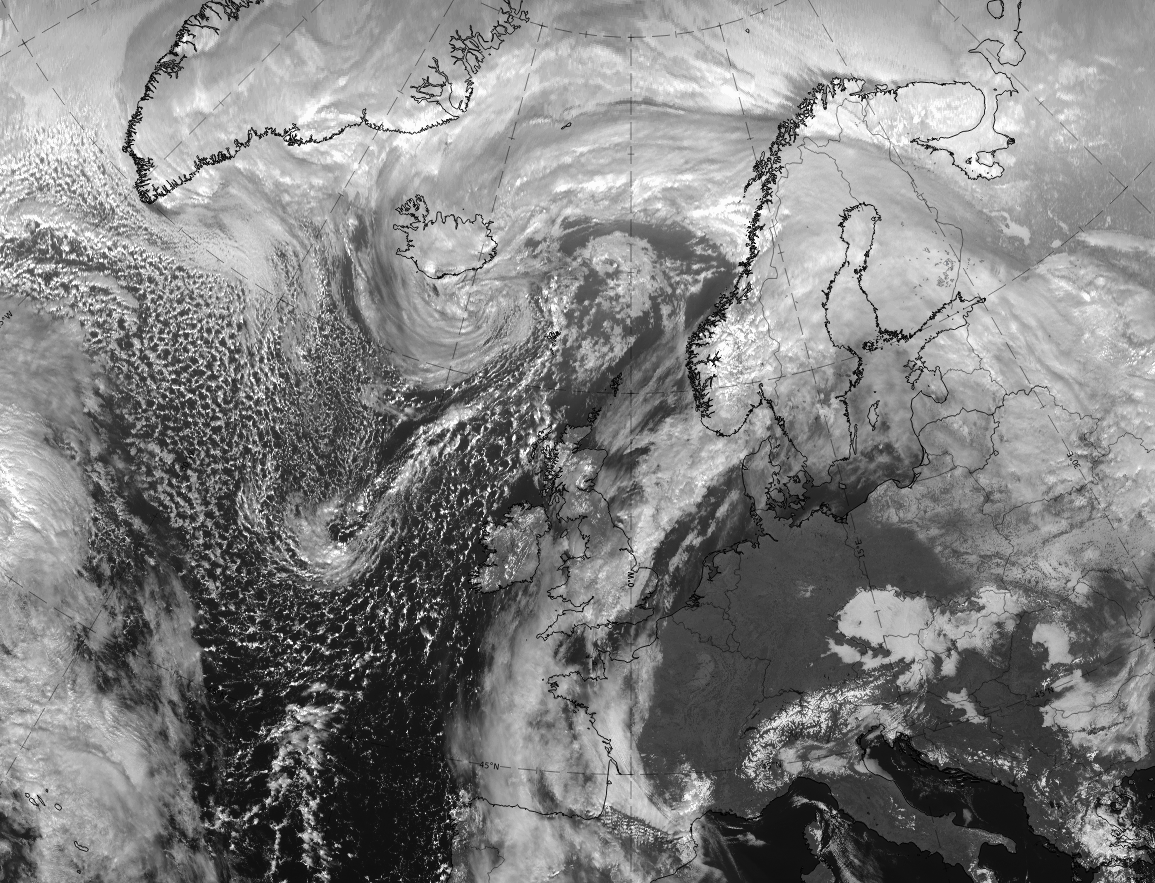
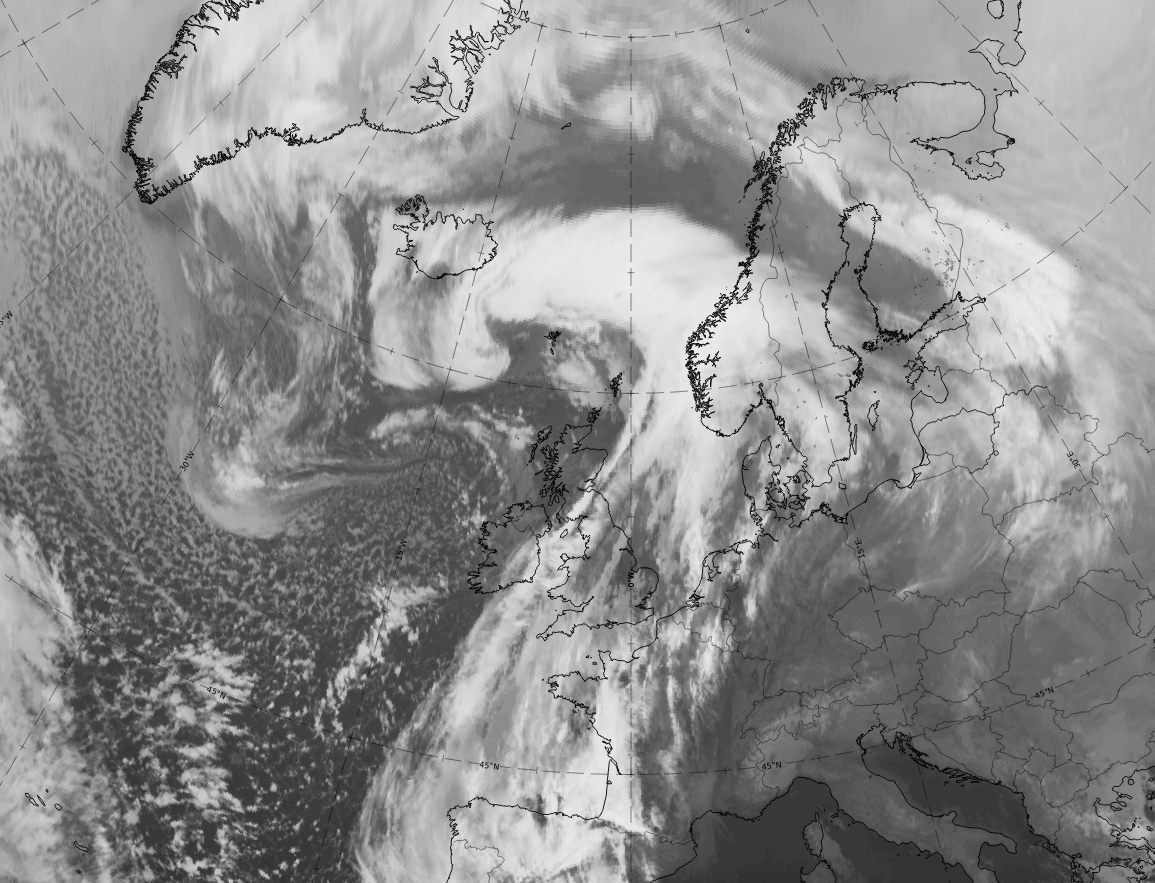
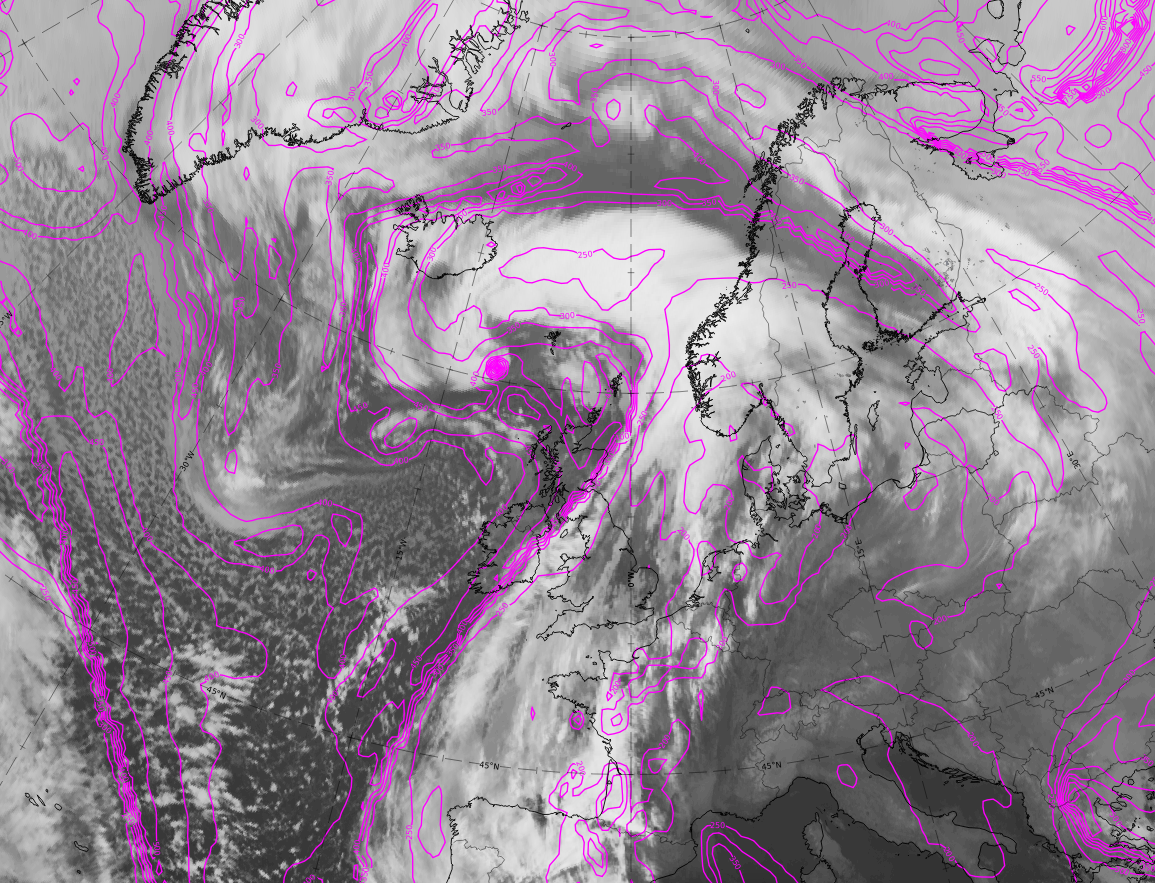
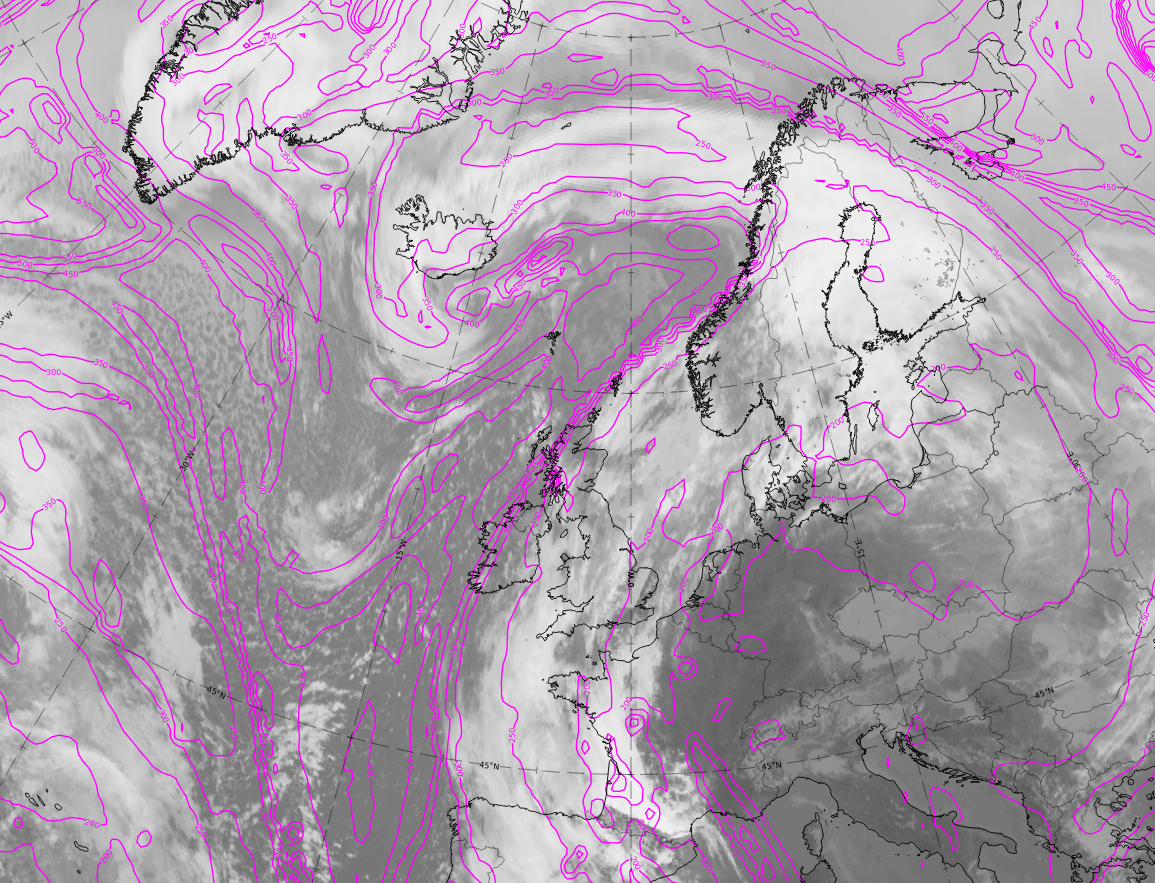
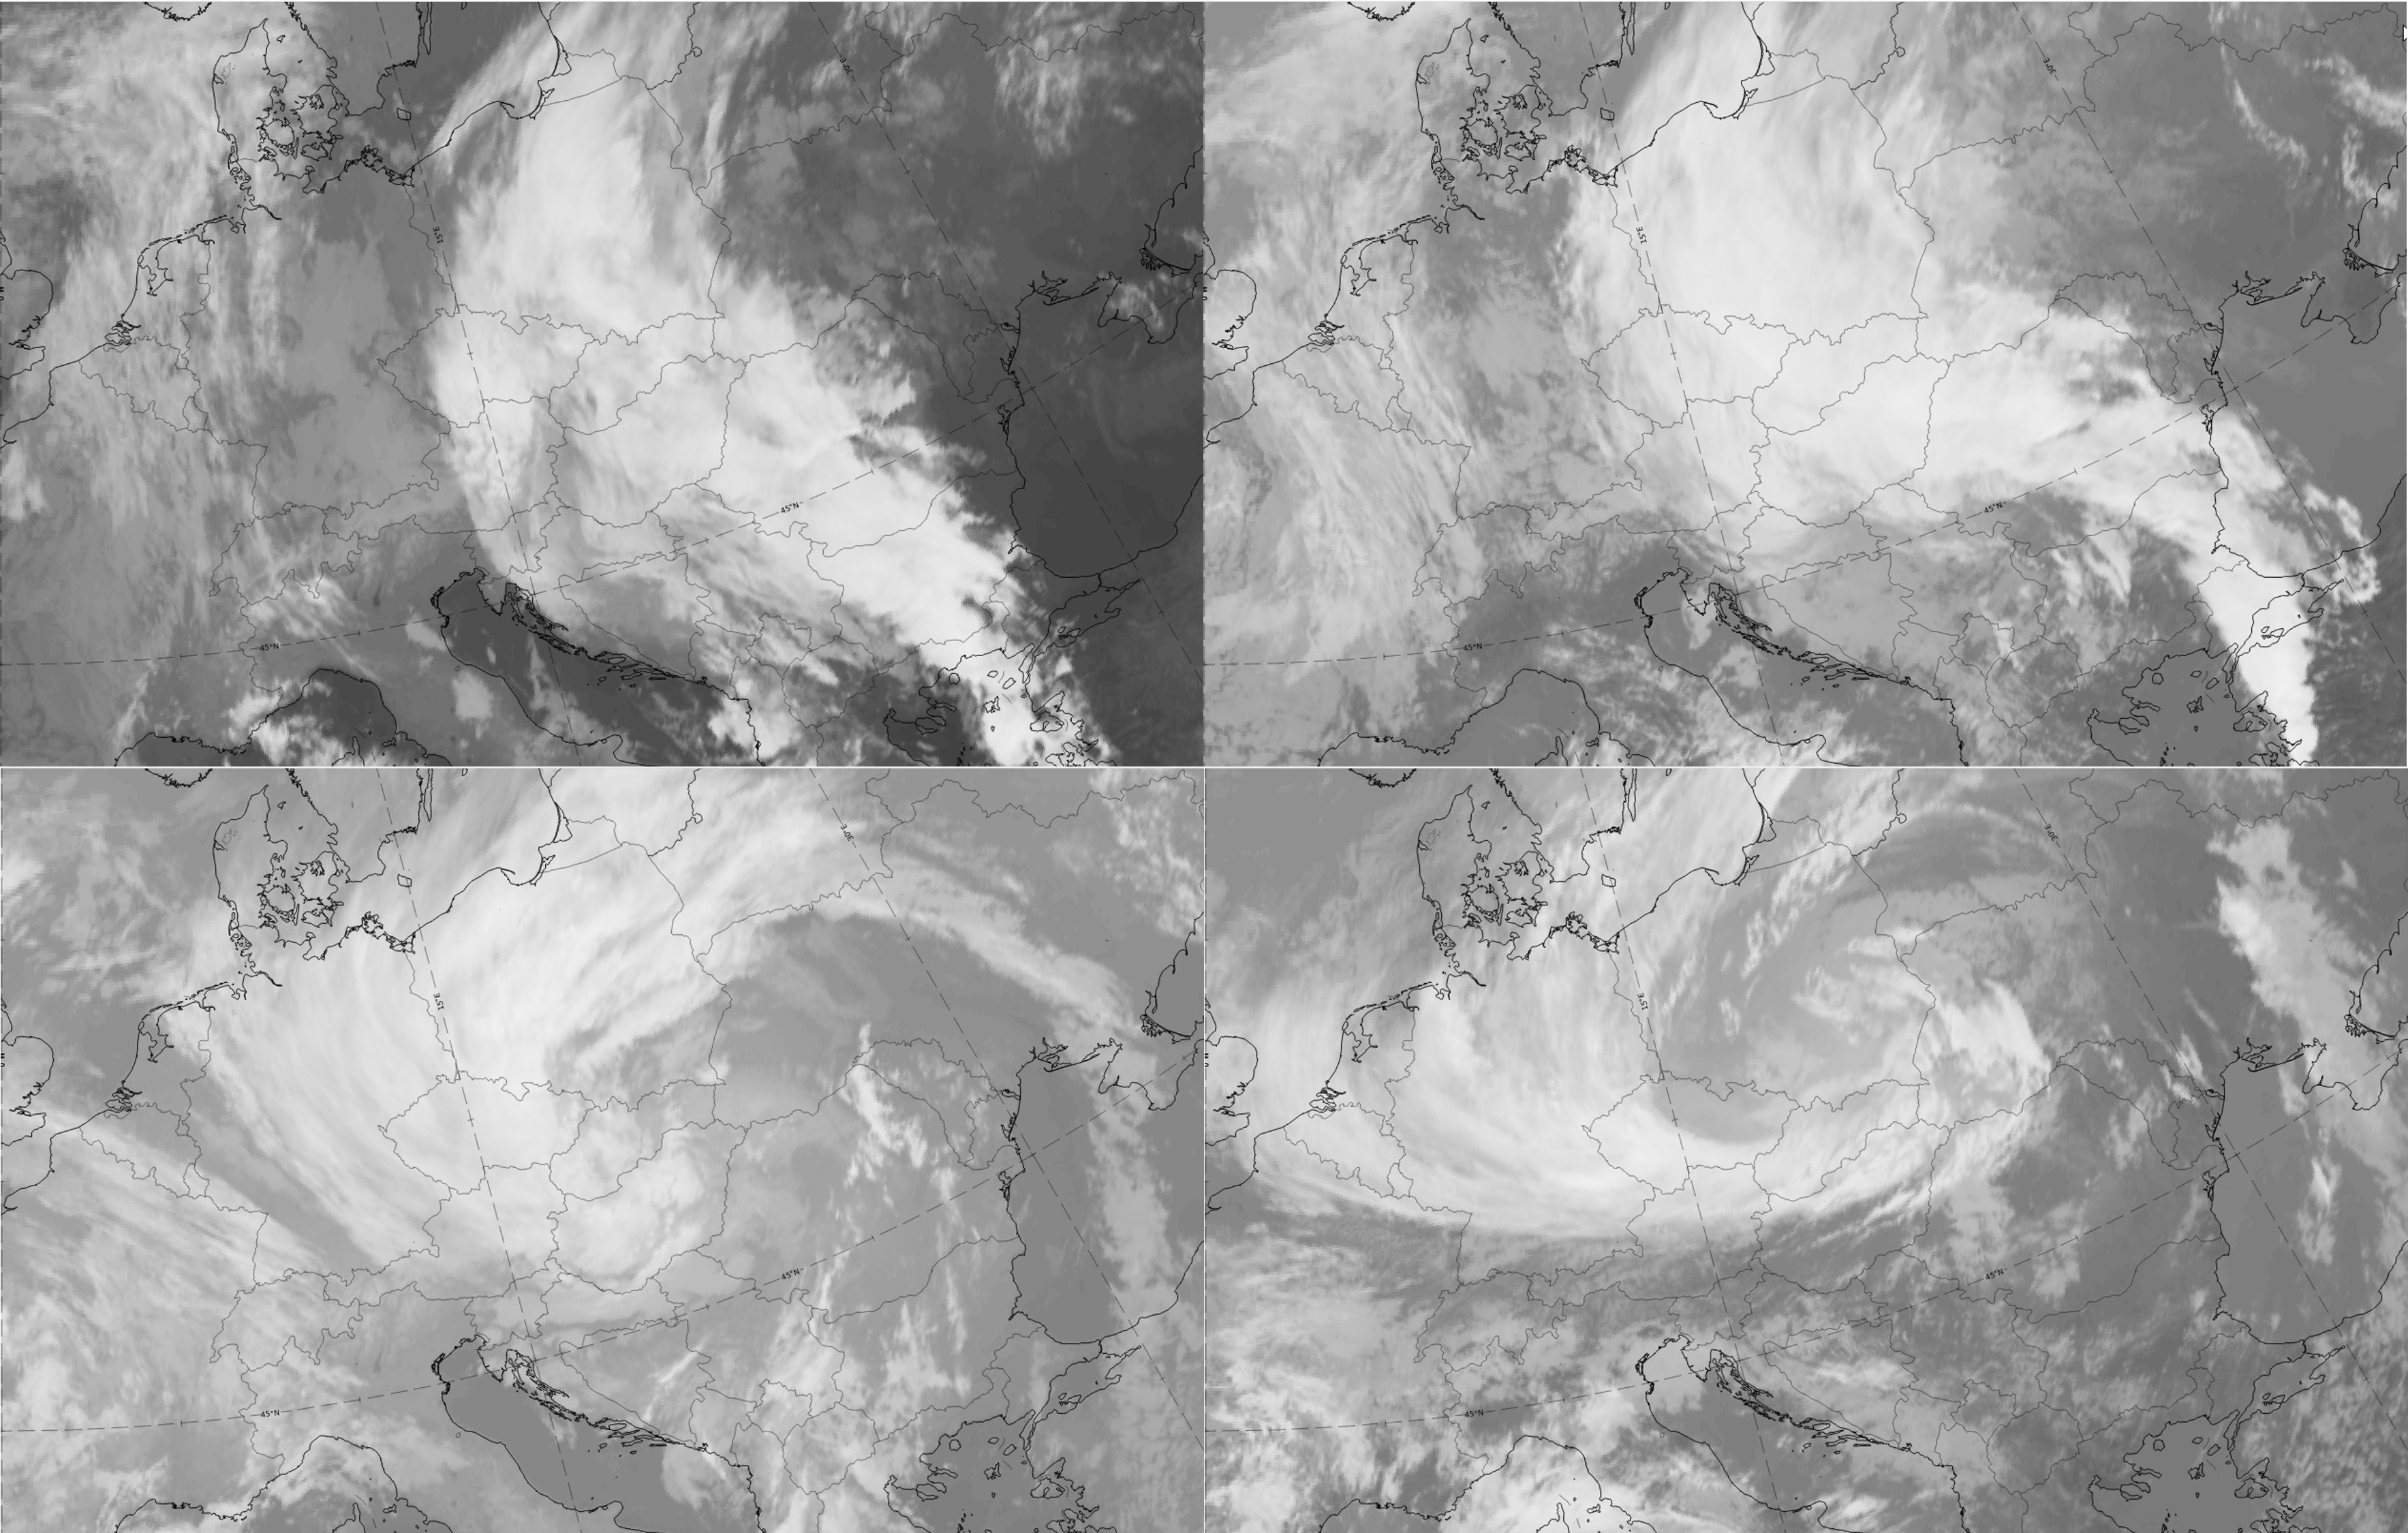
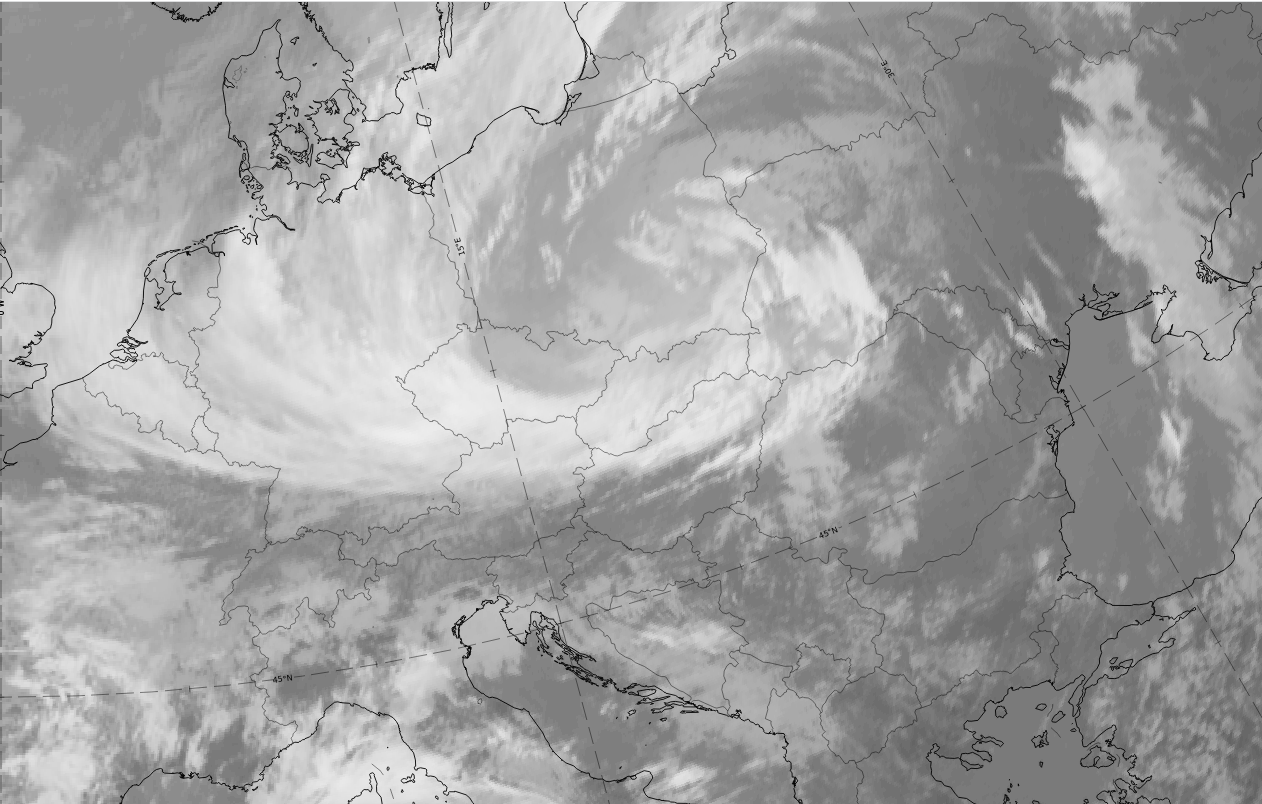
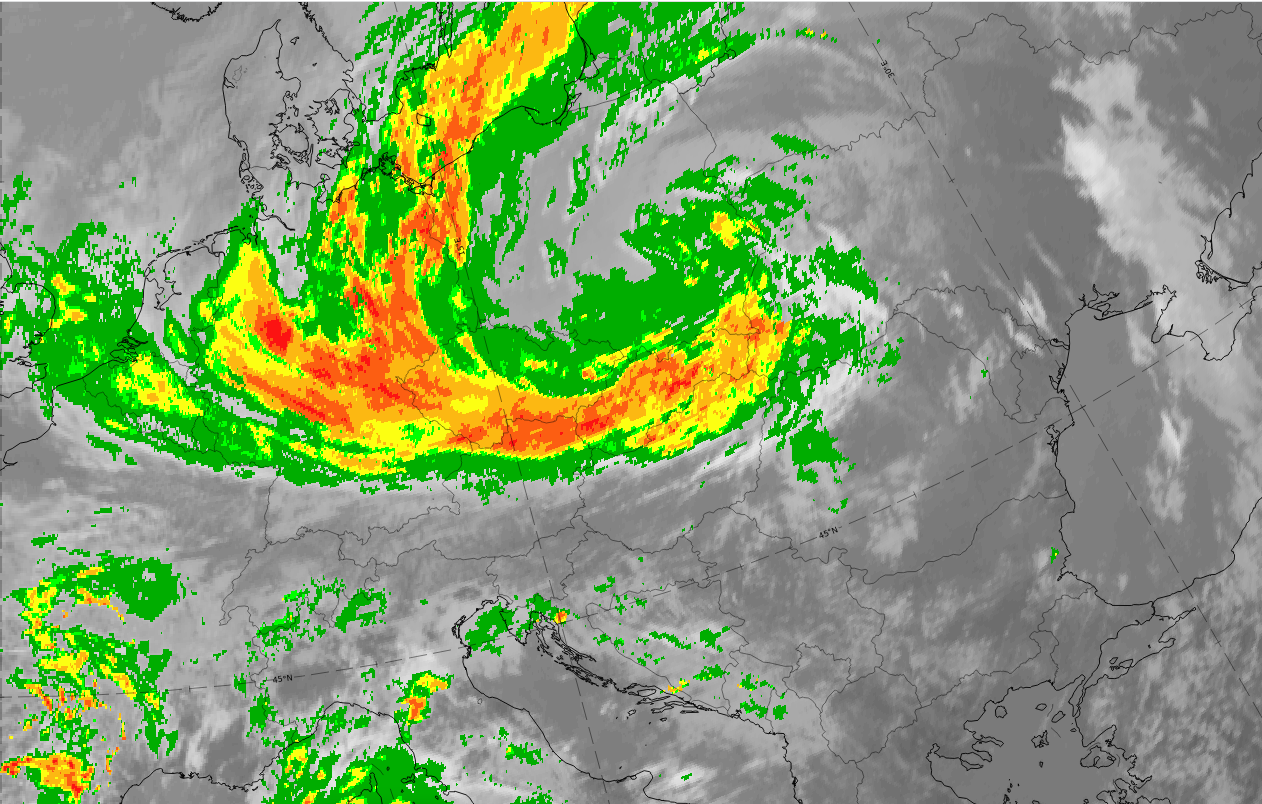
This case from 20-21 February 2021 shows a secondary cyclogenesis, which develops at a cold front over the Atlantic to the west of Ireland and the British Isles and moves northward over Scotland into the Norwegian Sea. In the beginning of the sequence there is a double structure of two fronts, which merge between Wave and Intensification stages.
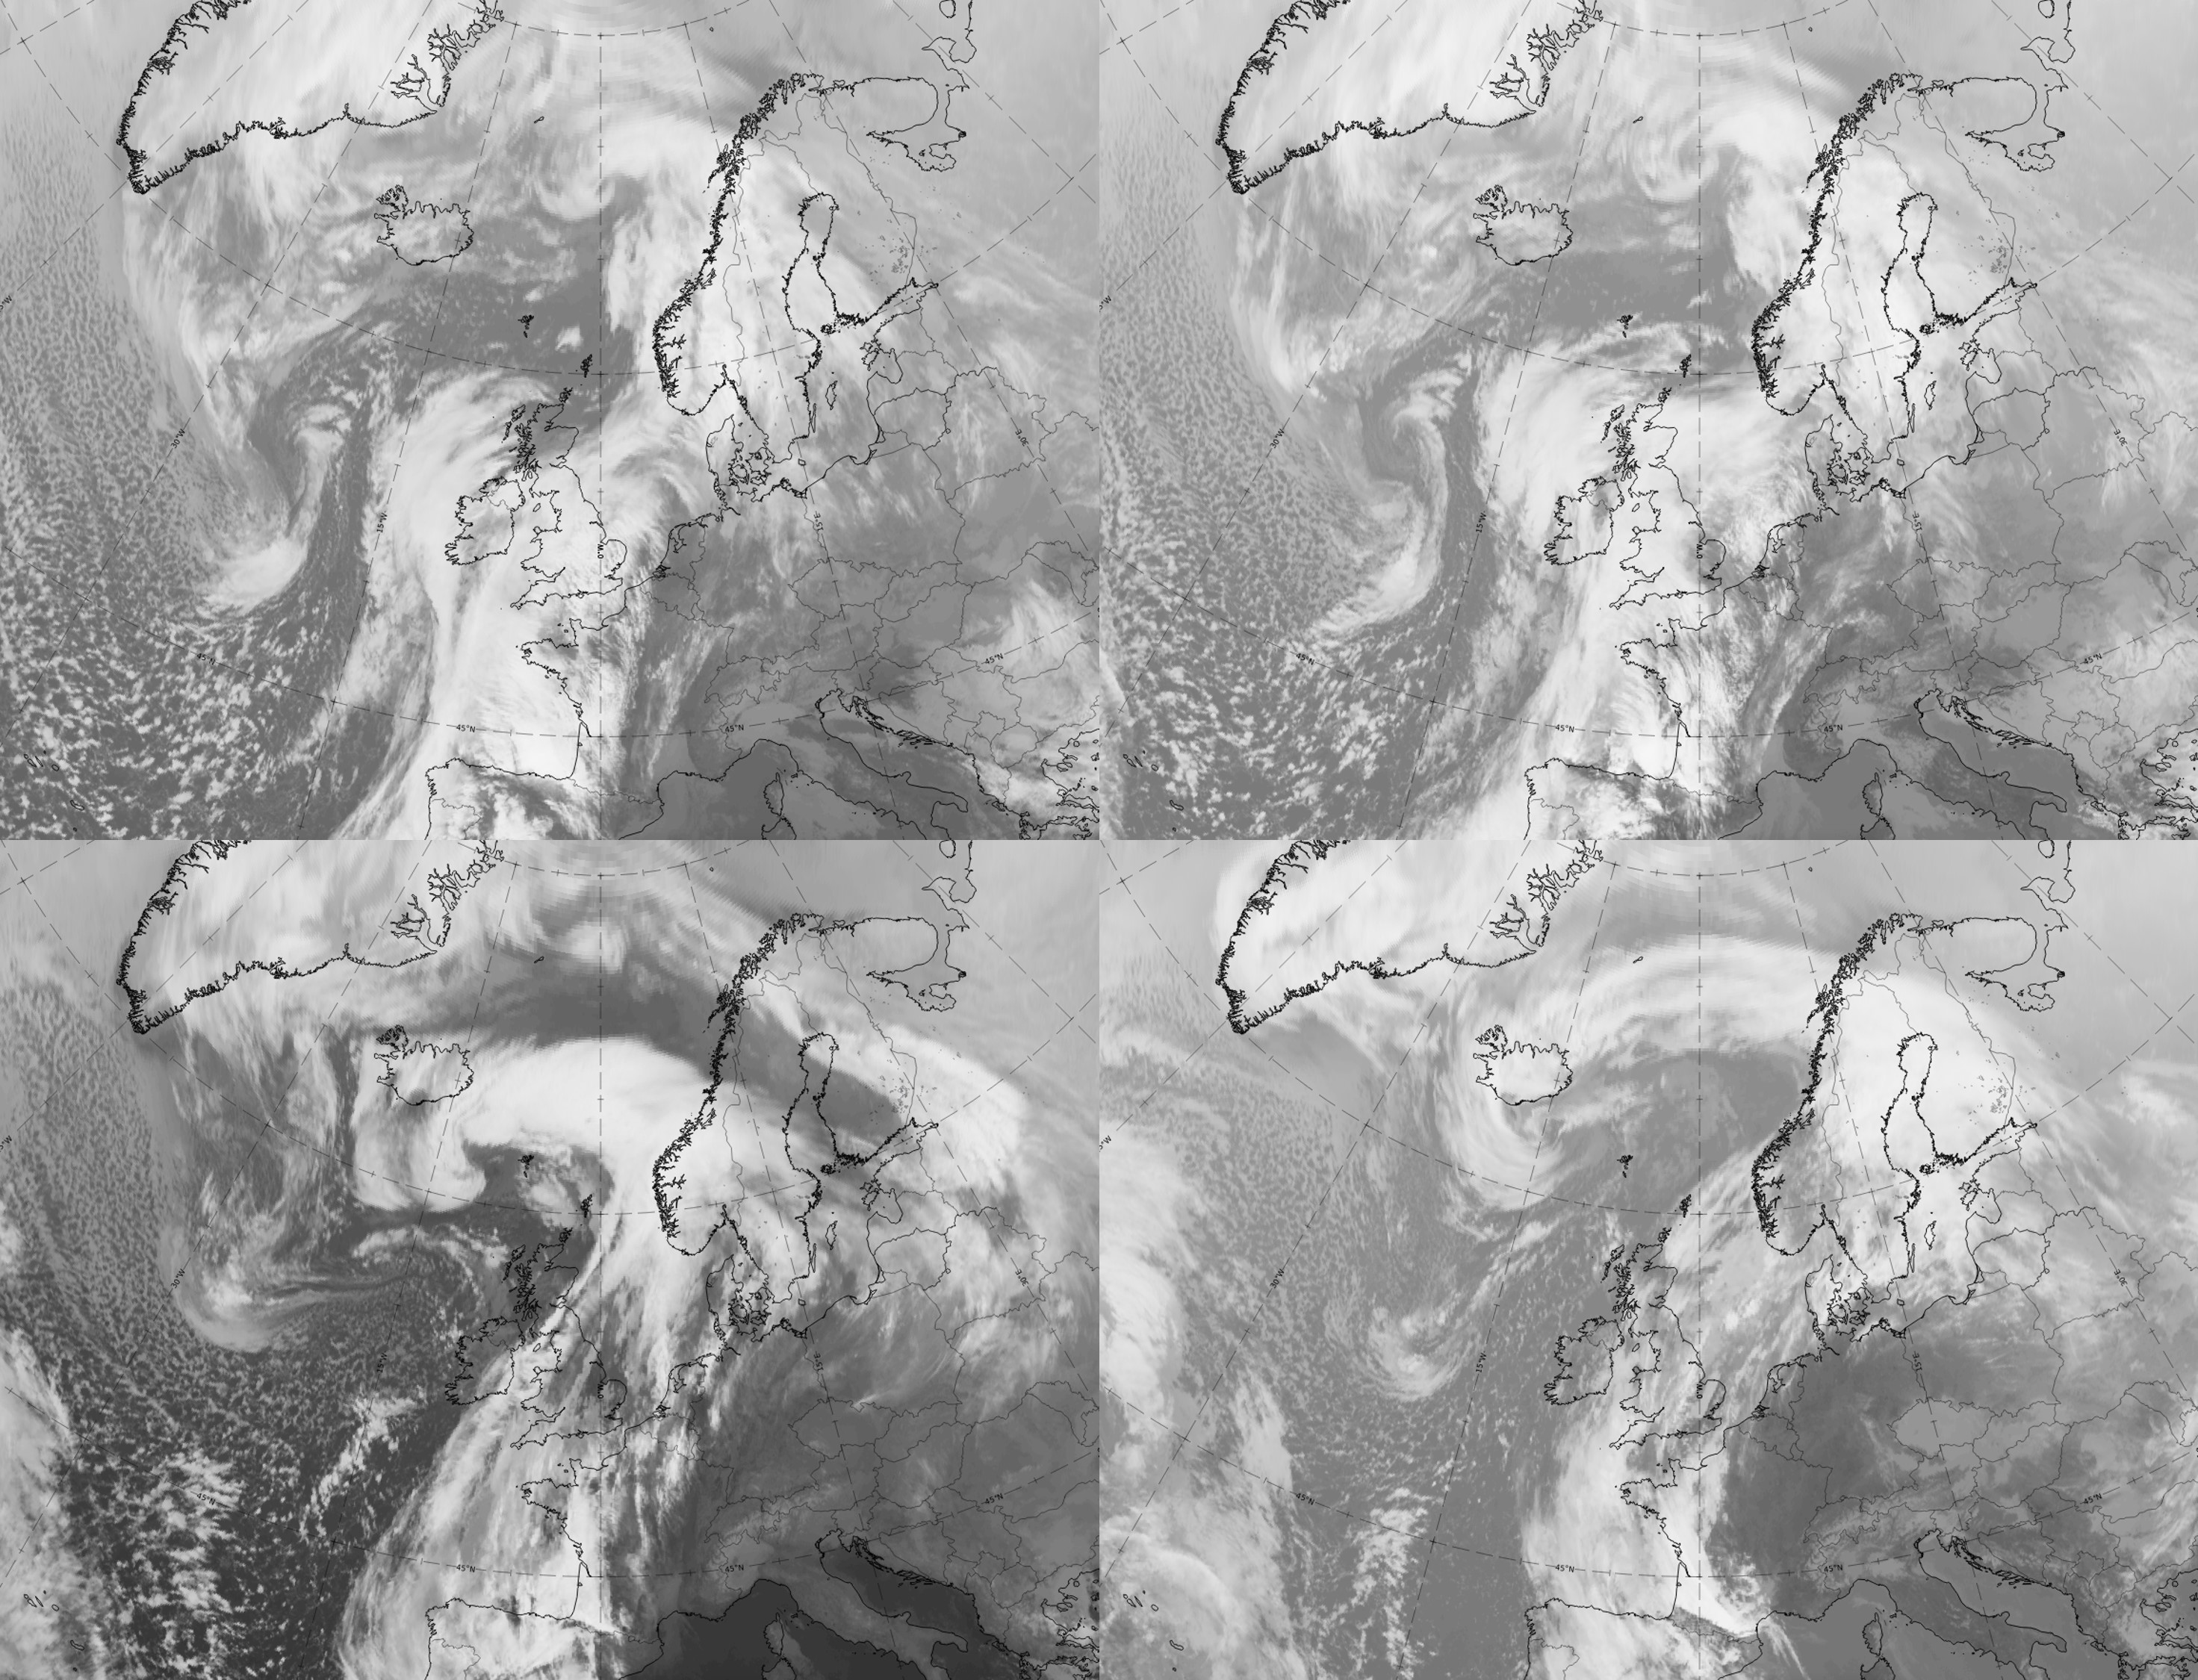
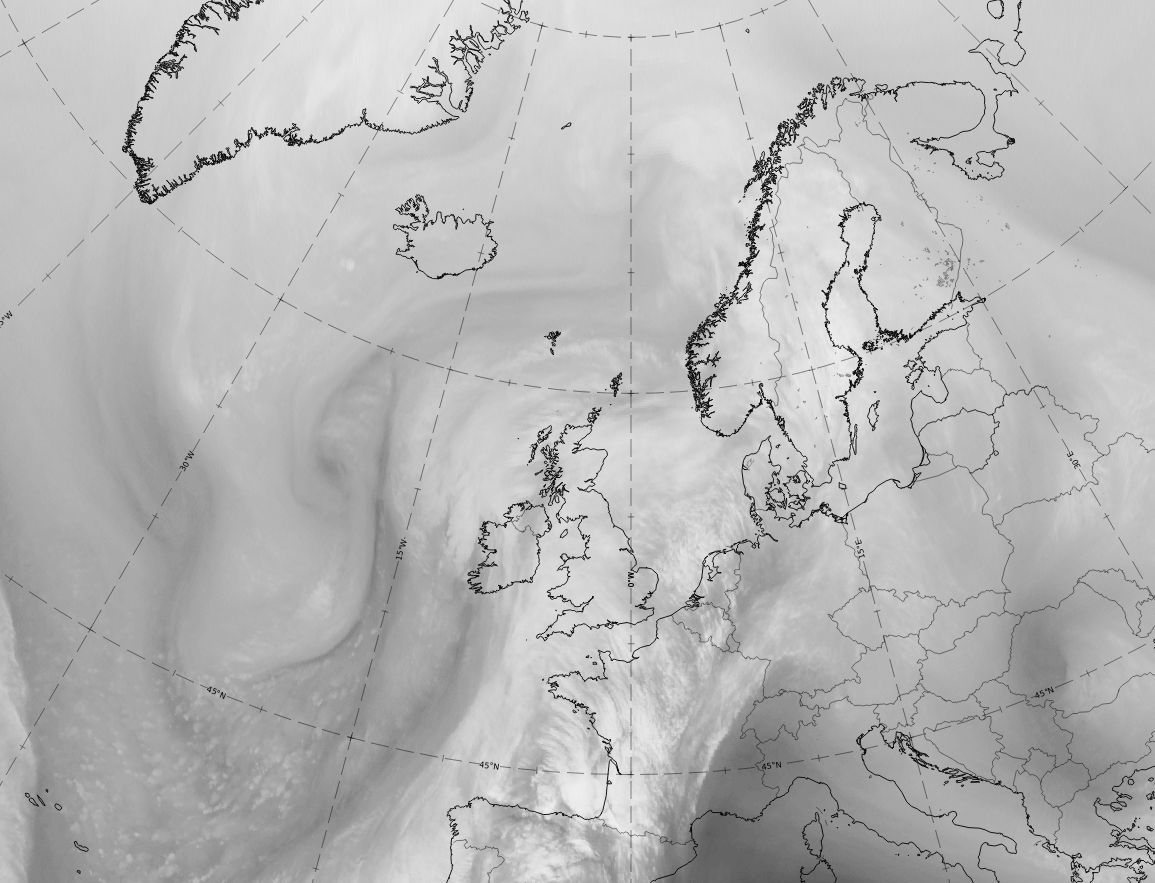
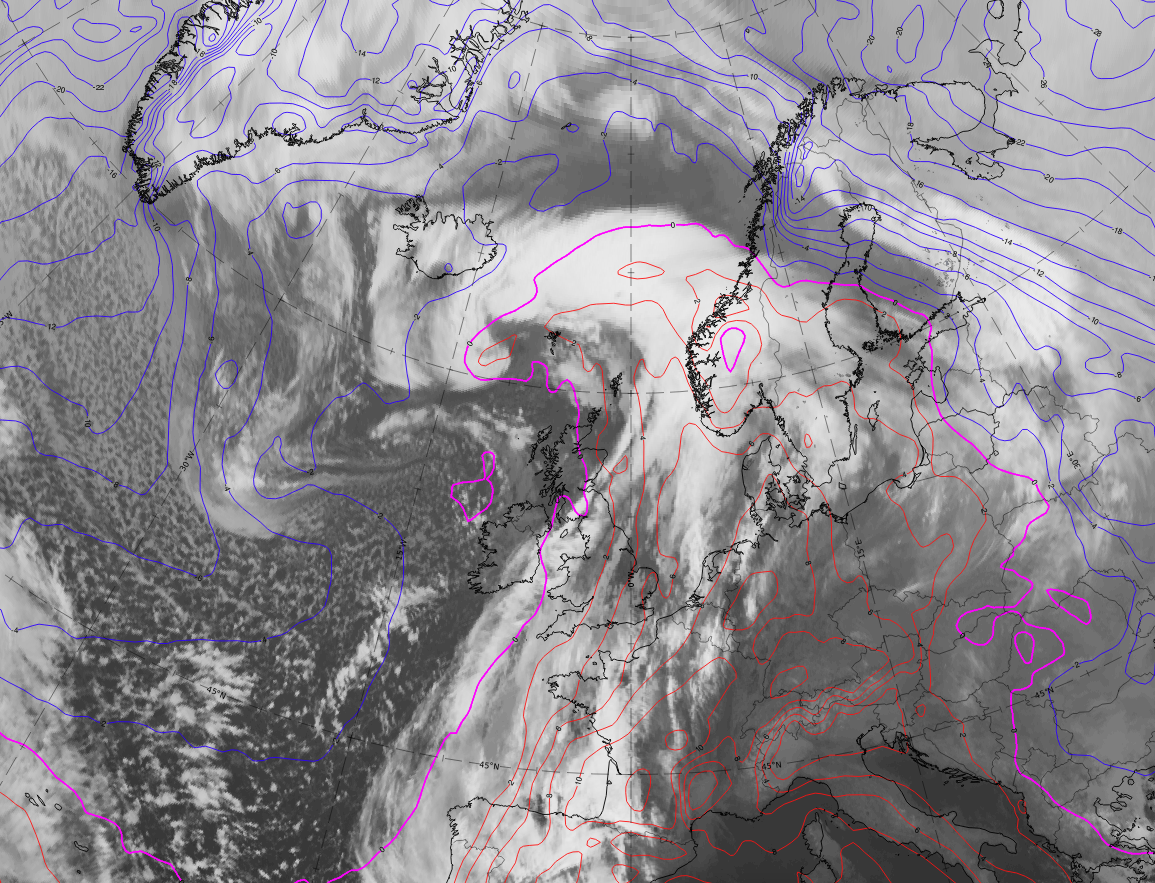
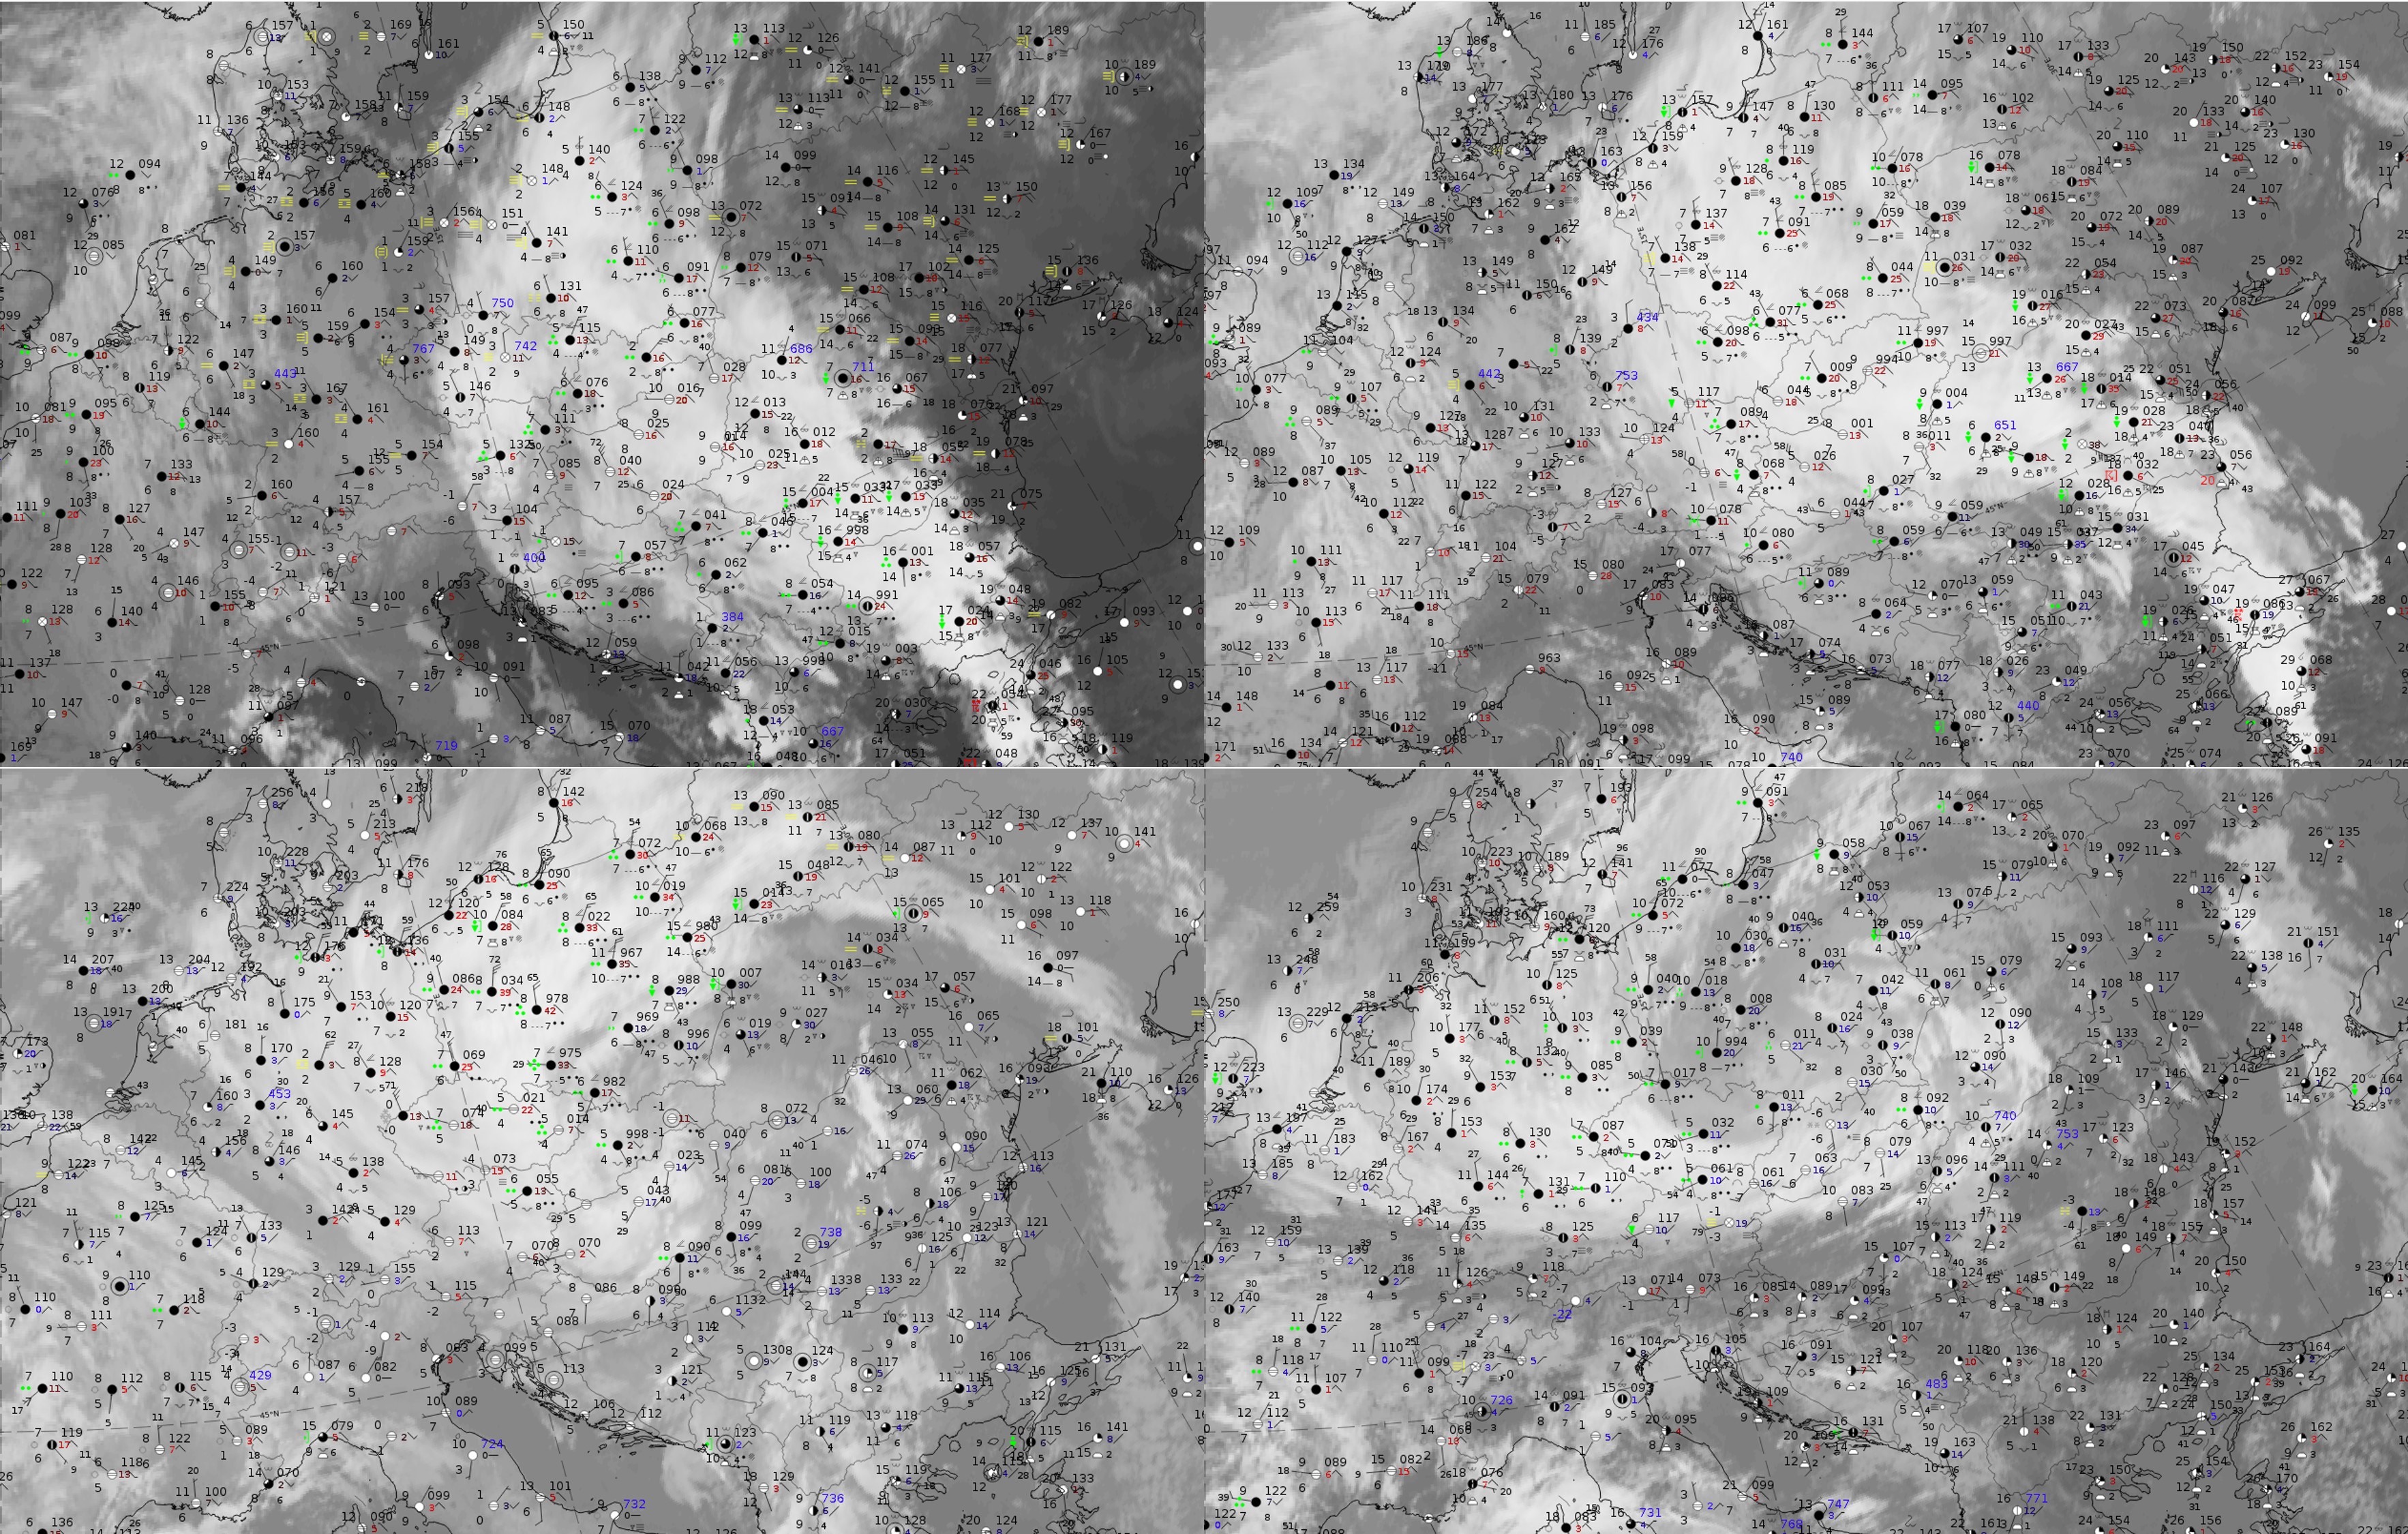
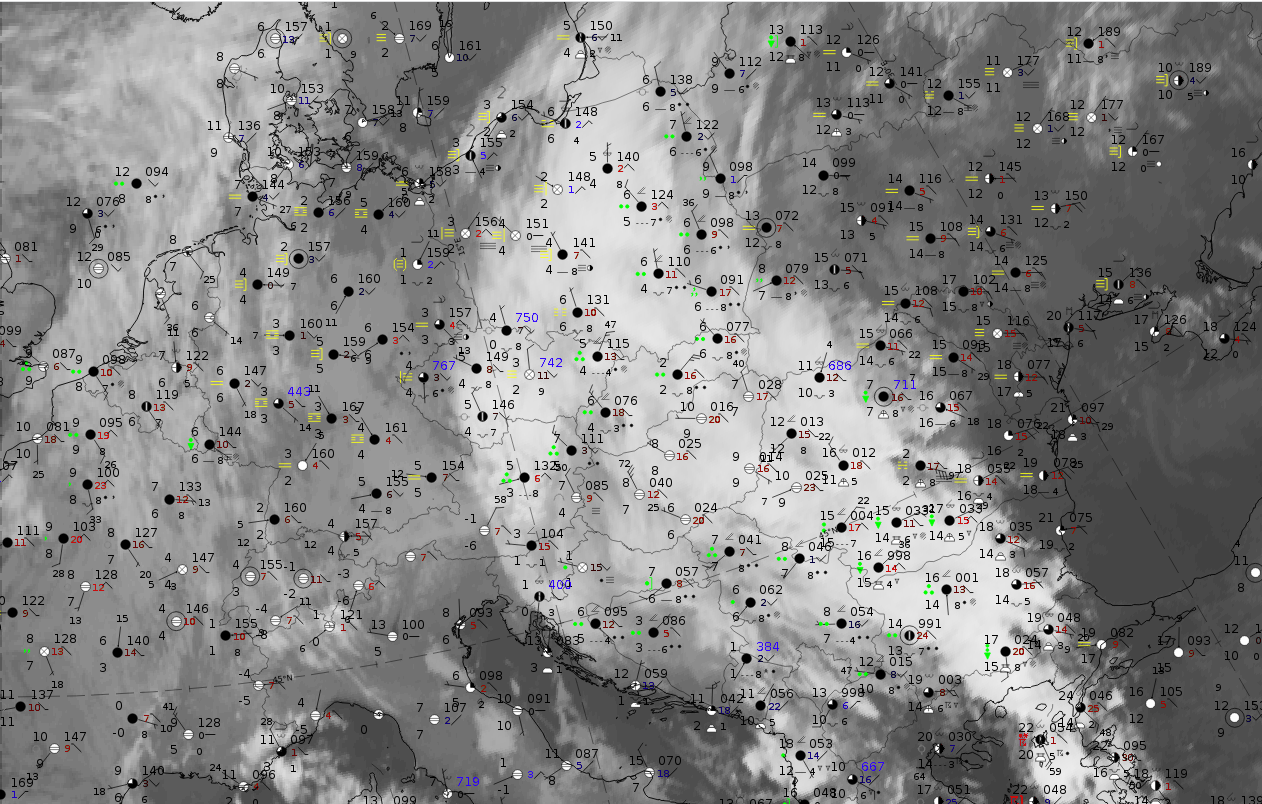
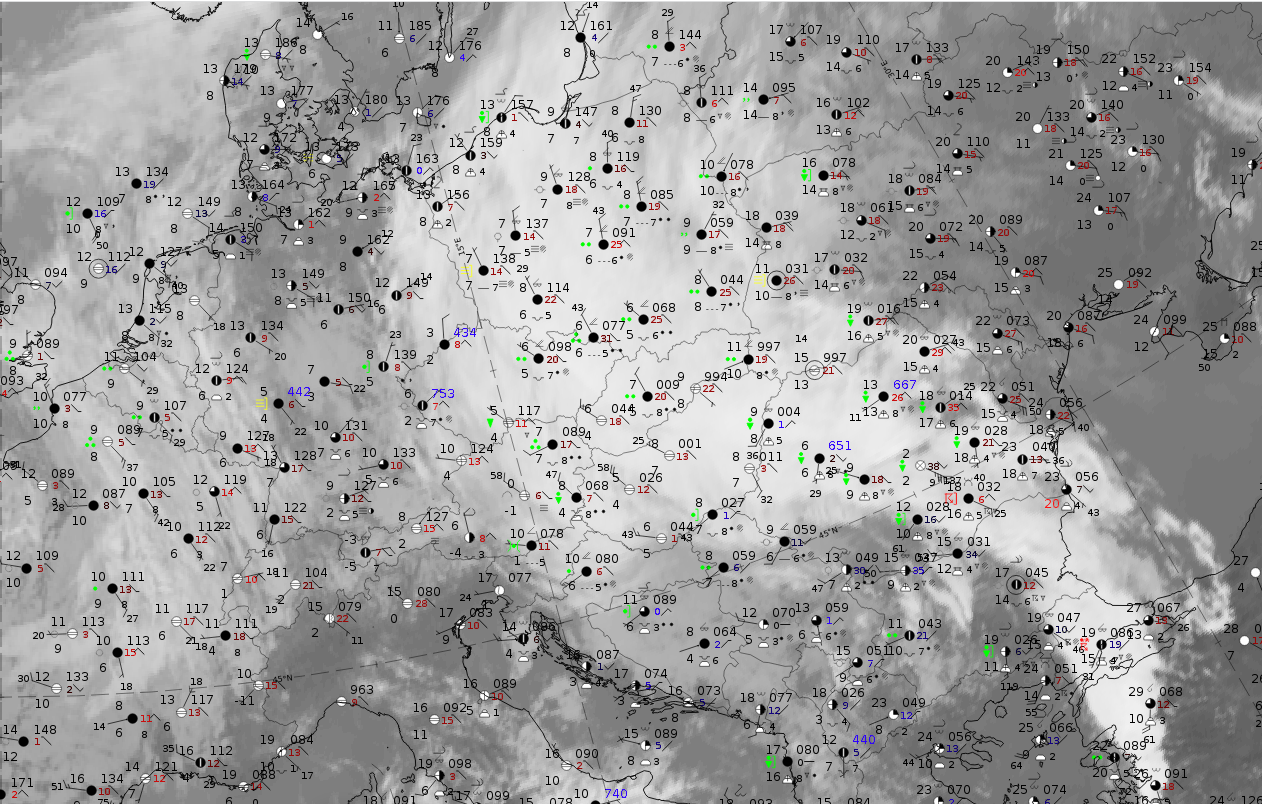
Legend: 20-21 February 2021, IR.
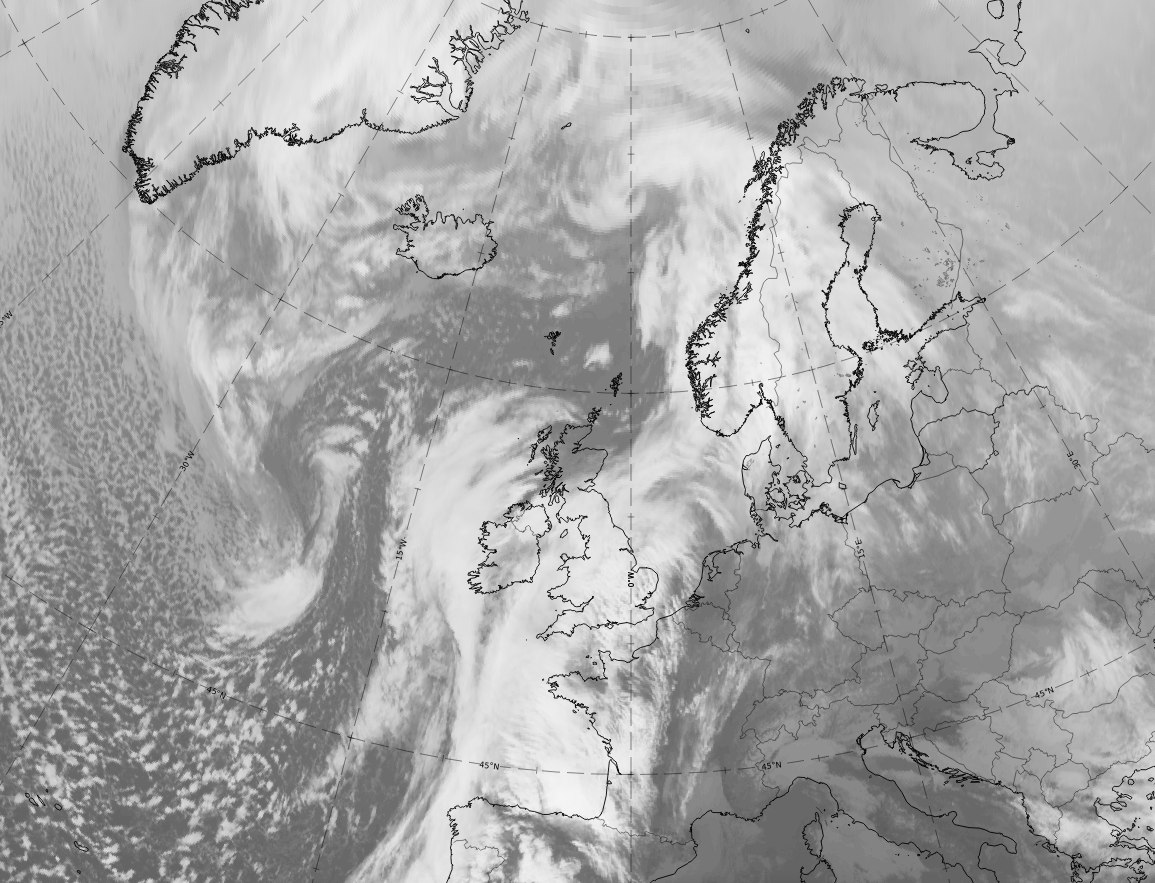
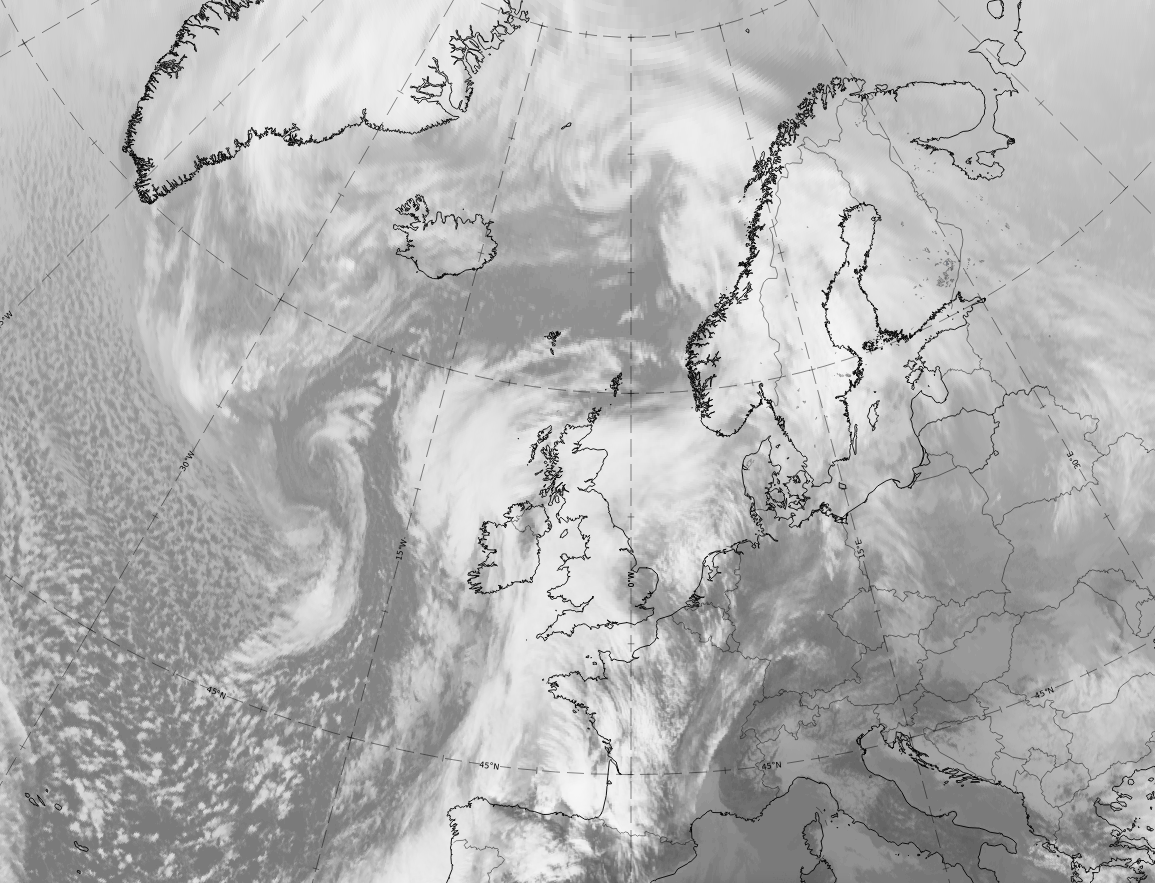
U.l.: 09 UTC on 20 February 2021, Wave stage; u.r.: 12 UTC on 20 February 2021, Intensification stage; l.l: 00 UTC on 21 February 2021, Mature stage; 12 UTC on 21 February 2021, Dissipation stage.
Note: To enlarge the image, click on it.
Note: To access the gallery of individual images click here

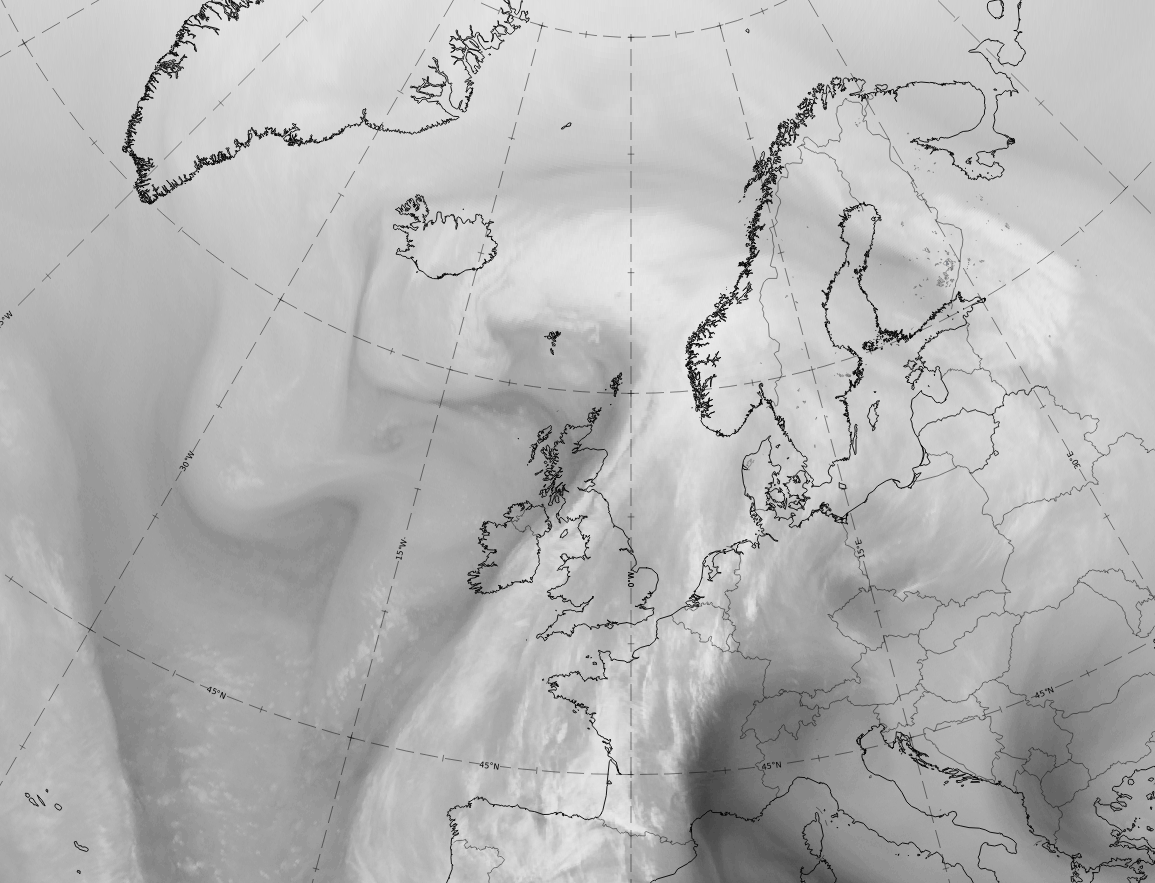
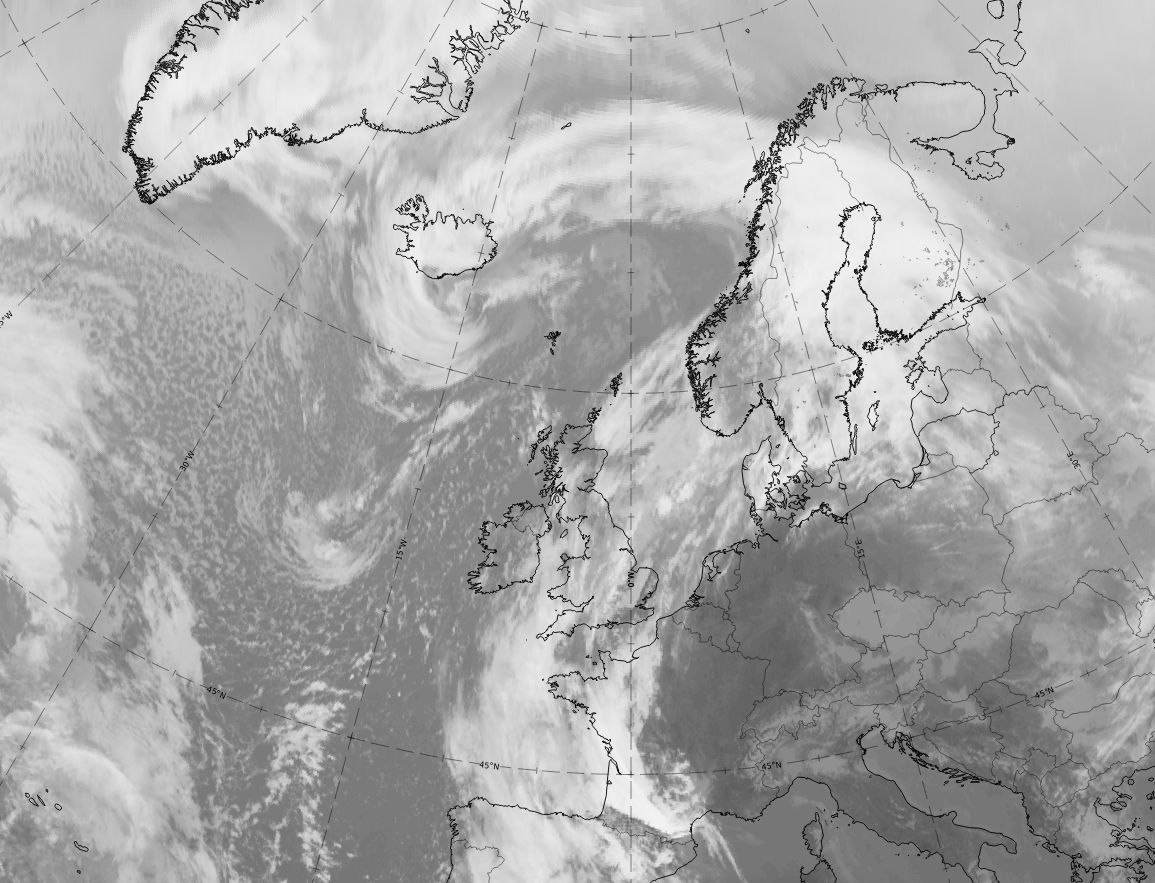
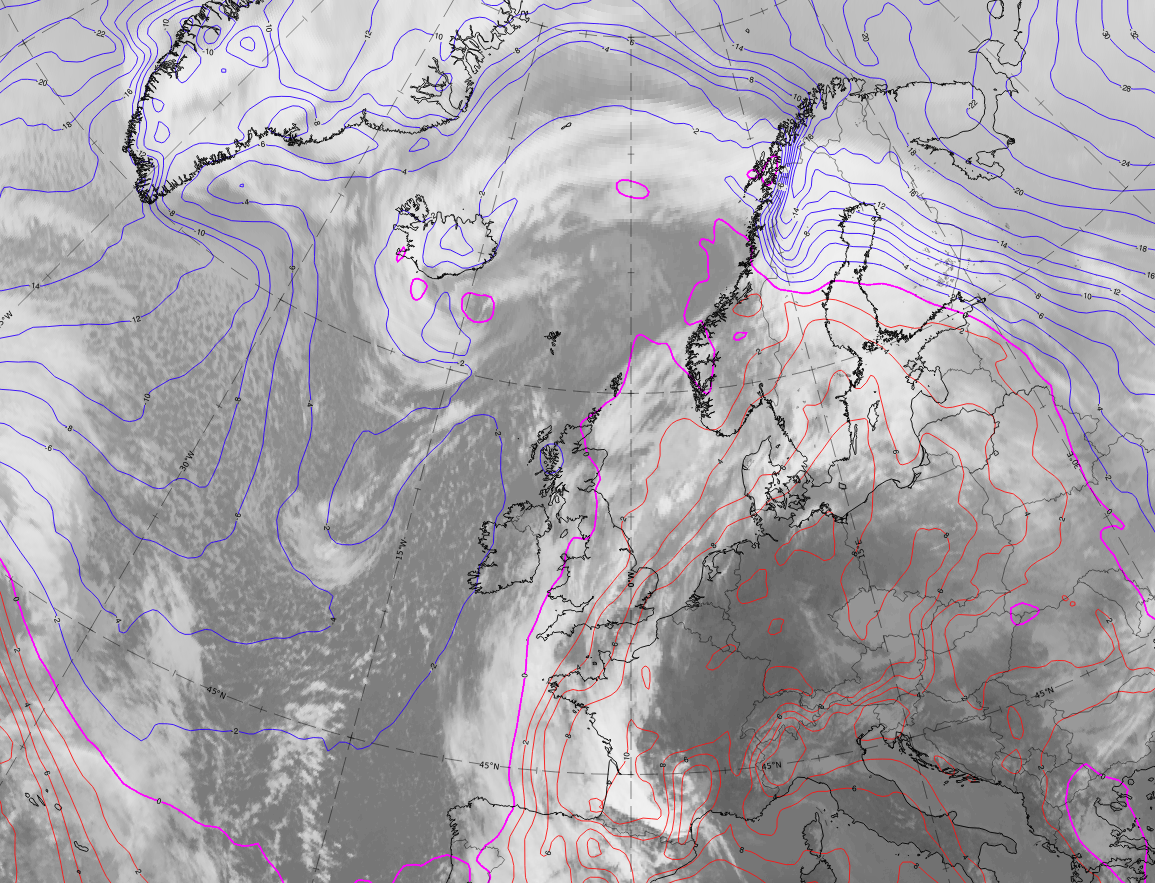
Legend: 20-21 February 2021, HRV.
U.l.: 9 UTC on 20 February 2021, Wave stage; u.r.: 12 UTC on 20 February 2021, Intensification stage; l.r.: 12 UTC on 21 February 2021, Dissipation stage.
Note: To enlarge the image, click on it.
Note: To access the gallery of individual images click here
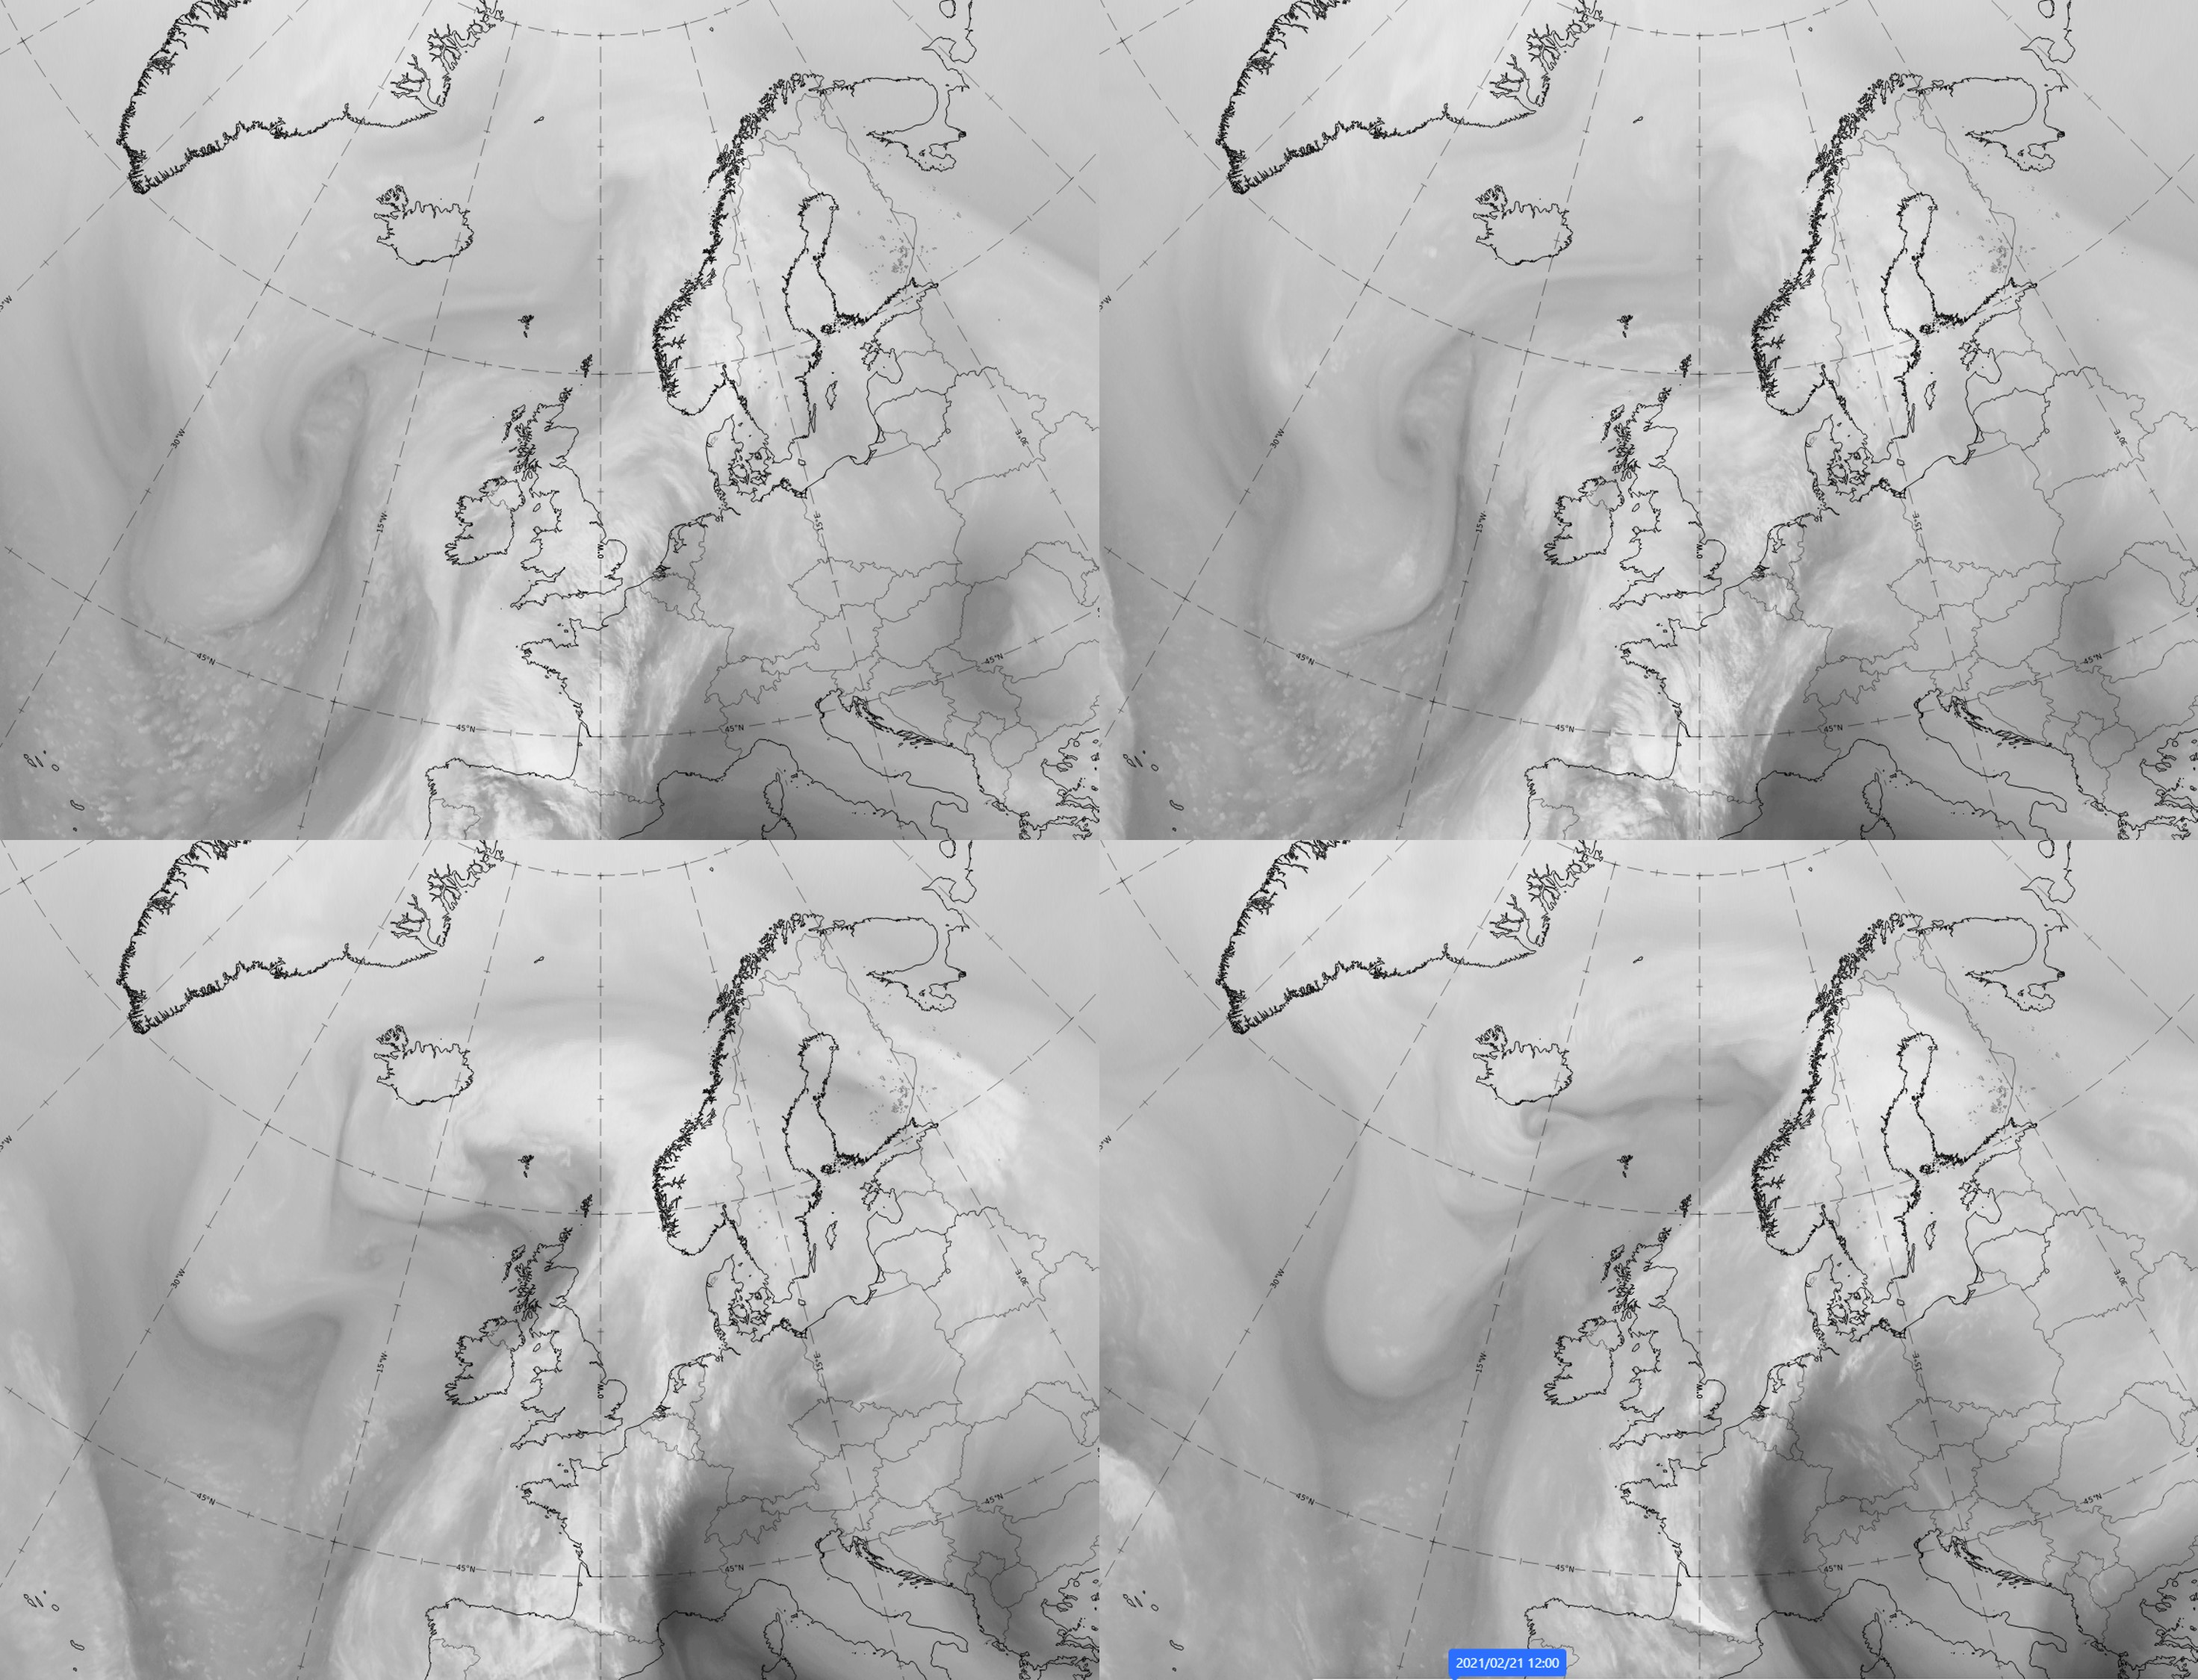
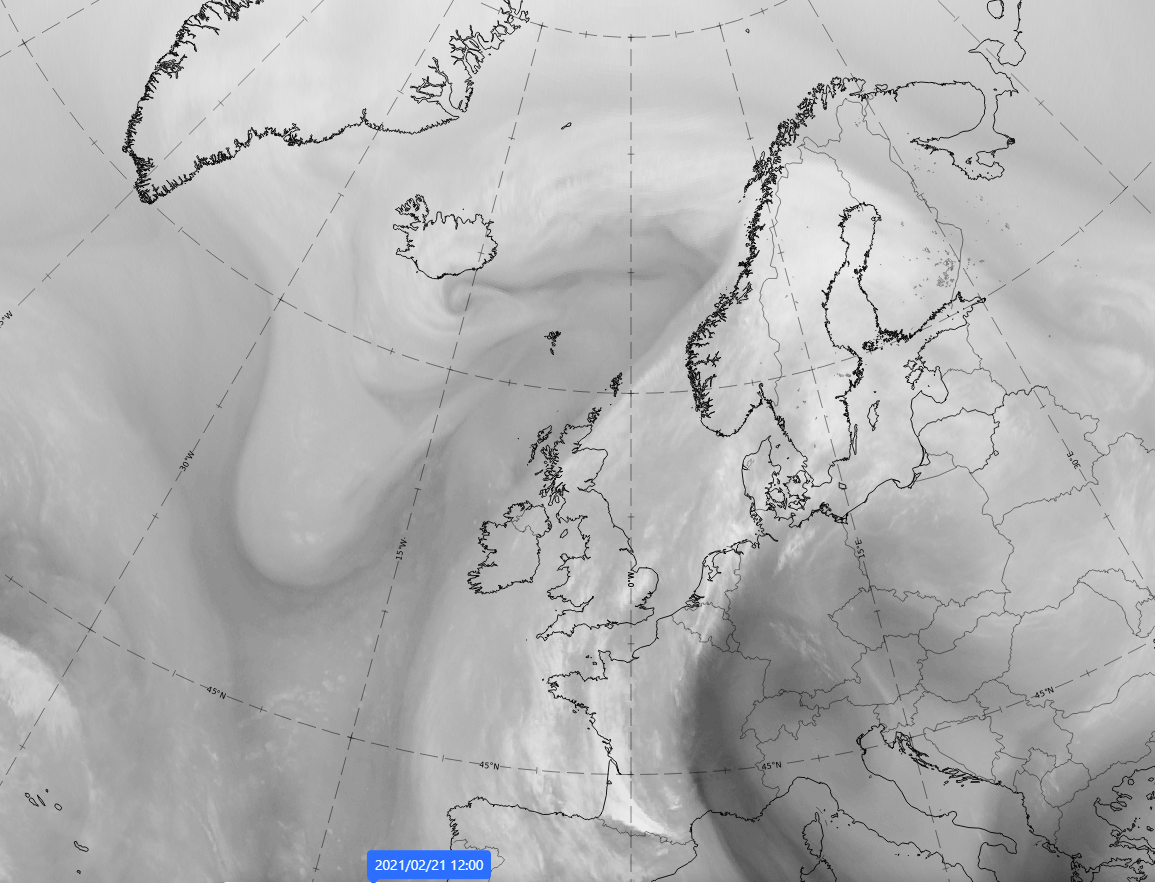
Legend: 20-21 February 2021, WV.
U.l.: 9 UTC on 20 February 2021, Wave stage; u.r.: 12 UTC on 20 February 2021, Intensification stage; 00 UTC on 21 February 2021, Mature stage; 12 UTC on 21 February 2021, Dissipation stage.
Note: To enlarge the image, click on it.
Note: To access the gallery of individual images click here
Legend: 20-21 February 2021, Airmass RGB.
U.l.: 9 UTC on 20 February 2021, Wave stage; u.r.: 12 UTC on 20 February 2021, Intensification stage; 00 UTC on 21 February 2021, Mature stage; 12 UTC on 21 February 2021, Dissipation stage.
Note: To enlarge the image, click on it.
Note: To access the gallery of individual images click here
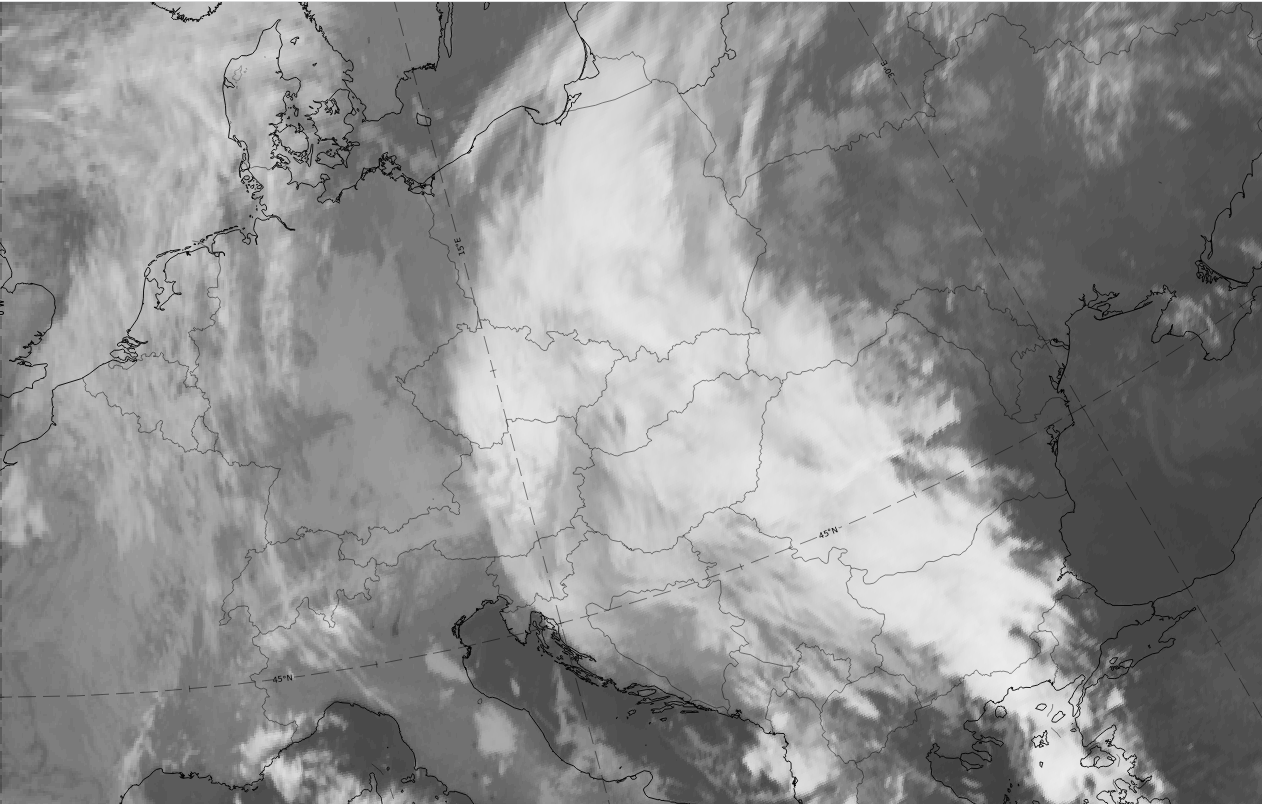
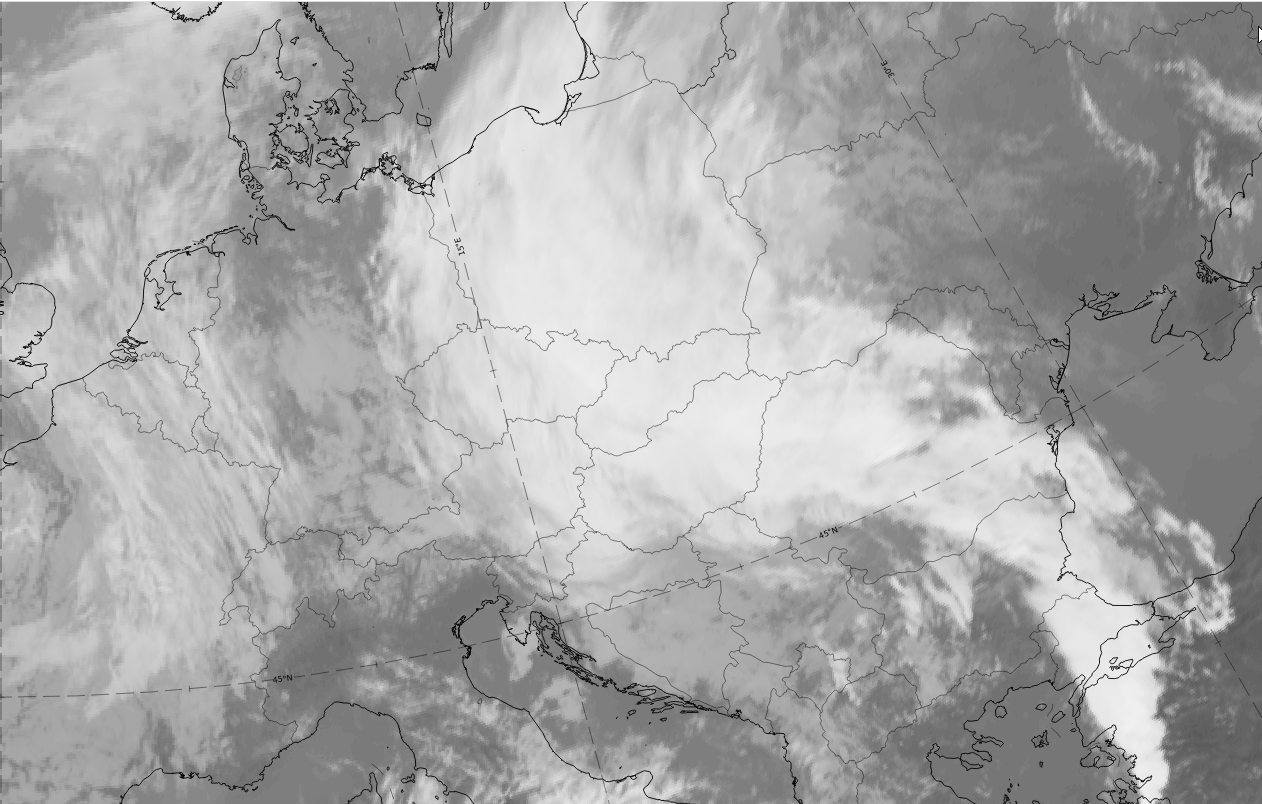
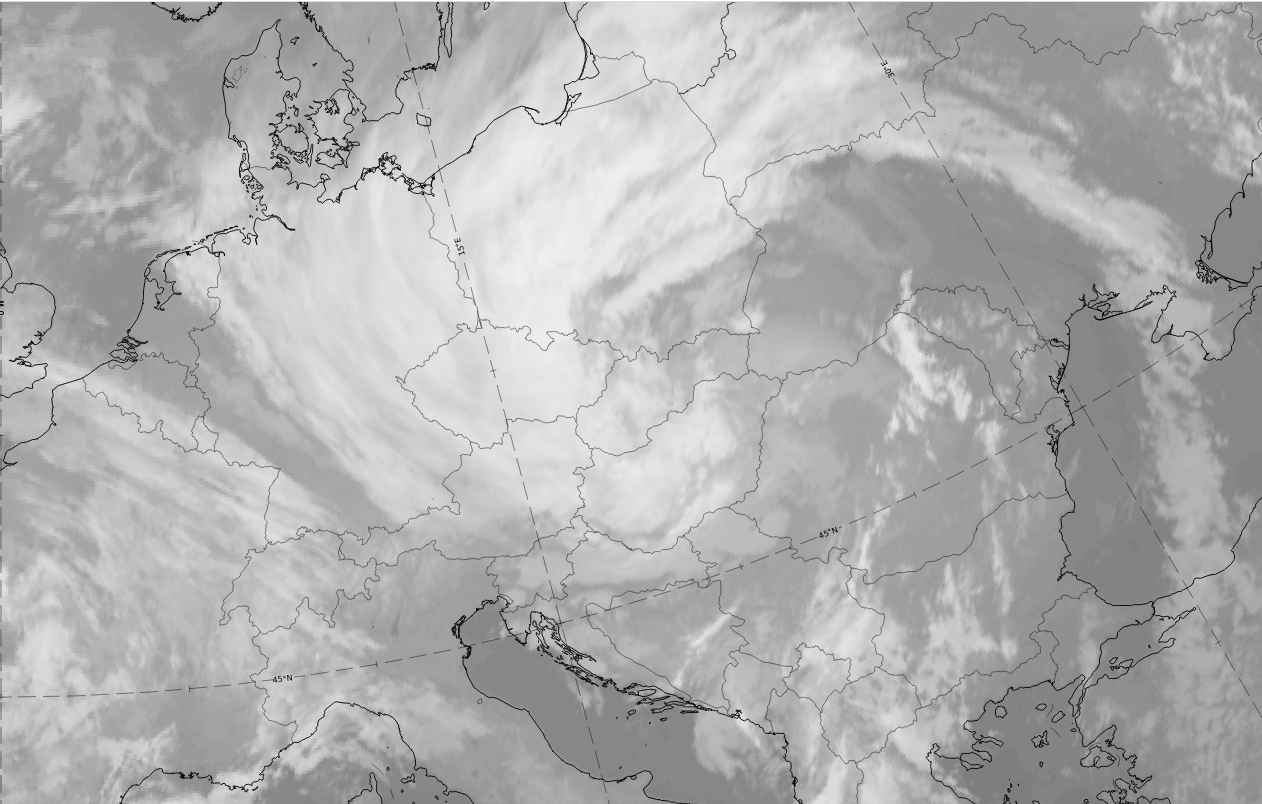
| IR | Both the Wave and Intensification stages show a bright cloud bulge, representing cold cloud tops. In the Wave stage, two frontal systems are just merging with the wave bulge at the western system; in the Intensification stage the cloud bulge has become broader. The Mature stage shows a very bright cloud spiral; this spiral is larger in the Dissipation stage but less bright and the clouds are partly broken. The innermost part of the cloud spiral close to Iceland seems to split off from the eastern part. |
| HRV | Both the Wave and Intensification stages show very bright values, which, together with the IR image, indicate a thick cloud layer. The Dissipation stage shows the splitting of the huge cloud spiral in the innermost part very well. |
| WV | The most important feature in the WV images is the dark stripe at the rearward edge of cold front and within the cloud spiral; it represents sinking dry air. This case shows such a dark stripe very well, however, there seems to be higher humidity at some levels and there are more structures accompanied by dark stripes to the west. These represent a different cloud system, for instance a comma configuration. |
| Airmass RGB | The most important features, indicating dry, possibly stratospheric air, are represented as dark-brown stripes and areas. |
Meteorological Physical Background
The Polar Front Theory of cyclogenesis - the Norwegian model - was an important breakthrough in meteorology (Basics). From the meteorological/physical point of view, several processes occurring in different height layers must be taken into consideration and combined.
1. Polar Front Theory: processes in the lower layers
The processes in the lower layers are described in detail in the chapter Basics. Cold and warm airmasses move against each other, so that the main meteorological phenomena are the temperature wave and the surface pressure deepening.
Legend: Four stages of the classical Polar Front Theory, from the "Wave stage" to the "Dissipation stage".
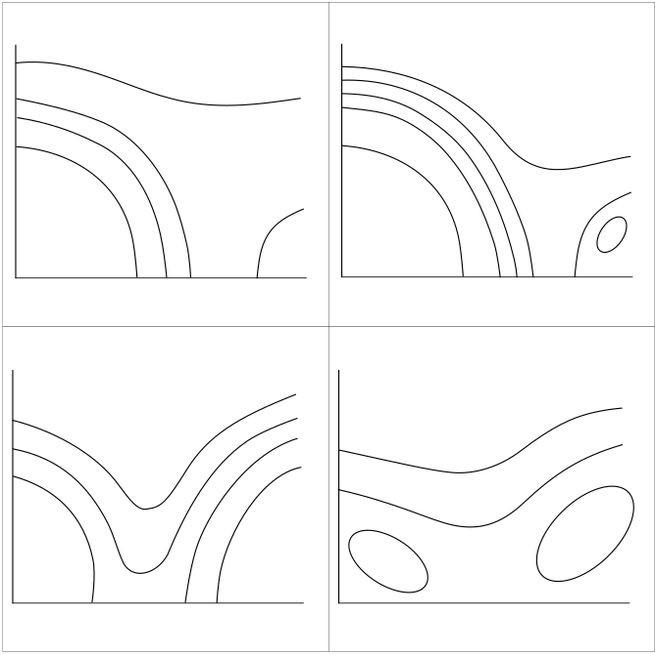
A small-scale disturbance in an air stream can initiate a cyclogenesis process, which starts with the development of a low centre in the lower layers of the troposphere. Consequently, cold air starts to move anticlockwise around a cyclonic low centre, pushing the warm air, which moves anticlockwise against the cold air. The cold air passes under the warm air and thereby lifts it. This leads to the development of weather fronts, which represent baroclinic boundaries. The upward vertical motions at these boundaries is responsible for the development of clouds, which form "Cold Front" (CF) and "Warm Front" (WF) cloud bands. The area between the CF and WF is called the "Warm Sector" (WS), since the warmest air occurs there. At the same time, a cloud bulge develops around the low centre. This development stage is called the "Wave Stage".
The Polar Front Theory further states that the Cold Front moves faster than the Warm Front, progressively narrowing the Warm Sector, while the cloud bulge around the low centre becomes larger and thicker. This is the "Intensification stage".
Later on, the lifted warm air, as well as the connected cloud band, start to move around the low centre forming a cloud spiral. This leads to the "Mature stage", with an occluded front and its accompanying occlusion cloud band. The centre of the surface low, which deepens during this process, remains on the cold side of the of the system.
Further development leads to the "Dissipation stage", with an Occlusion cloud band that can spiral several times around the low centre, or with a comma configuration that can be cut off in the centre of the low or with areas of dissolution of cloud mostly in the southern part of the occlusion spiral.
2. Jets and jet streaks: processes in the upper layers
The first description of the cyclogenesis based on Polar front Theory started from the observations in the lower layers, but as with time measurements from higher layers also became available and new aspects could be added. The first such observations showed high wind speeds close to the tropopause behind and above the front.
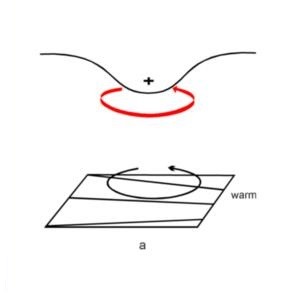
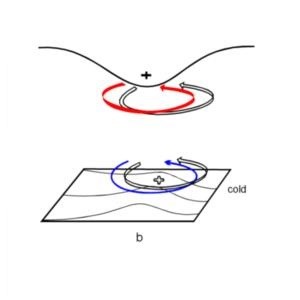
These observations reflected, of course, the jet stream in the upper layers. Jet streams are areas in the upper troposphere with very high wind speeds; the maximum speed is in the centre, while wind speeds decrease in all three directions towards the rim of the jet stream. They can extend thousands of kilometres in the horizontal but only a few kilometres in the vertical.
Jet streams develop at the boundaries between different temperate airmasses and are caused by the gradient force, which tends to balance temperature and pressure differences between different areas. Because of deflection by the Coriolis Force, as well as by orographic obstacles such as the high mountain chains, the jet stream begins to meander and breaks into jet streaks accompanying the frontal systems in upper levels. These are consequently also an important cyclogenesis phenomenon.

The jet axis, described mathematically by the line of zero shear vorticity in the upper levels, extends along the rear side of the cold front cloud band approximately to the south and south-western edge of the wave cloud bulges, in the Wave and Intensification stages. Such wind fields are, because of their inherent shear and curvature, accompanied by cyclonic vorticity and cyclonic vorticity advection (CVA). Maxima of CVA can be found in the centre of the cloud spiral in the Mature and Dissipation stages.
Jet streaks do have a characteristic distribution of these parameters of vorticity and vorticity advection at high levels, as well as in the vertical cross sections.
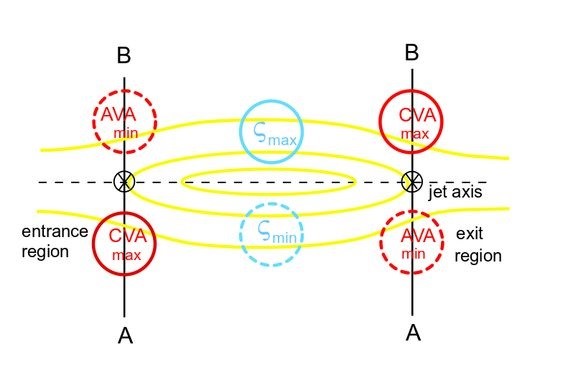
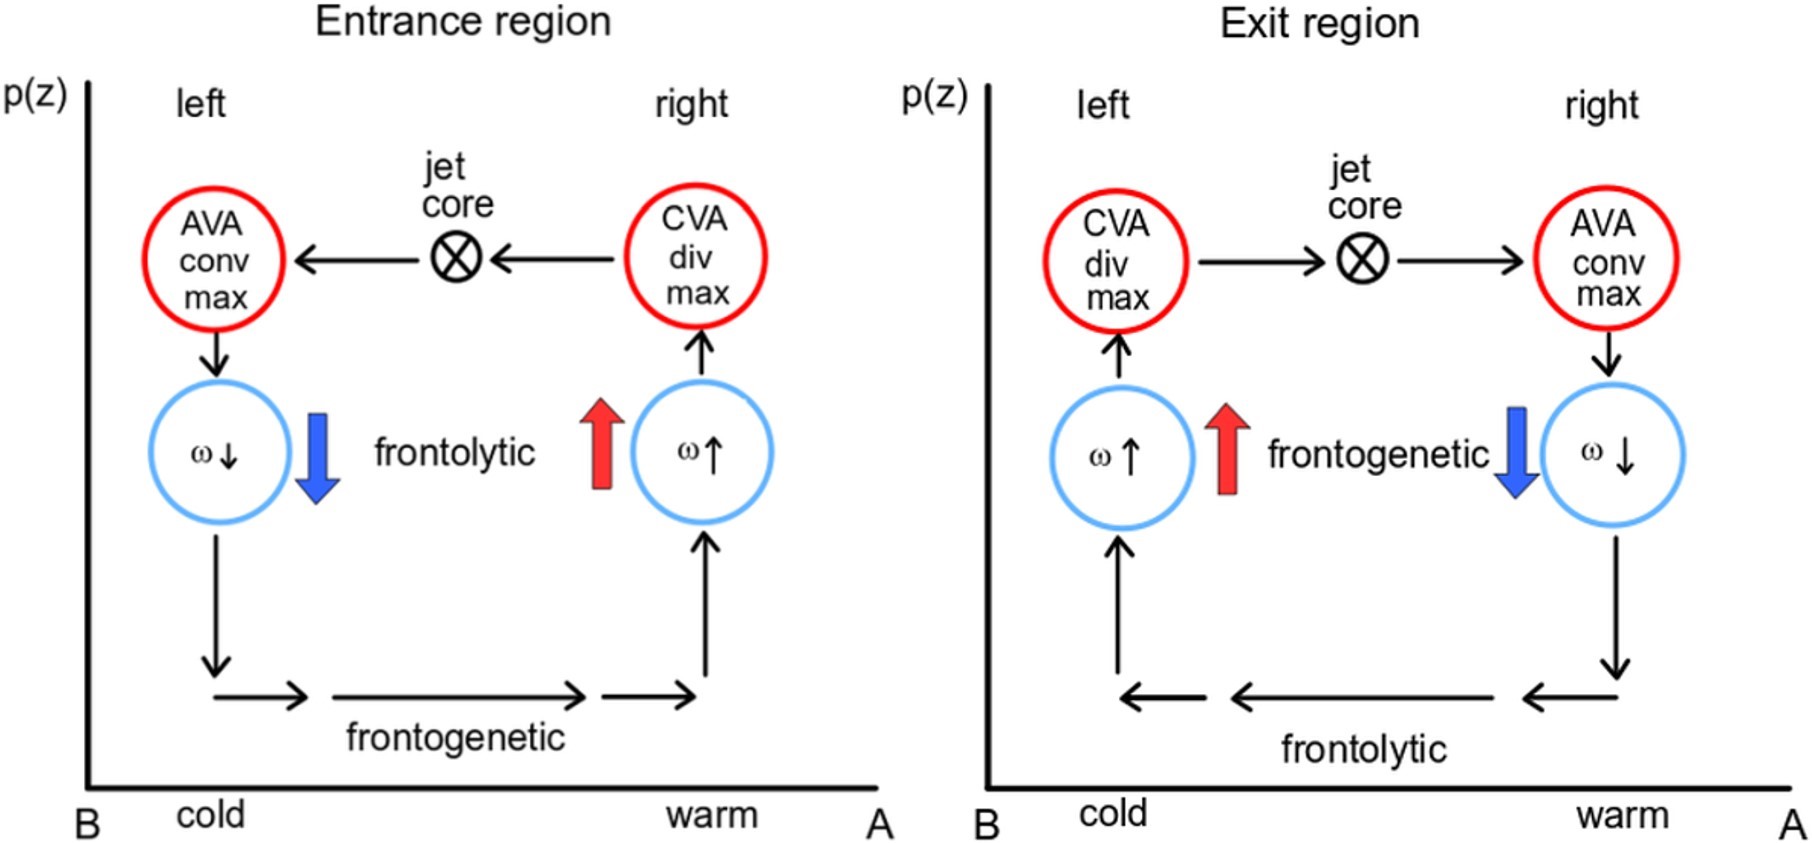
In the northern hemisphere, there are two areas in a jet streak that are preferred areas for cyclogenesis: the left exit region and the right entrance region. For secondary cyclogenesis the preferred area is the right entrance region, while the left exit region is associated more with rapid developments (Rapid Cyclognesis).
Consequently, the Wave stage is connected to cyclonic vorticity advection (CVA) at the jet level and upward motion in the air column. The Intensification and Mature stages in the development from wave to occlusion stage occur on the cold/cyclonic side of the jet streak. (Cold Conveyor Belt Occlusion, Warm Conveyor Belt Occlusion).
3. Tropopause folding, dynamical tropopause and potential vorticity (PV)
Early in the developmental history of cyclogenesis theory, a low tropopause height was found to occur at the CF and in the area of the cyclogenesis development, with a high tropopause occurring along the warm front and within the warm sector.
This is called tropopause folding and has a direct connection to the jet streak and its vertical circulation.
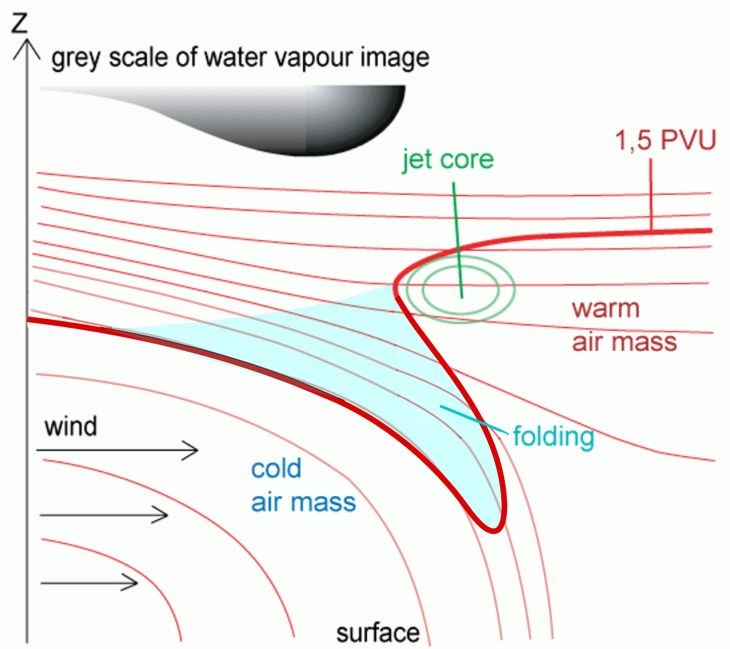
A consequence of tropopause folding is the downward protrusion of stratospheric air into the troposphere. A parameter that describes the qualities of stratospheric and tropospheric air masses very well is Potential Vorticity (PV).

The protrusion of stratospheric air into the troposphere - also called a PV anomaly - causes decreased stability and consequently an increase of vorticity. Values of PV in the stratosphere are higher than 2 PV units, and in the troposphere lower. The 2-PV-unit surface is also called the dynamical tropopause.
This is the focal point of Hoskins Theory in which the increased vorticity above and the thermal wave in lower layers form a tube in which a mutual increase of rotation takes place.
For most of the cyclogenesis events starting in the right entrance region of a jet streak, the PV anomaly does not reach downward into layers close to the surface but only into moderate heights, approximately to 500 - 600 hPa. However, there are cyclogenesis types where the PV tube does reach down to very low levels; these are called "Rapid cyclogenesis" and are described in detail in this manual (Rapid Cyclognesis).
Key Parameters
The four cyclogenesis development stages in a Polar Front Theory type are:
- Wave stage
- Intensification stage
- Mature stage
- Dissipation stage
The key parameters of a cyclogenesis process, according to the Polar Front Theory, are:
- Geopotential height at lower and upper levels.
- Thermal parameters (temperature and temperature advection at 850 hPa or 700 hPa, thickness between 1000 and 500 hPa and thermal frontal parameter TFP).
- Upper-level parameters (wind speed, cyclonic vorticity advection and potential vorticity).
The main characteristics and the changes in key parameters during the four development stages are shown and discussed here. For more details look at the relevant individual CMs.
The typical behaviour of the key parameters is demonstrated here for an actual case from 20-21 February 2021.
This case shows, in its first phase of the development, a feature not seen in every case and therefore not a typical cyclogenesis feature: a merging of two frontal systems. One is a broad cloud band extending from Spain across the British Isles into the North Sea and the other is a little further west over the Atlantic. The wave develops on the western system and its cloud configuration is fully developed at 09:09 UTC on 20 February 2021, when the mixing process between the two systems is nearly complete.

Legend: 20-21 February 2021, IR.
U.l.: 09 UTC on 20 February 2021, Wave stage; u.r.: 12 UTC on 20 February 2021, Intensification stage; 00 UTC on 21 February 2021, Mature stage; 12 U&TC on 21 February 2021, Dissipation stage.
Note: To enlarge the image, click on it.
Note: To access the gallery of individual images click here
Typical key parameter features for a cyclogenesis process of the Polar Front type
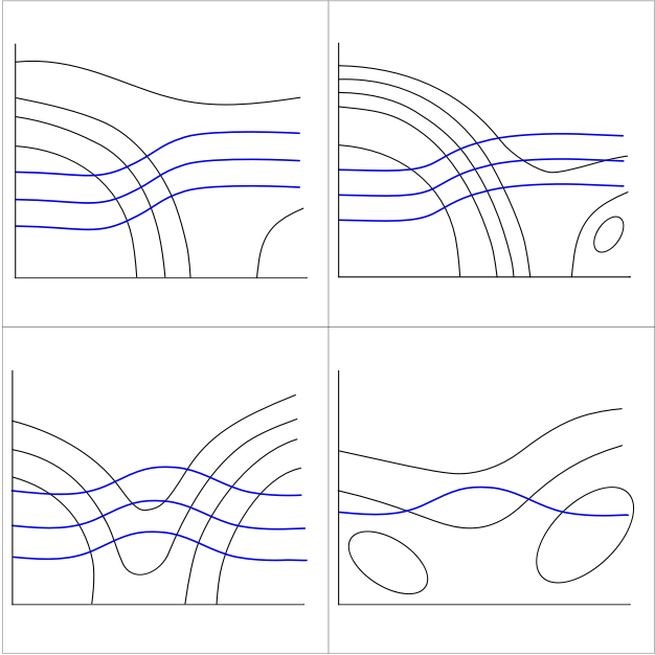
Geopotential Height
- 1000-hpa height (or close to the surface):
- In the Wave stage, a distinct trough can be seen in the low-level geopotential isolines in the wave area, which is characterised by the cloud bulge near the connection point between the cold and warm fronts. This trough sharpens between Wave and Intensification stages, finally forming a closed low centre.
- In the Mature and Dissipation stages, the isolines indicate that the low deepens in the centre of the occlusion spirals, so that at the end there is a pronounced low at the surface.
- 500-hpa height (or any upper level):
- In the Wave stage, an upper-level trough exists to the west of the cold front and wave cloud. This trough deepens and moves closer to the frontal system. In the Mature and the Dissipation stages, a pronounced closed low centre usually exists, which catches up with the low centre at low levels, leading to a low centre with a vertical axis throughout the whole troposphere.
Legend:
Schematics of geopotential Height at 1000 hPa (magenta) and 500 hPa (cyan).
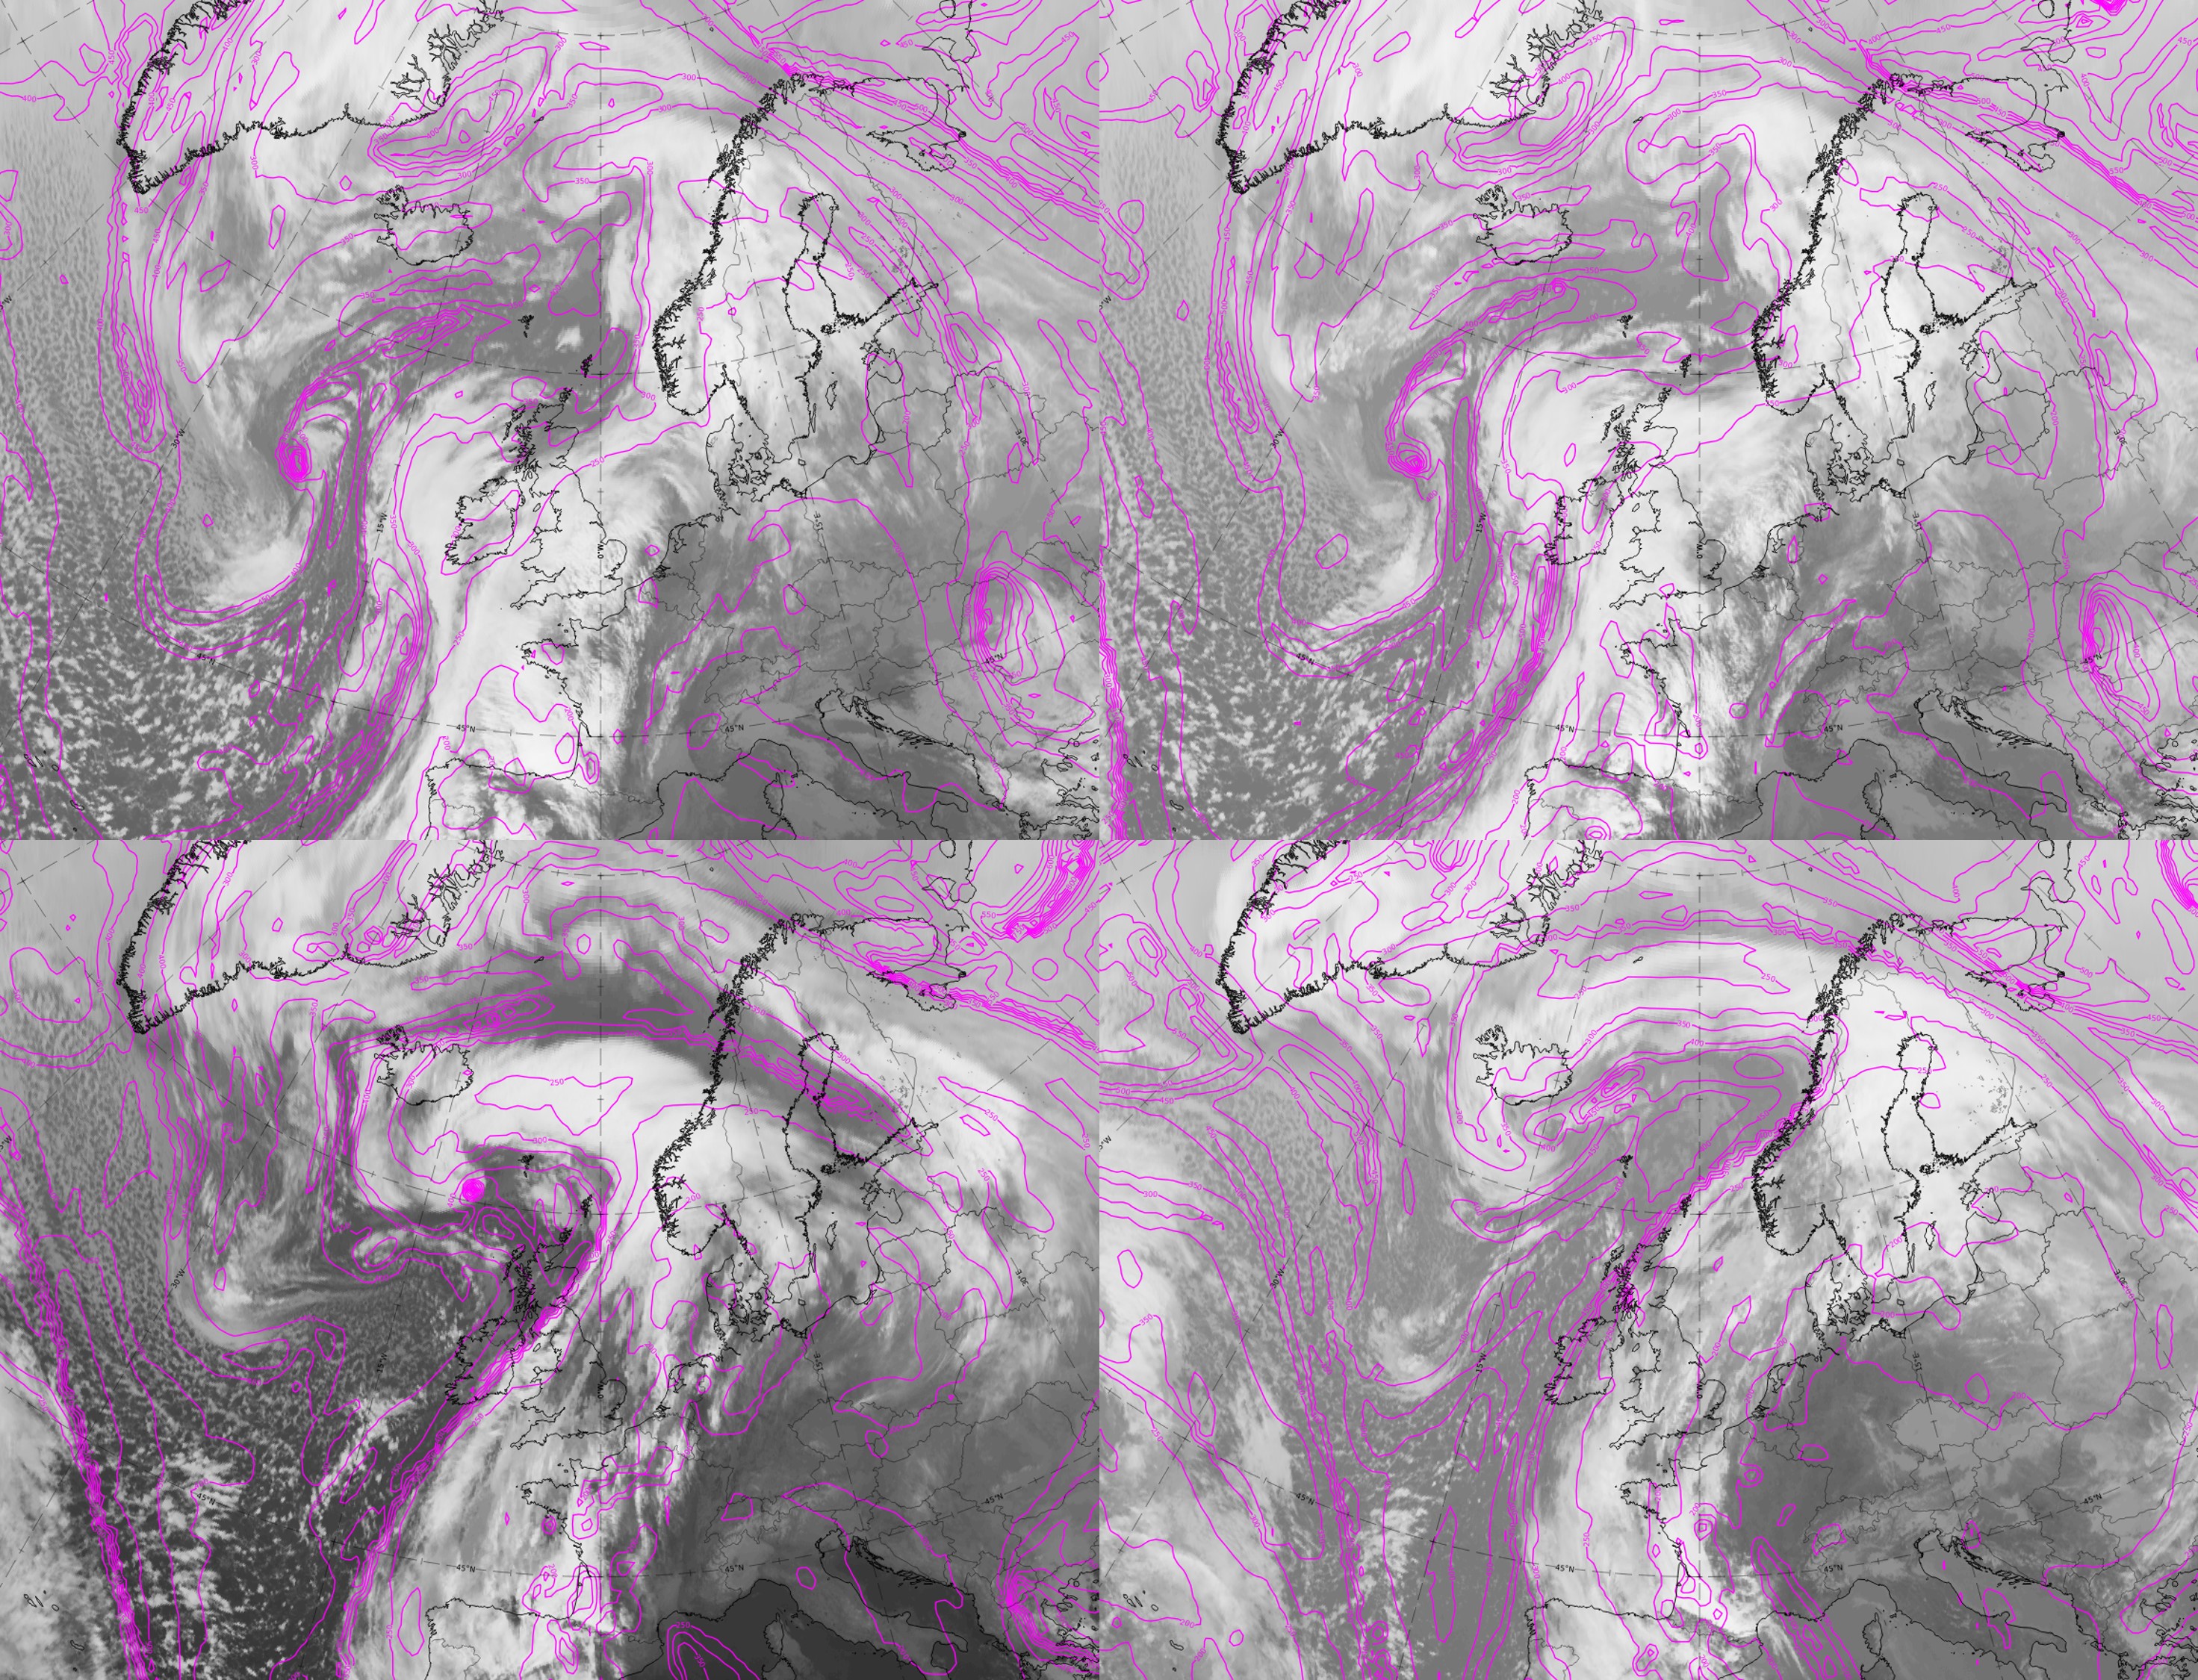
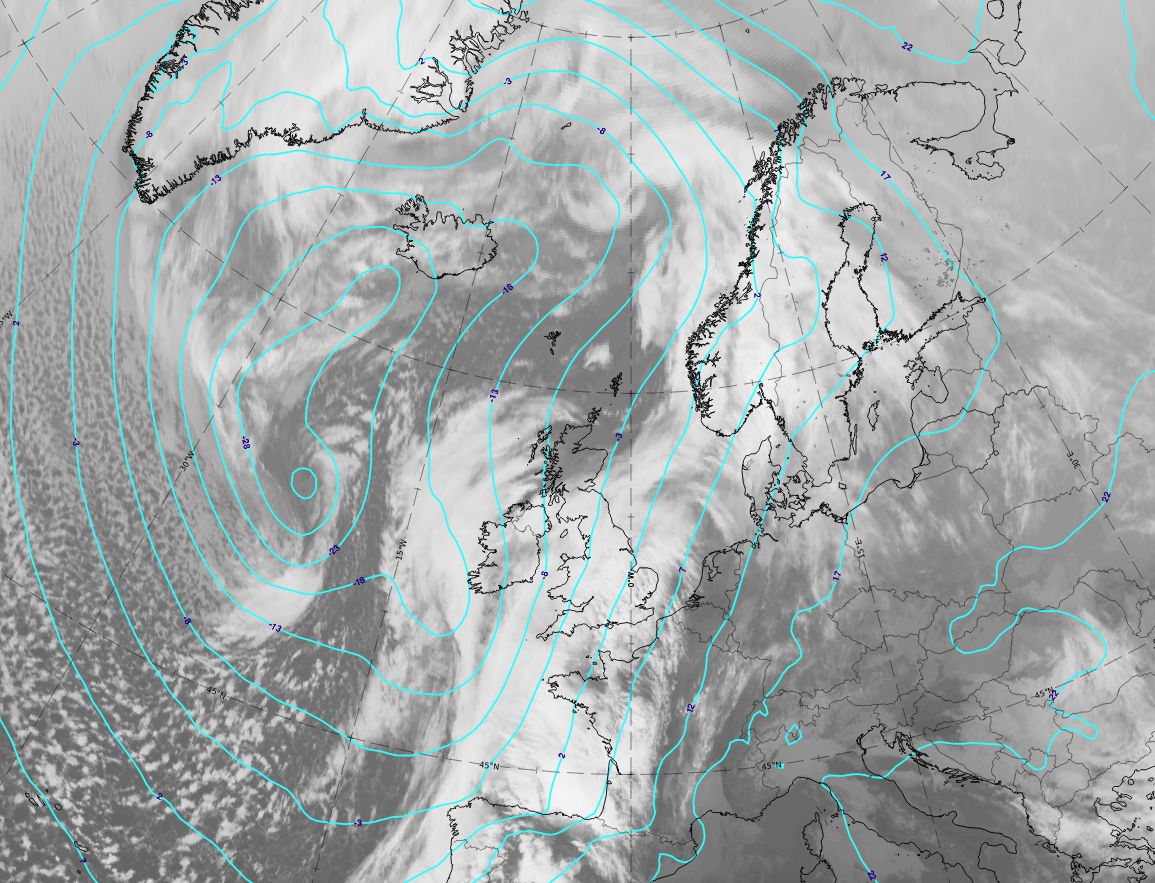
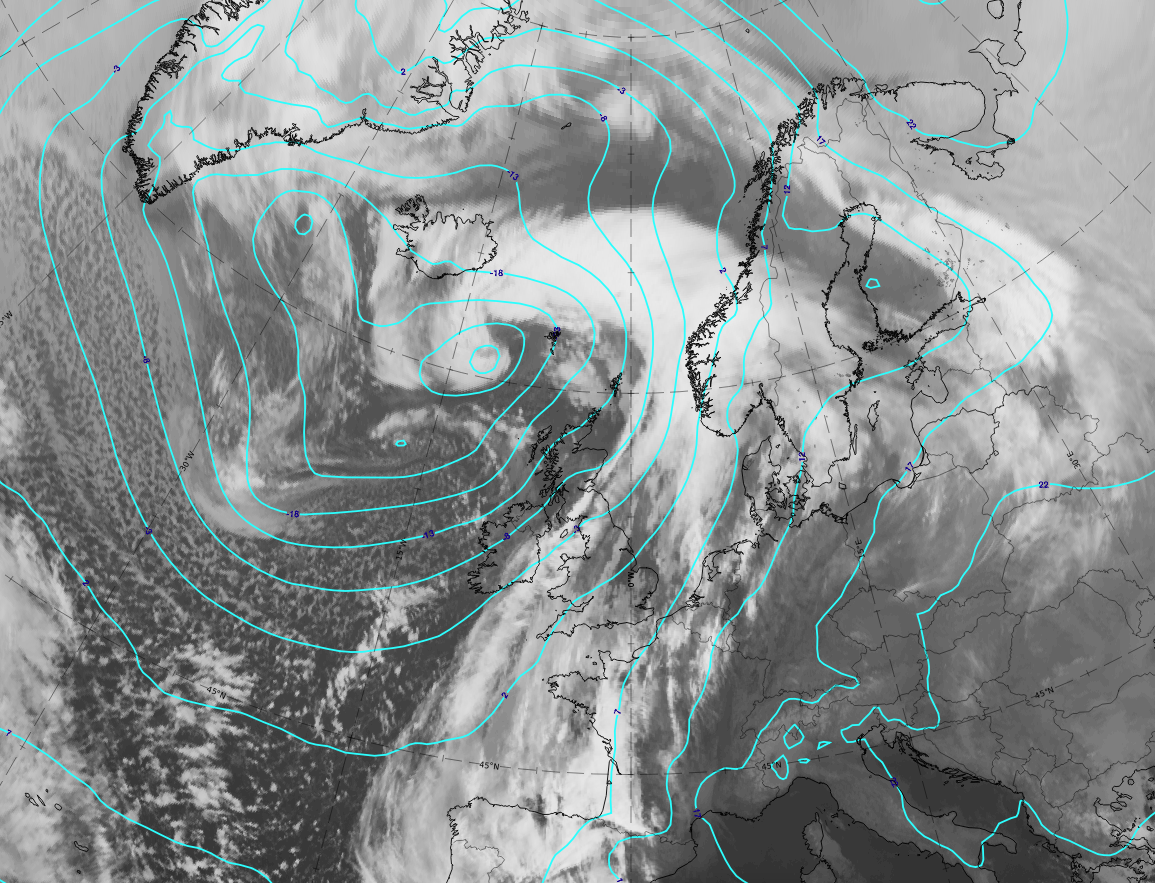
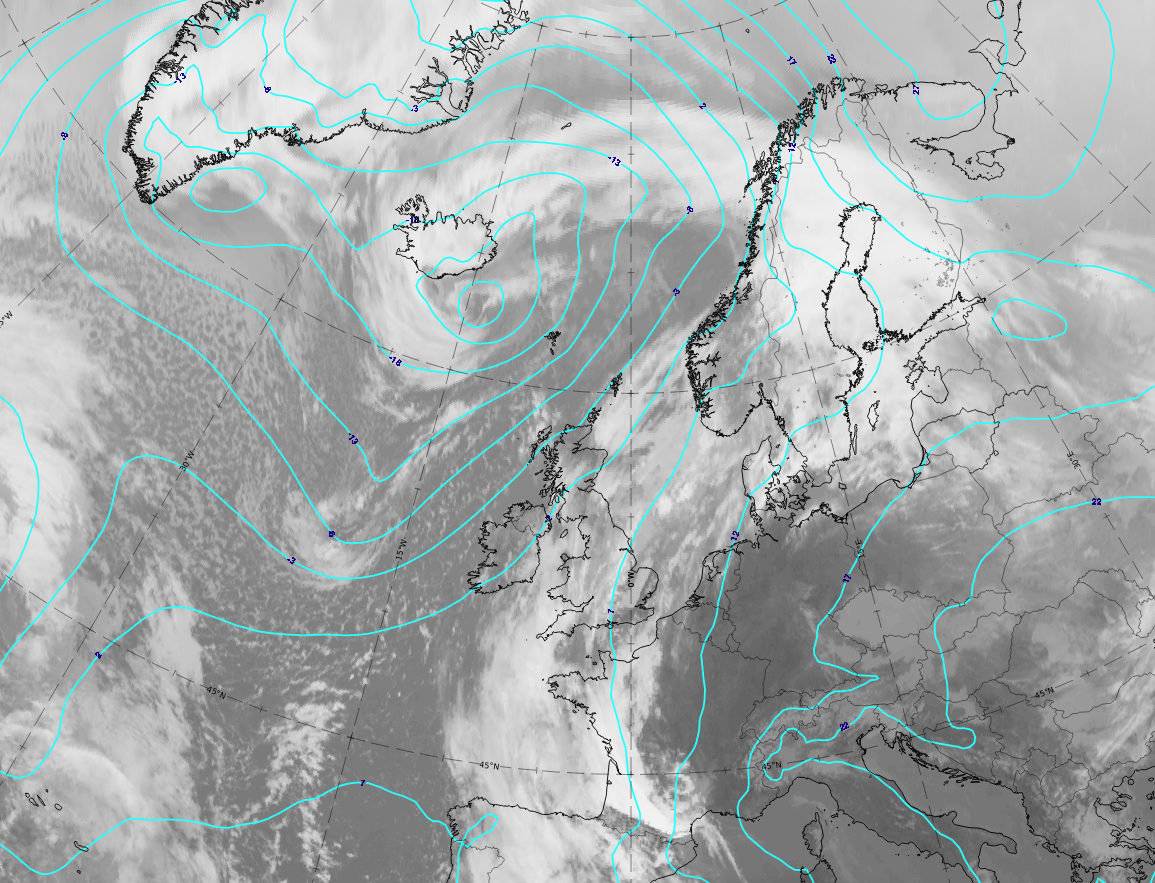
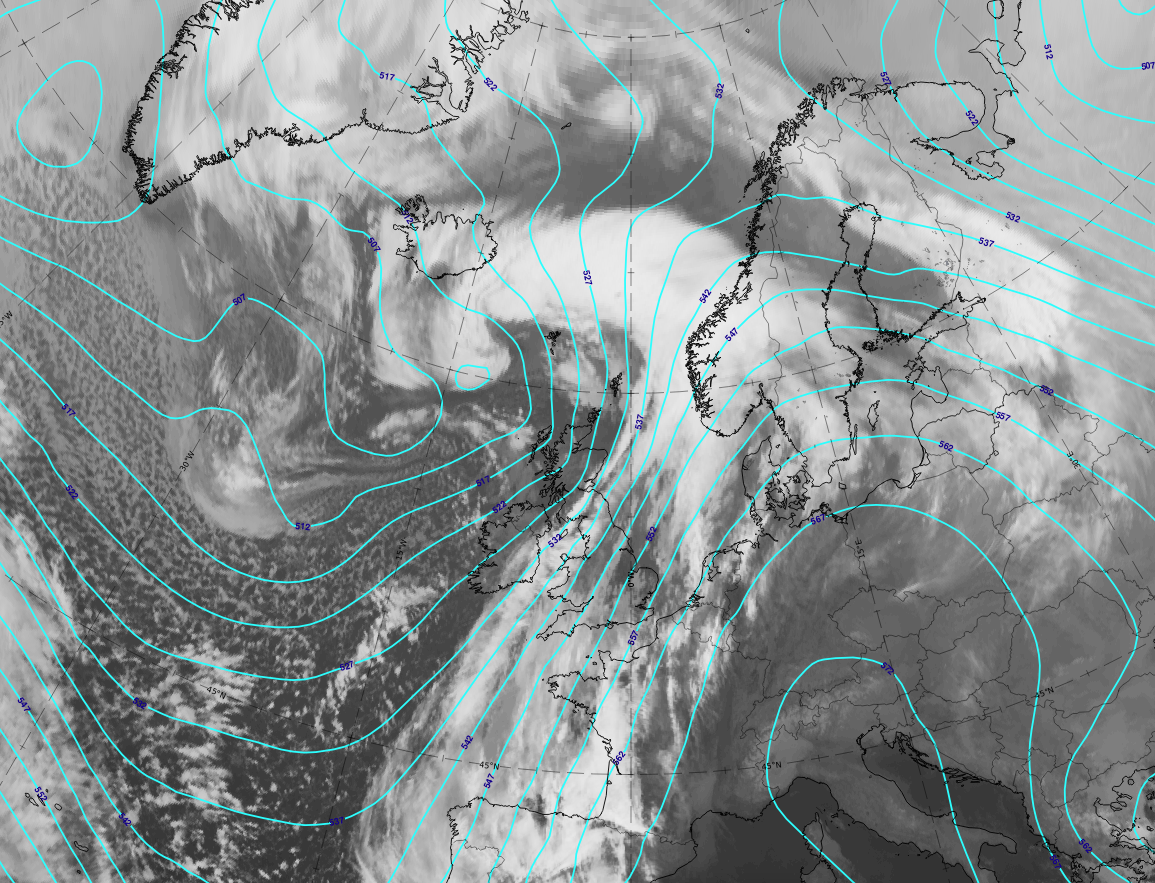
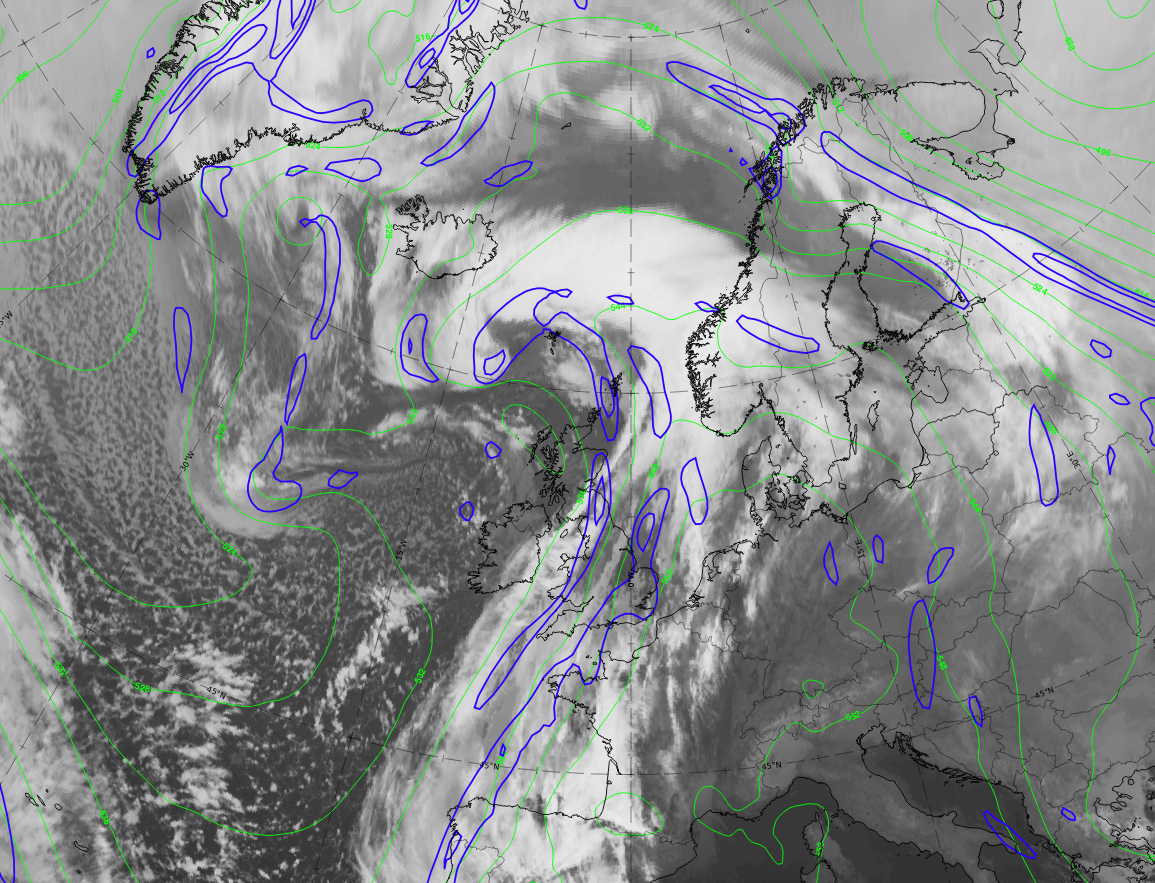
Legend: 20-21 February 2021. IR; geopotential height at 1000 hPa (cyan).
U.l.: 09 UTC on 20 February 2021 Wave stage; u.r.: 12 UTC on 20 February 2021, Intensification stage; 00 UTC on 21 February 2021, mature stage; 12 UTC on 21 February 2021, Dissipation stage.
Note: To enlarge the image, click on it.
Note: To access the gallery of individual images click here
The low at 1000 hPa develops from a trough feature to the west of Ireland in the Wave stage west to a closed circulation in the Intensification stage and deepens in the Mature stage as well as the Dissipation stage.
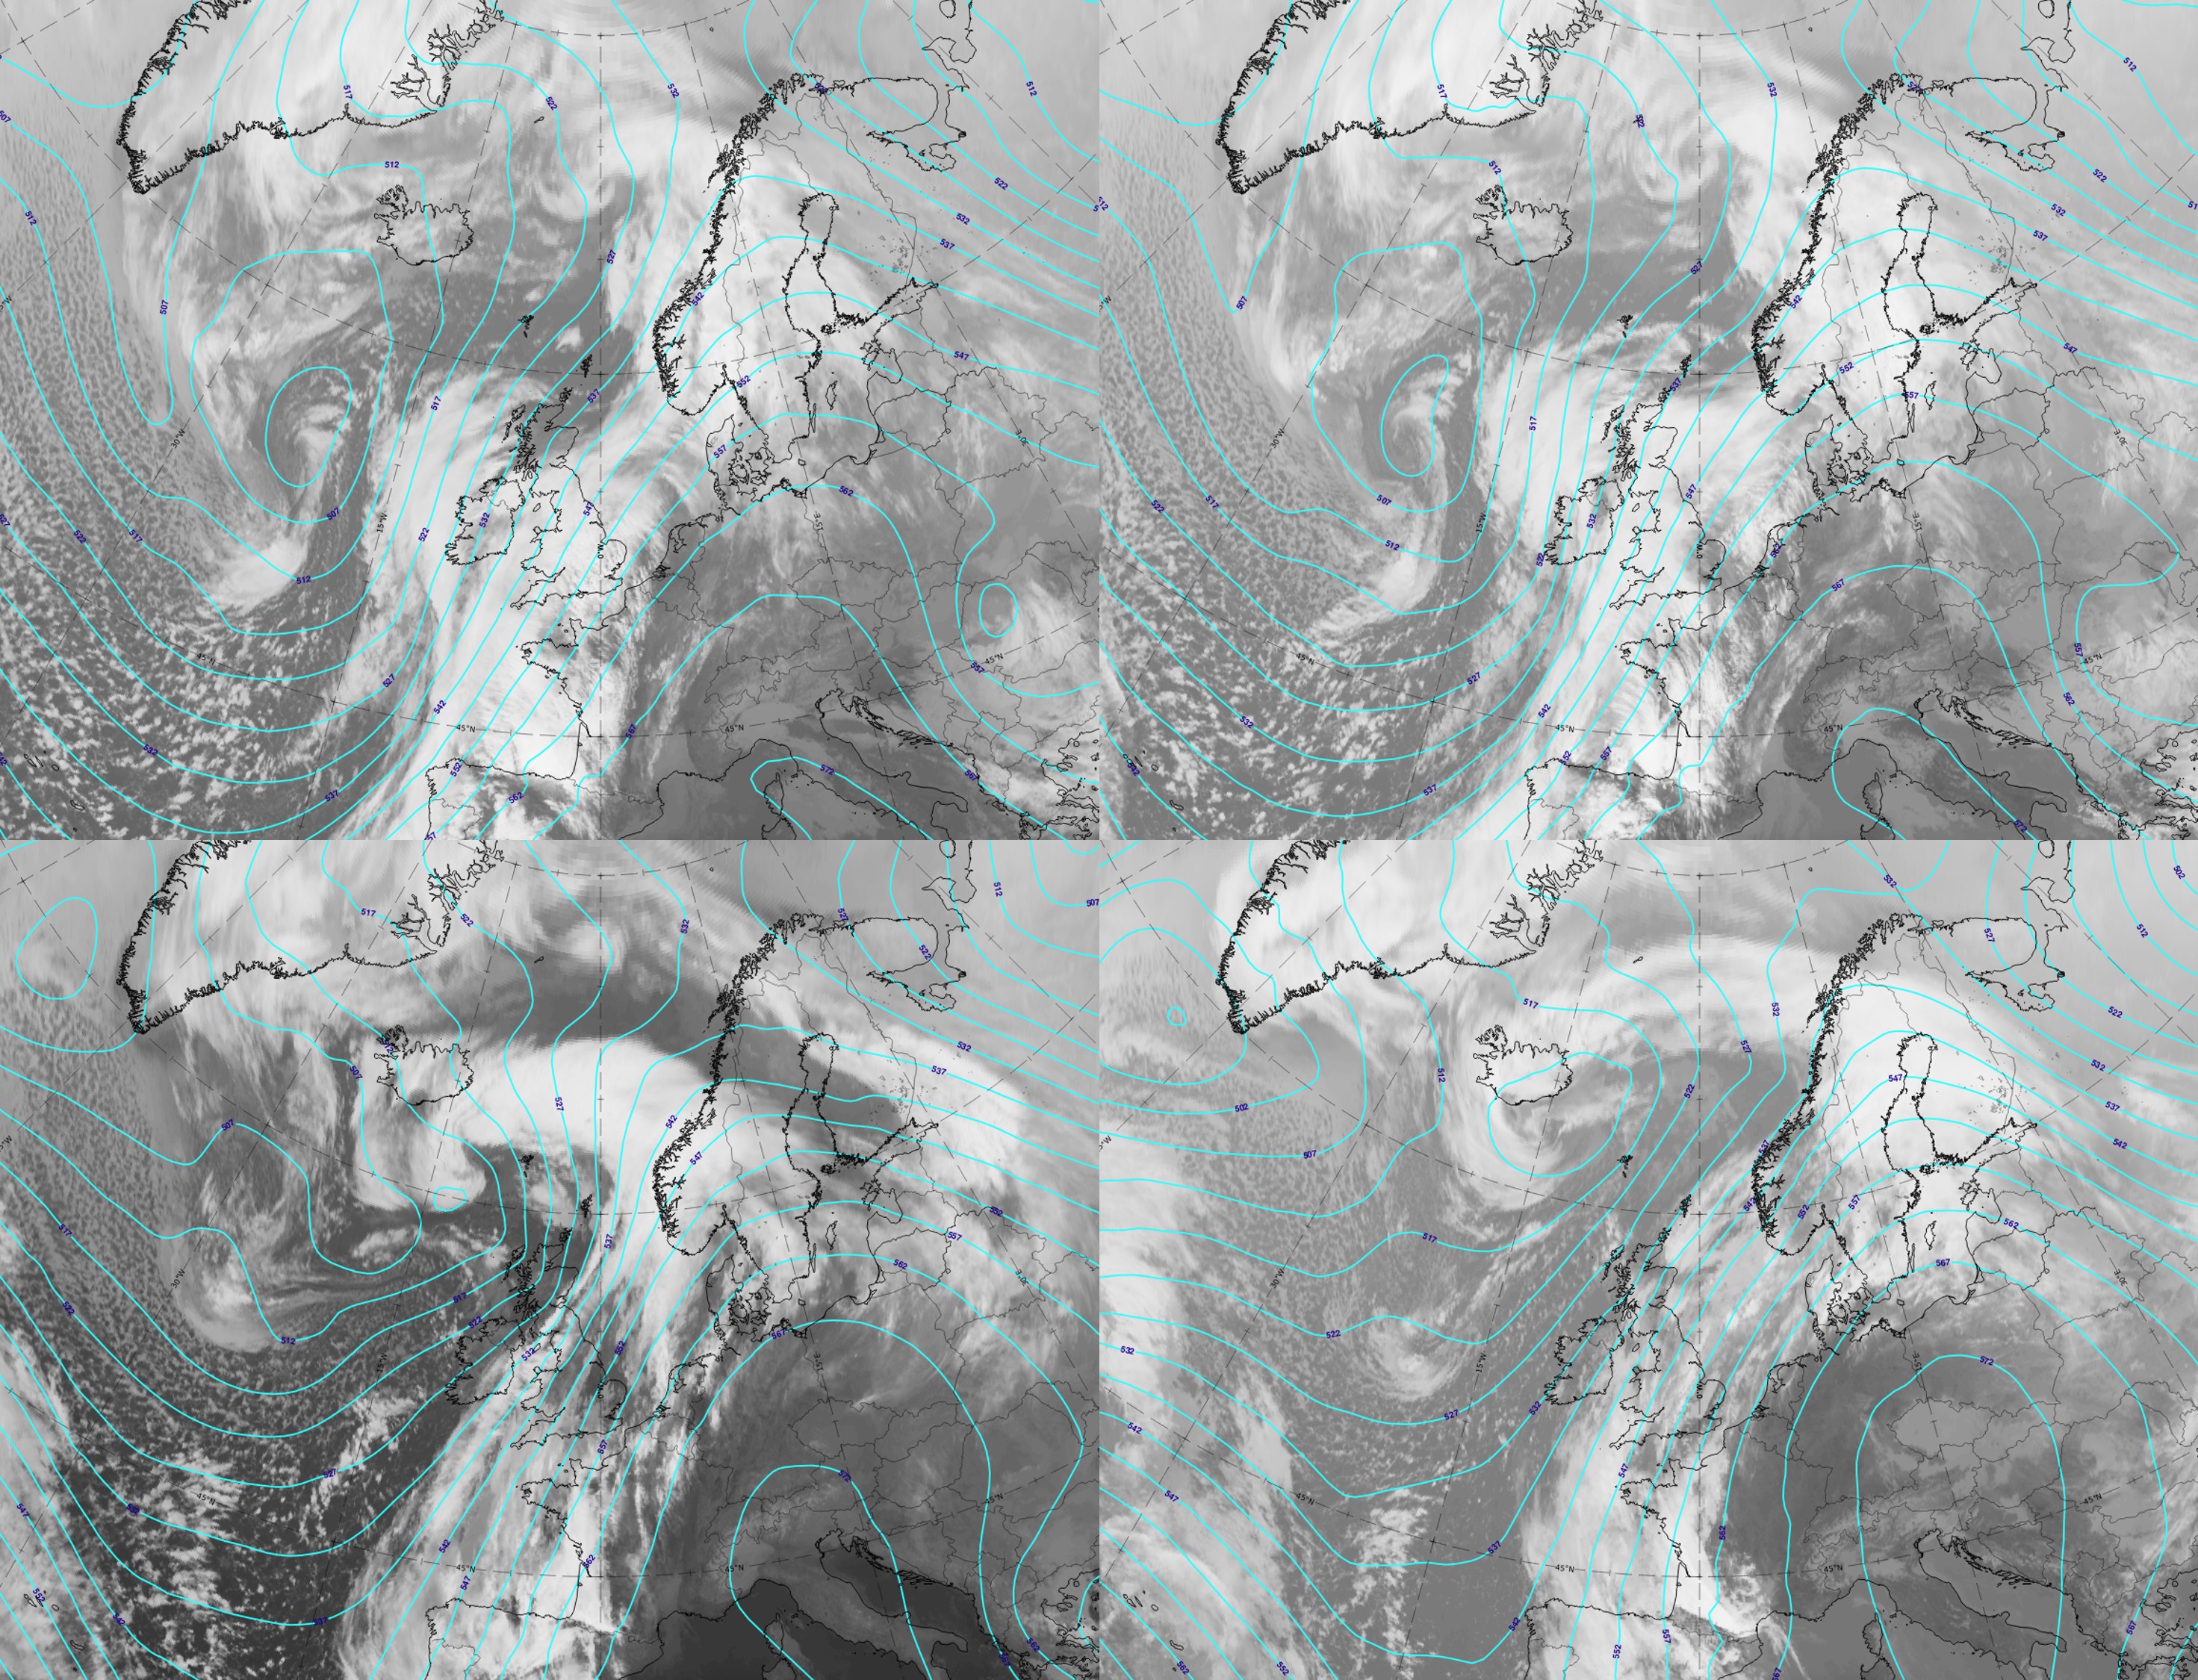
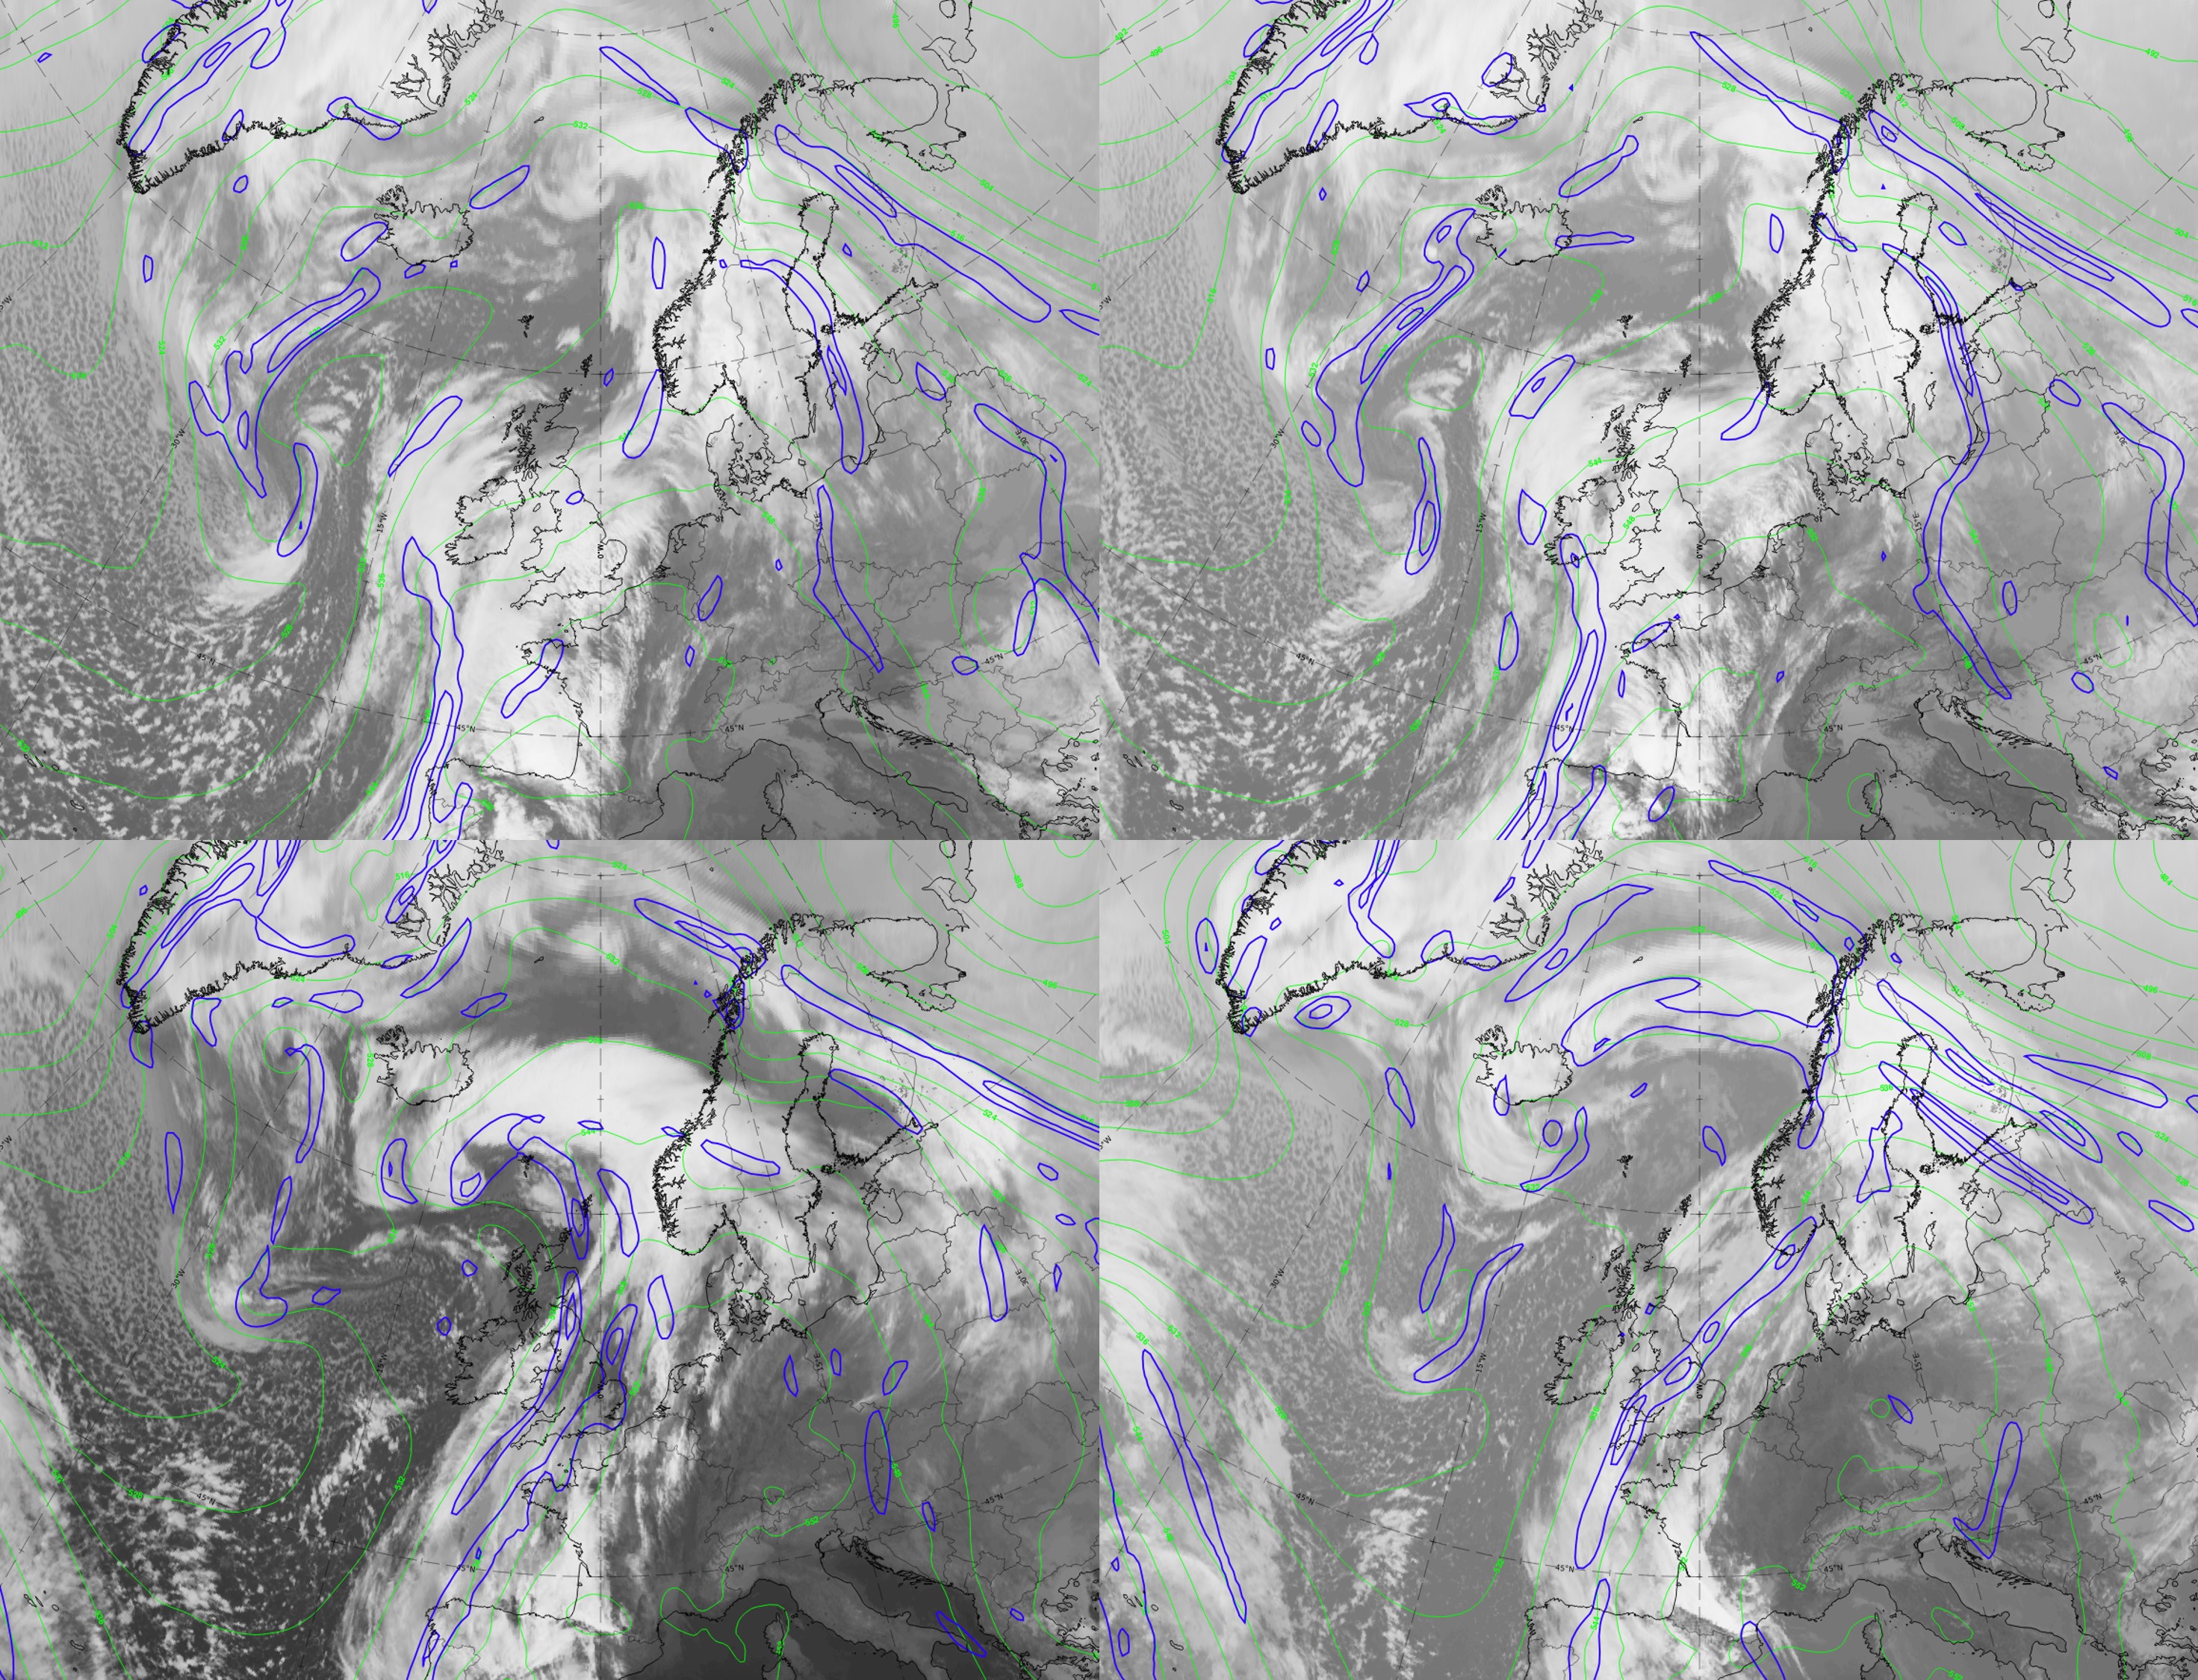
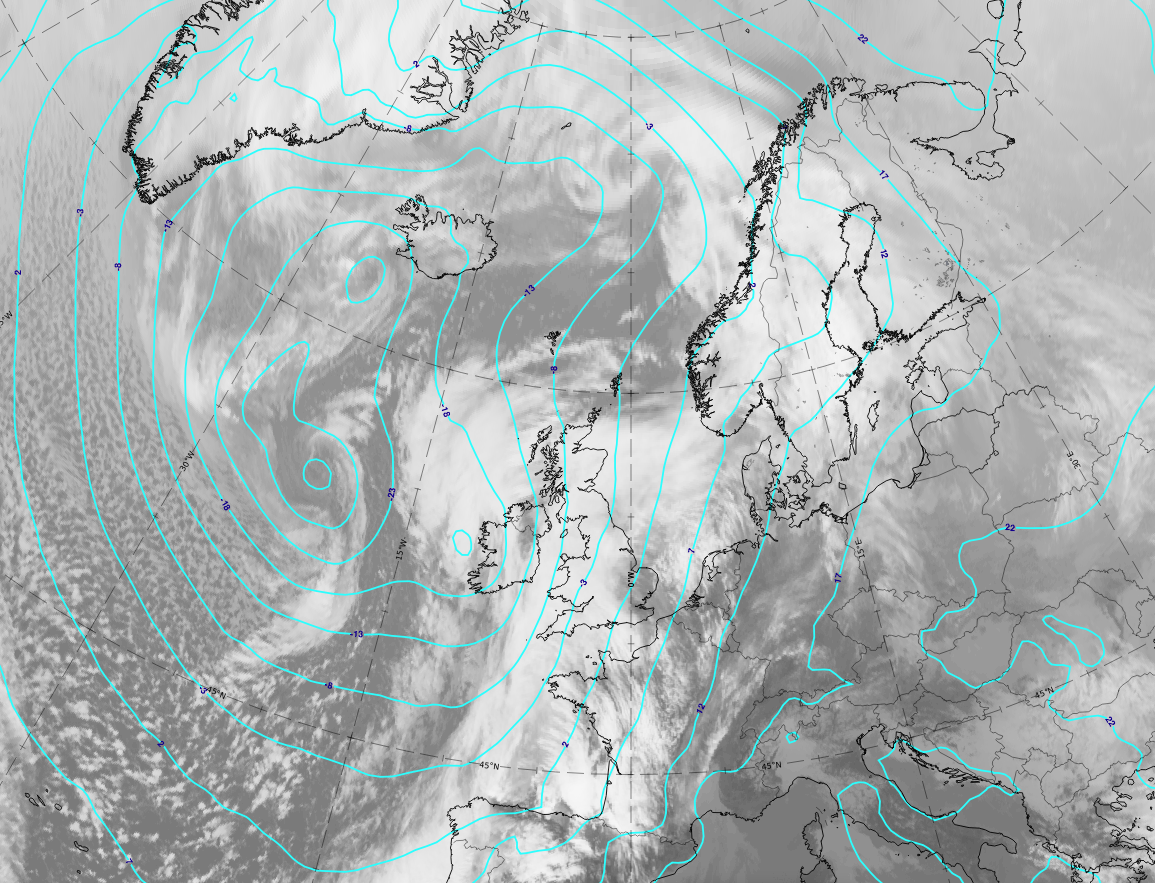
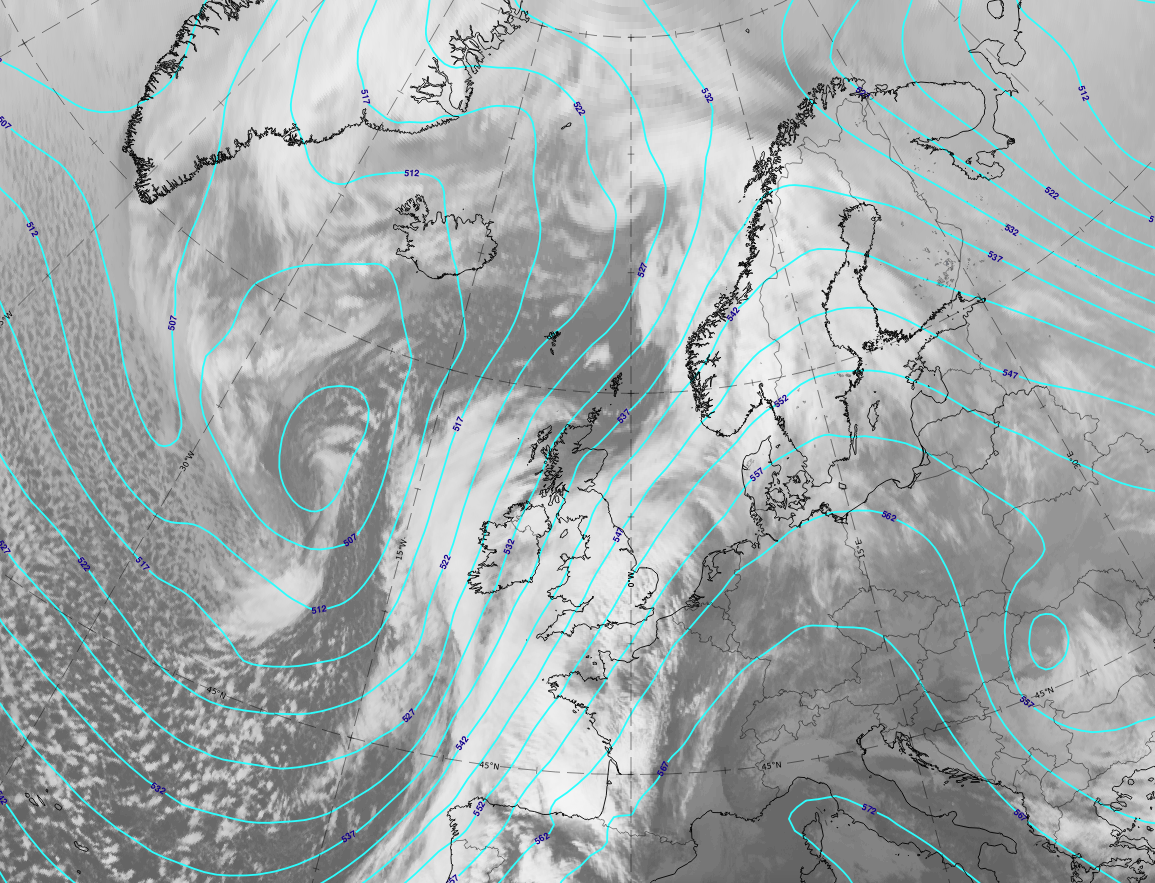
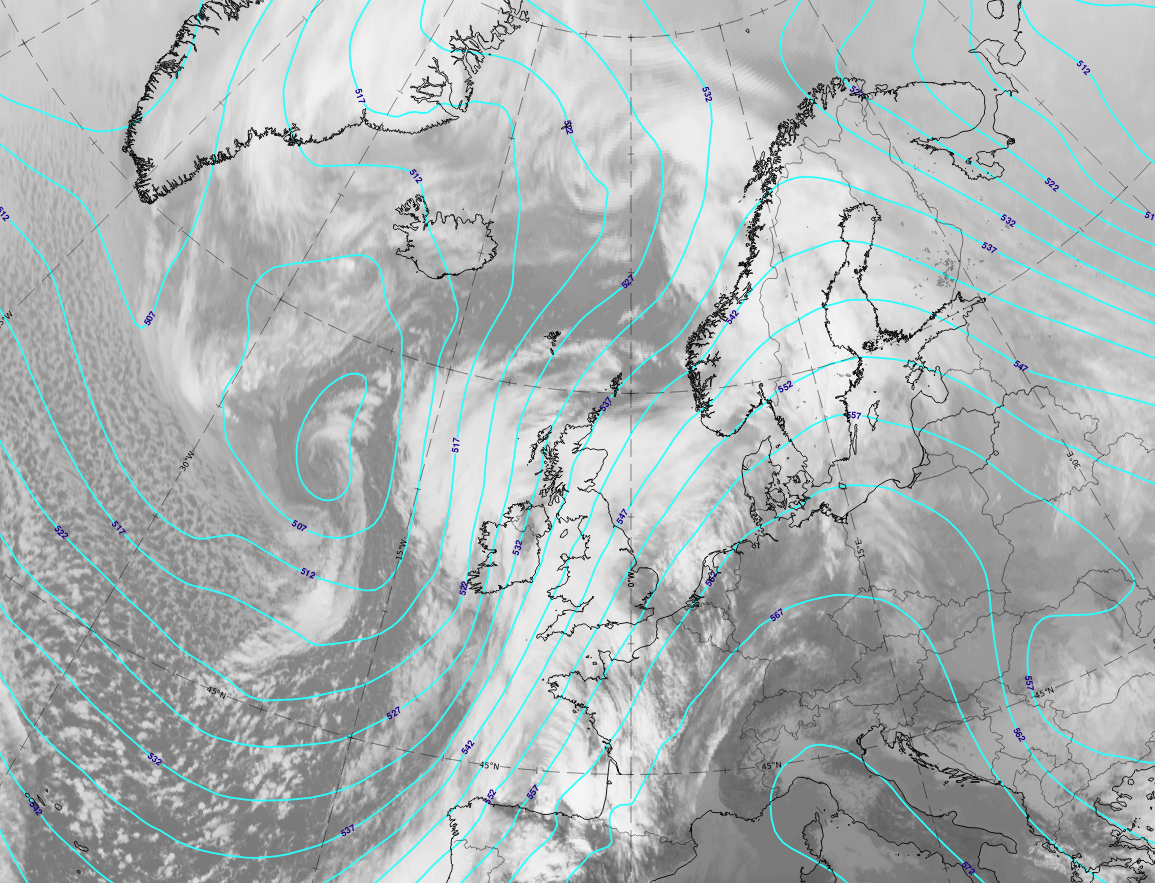
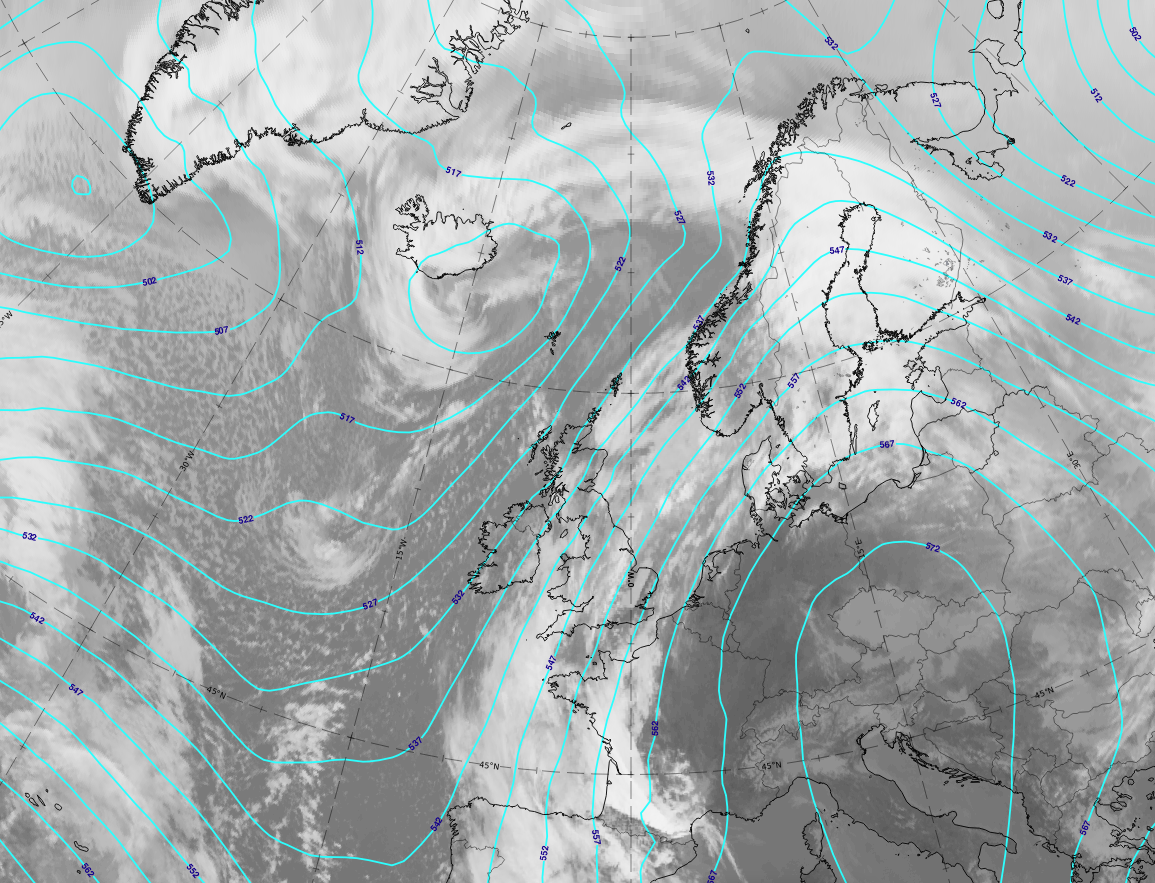
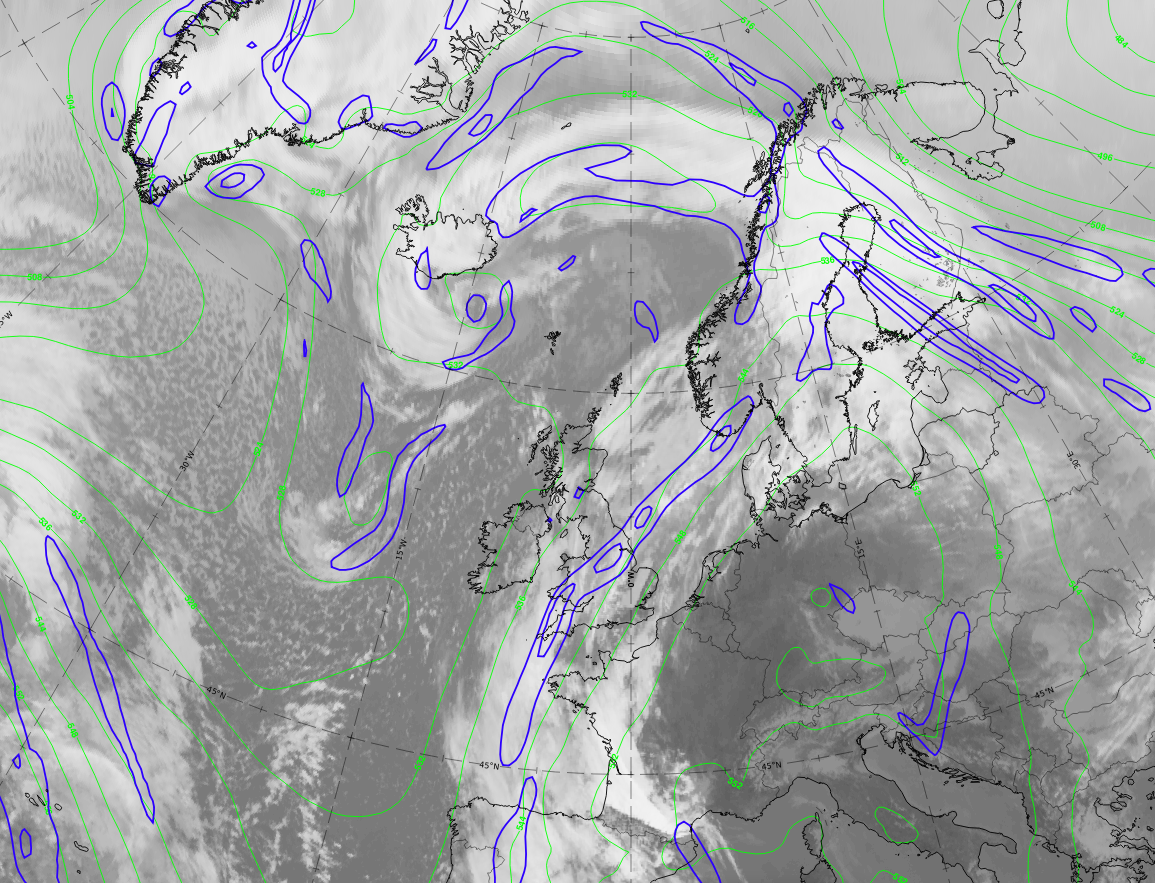
Legend: 20-21 February 2021. IR; geopotential height at 500 hPa (cyan).
U.l.: 09 UTC on 20 February 2021, Wave stage; u.r.: 12 UTC on 20 February 2021, Intensification stage; 00 UTC on 21 February 2021, Mature stage; 12 UTC on 21 February 2021, Dissipation stage.
Note: To enlarge the image, click on it.
Note: To access the gallery of individual images click here
The geopotential height at 500 hPa shows, in the "Wave stage", a pronounced trough to the rear of the cloud bulge. The trough lines approach the intensified cloud bulge in the Intensification stage and finally show a closed rotation centre with an eastward-oriented trough line in the Mature and Dissipation stages.
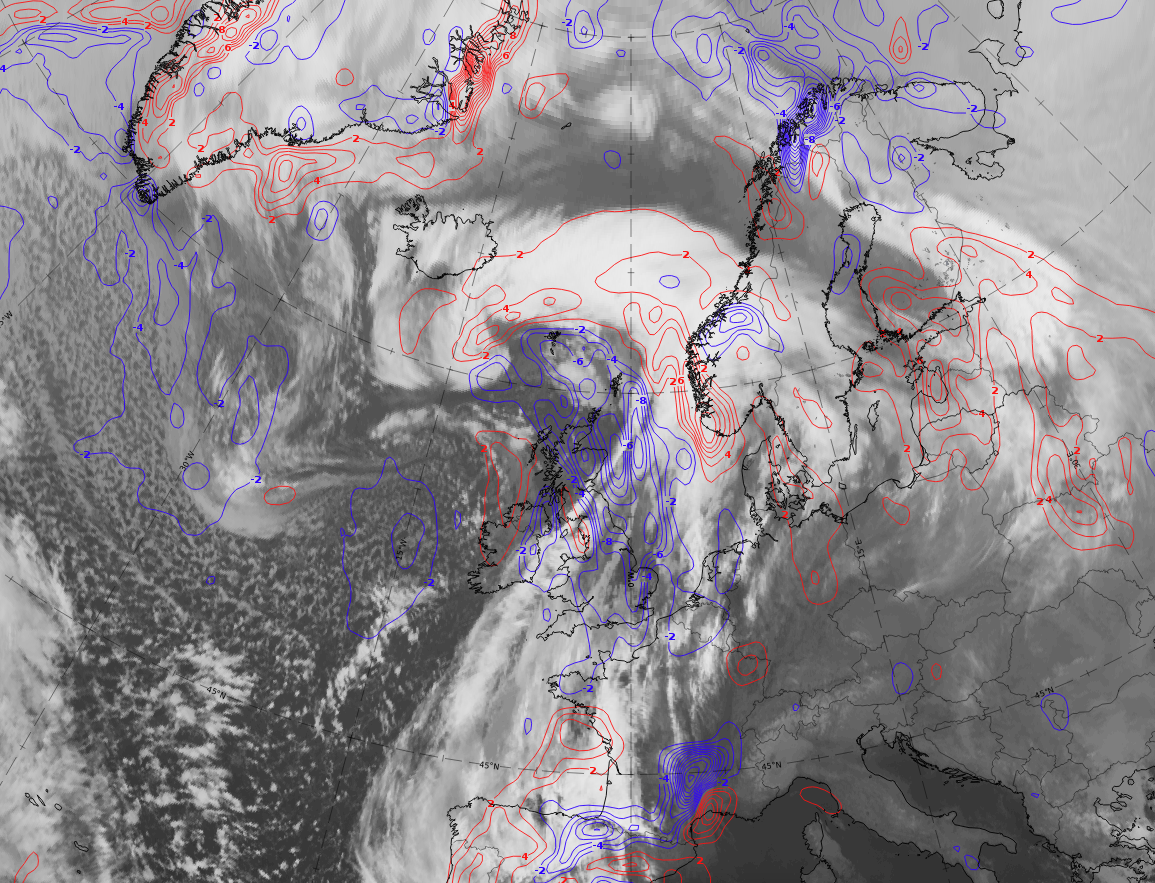
Thermal parameters
- Temperature at 850 hPa or 700 hPa
- In the Wave stage and the Intensification stage there are parallel temperature isolines within the cold front cloud band and the wave area, while to the rear a temperature minimum exists; this indicates the transition from warm air in front to cold air behind the frontal cloud system.
- Starting during the Intensification stage, the isolines form a ridge in the cloud bulge, which becomes more and more pronounced in the Mature stage and the Dissipation stage, when it accompanies the occlusion cloud spirals.
- The trough indicating the cold air at the rear, becomes involved in the cyclonic circulation of the low and protrudes into the low centre.
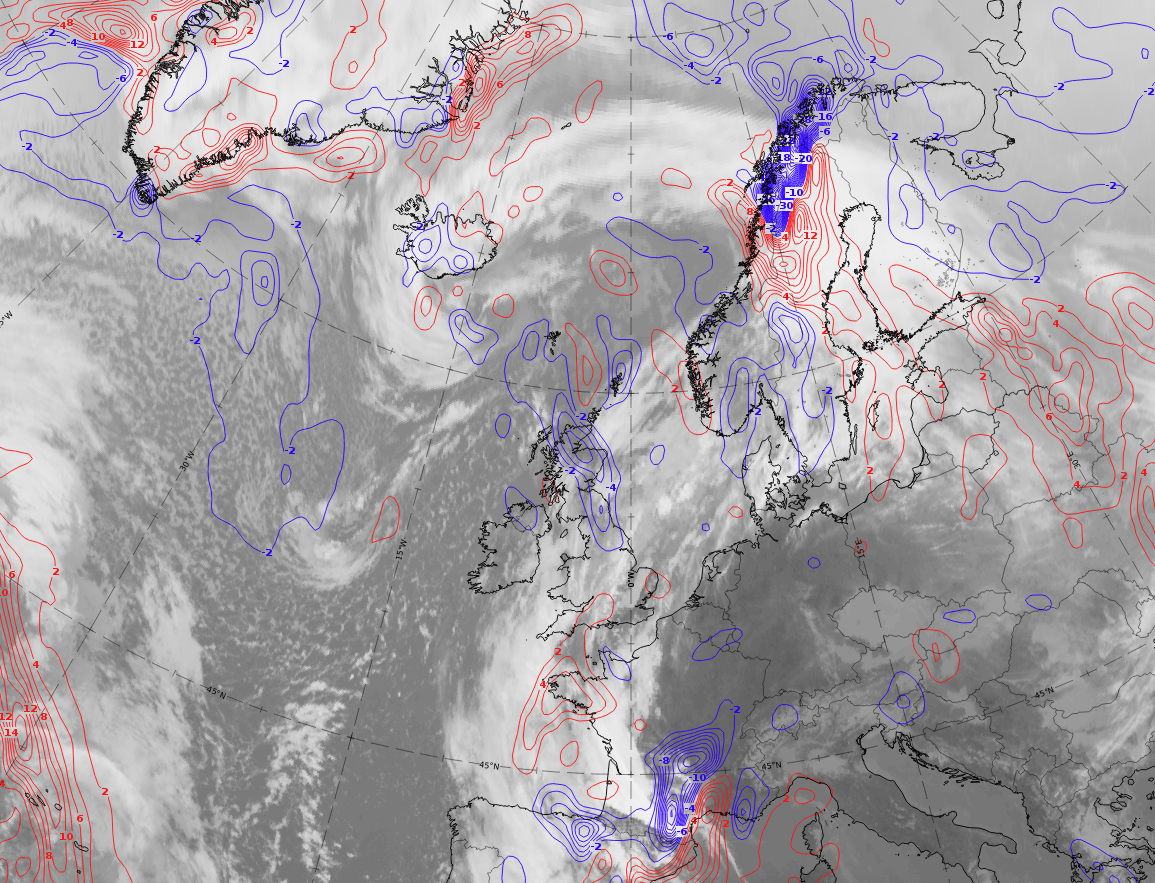
- Temperature Advection at 850 or 700 hPa
- The Wave stage is characterised by a juxtaposition of warm advection maxima within its associated cloud bulge and cold advection in the cold air immediately to the rear of the cloud bulge. This is a consequence of the cyclonic rotation in the low centre and increases in intensity and area during the Intensification stage.
- During the Mature stage, the warm and cold advection maxima intensify further. In the Dissipation stage, the occlusion cloud spiral is co-located with the warm advection maximum, while the cold advection maximum is located in the cloud free centre of the occlusion spiral.
- Thickness between 1000 and 500 hPa and Thermal Front Parameter
- For the Wave stage and Intensification stages, the thickness isolines show a distinct gradient of parallel lines at the rear of the cloud band, the wave bulge and further within the cloud of the warm front. This represents the transition from warm to cold air at the front. Further west, a thickness trough indicates the coldest air at the rear of the frontal system.
- During the stages with occlusion spirals, thickness lines form a ridge within the cloud spiral, indicating the lifted warn air; this is a typical cyclogenesis process according to the Polar Front Theory.
- The thermal front parameter (TFP) is defined as the maximum of the change of the temperature gradient or thickness gradient. This is located at the warm side of the zone of high temperature/thickness gradients, as well as in the centre of the thickness ridge in the occlusion spiral.(Basics - TFP)
Legend: Schematics of thermal parameters.
U.l.: temperature at 850 hPa; u.r.: temperature advection at 850 hPa; l.l: thickness between 500 and 1000 hPa (green) and TFP (blue).
Note: To enlarge the images, click on them.
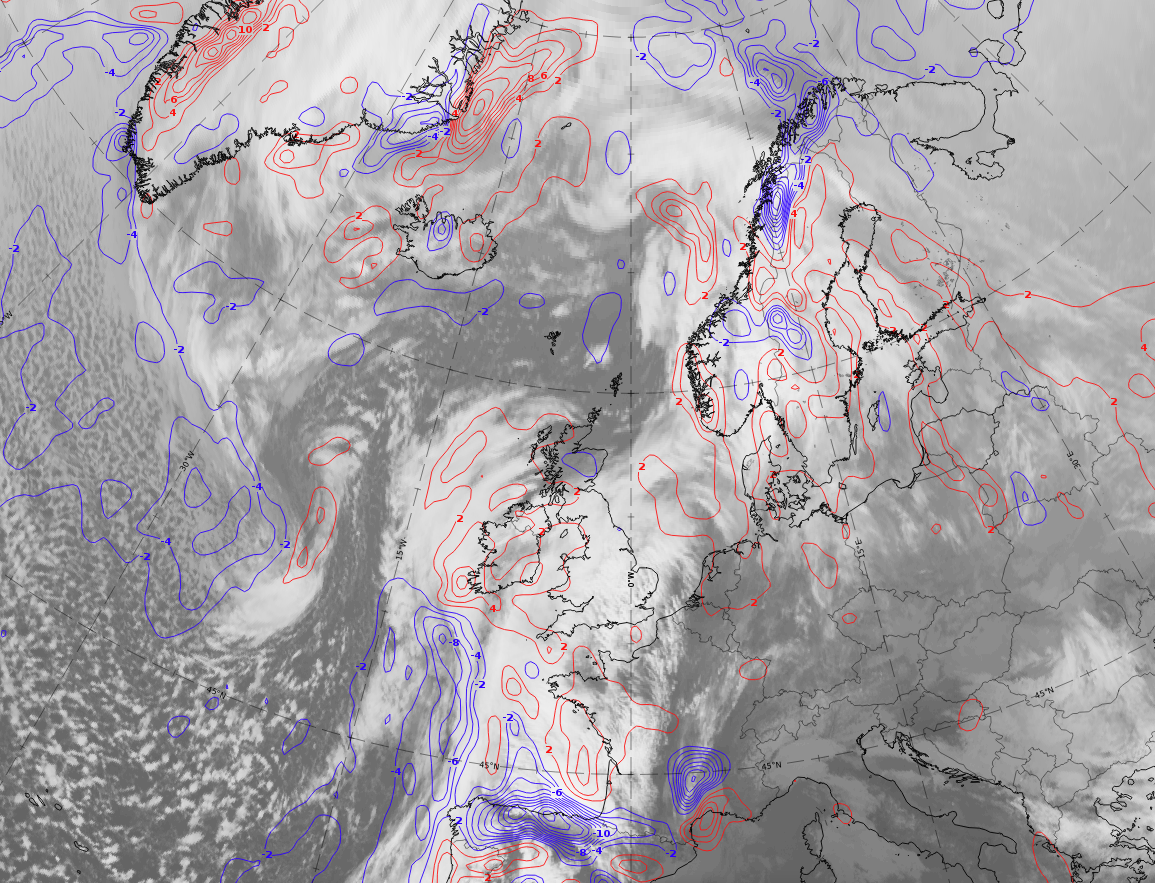
Legend: 20-21 February 2021, IR; temperature at 850 hPa.
U.l.: 9 UTC on 20 February 2021, Wave stage; u.r.: 12 UTC on 21 February 2021, Intensification stage; 00 UTC on 21 February 2021, Mature stage; 12 UTC on 21 February 2021, Dissipation stage.
Note: To enlarge the image, click on it.
Note: To access the gallery of individual images click here
The main characteristics of the 850-hPa temperature fields in this demonstration case are:
- The distinct separation between warm air within the frontal cloud bands (red and magenta colours) and cold air (blue colour) as well as the frontal zone with high gradients.
- The growing bulge of warm air accompanying all stages from the Wave stage to the Mature stage.
- The loss of distinct structures in the Dissipation stage.
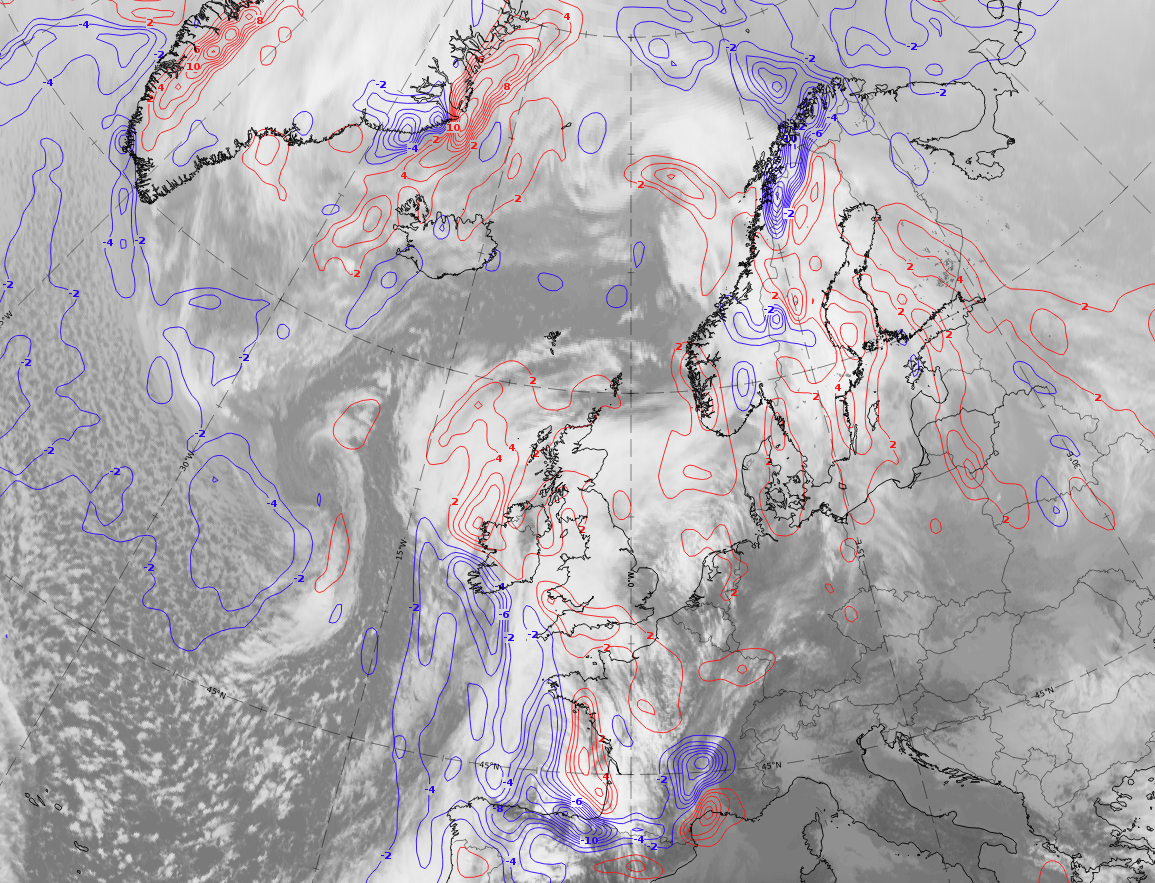
Legend: 20-21 February 2021, IR; temperature advection at 850 hPa.
U.l.: 9 UTC on 20 February 2021, Wave stage; u.r.: 12 UTC on 21 February 2021, Intensification stage; 00 UTC on 21 February 2021, Mature stage; 12 UTC on 21 February 2021, Dissipation stage.
Note: To enlarge the image, click on it.
Note: To access the gallery of individual images click here
The main characteristics of the parameter temperature advection in this demonstration case are:
- The growing bulge of warm advection accompanying the occlusion spiral, which can be seen in this case from the Wave stage to the Mature stage.
- A cold advection maximum in the centre of the cloud spiral.
- In the Dissipation stage, the temperature advection maxima become weaker and less distinct.
Legend: 20-21 February 2021, IR; 500-1000 hPa thickness (green); TFP (blue).
U.l.: 9 UTC on 20 February 2021, Wave stage; u.r.: 12 UTC on 21 February 2021, Intensification stage; 00 UTC on 21 February 2021, Mature stage; 12 UTC on 21 February 2021, Dissipation stage.
Note: To enlarge the image, click on it.
Note: To access the gallery of individual images click here
The main characteristics of the parameters thickness and TFP in this demonstration case are:
- The growth of the thickness bulge in the area of the cloud bulge and the occlusion spiral from the Wave stage to the Mature stage. This corresponds to the 850-hPa temperature, which shows the same behaviour at lower levels only.
- The formation of a distinct frontal pattern, of a cold front, a warm front and an occlusion front, in the TFP.
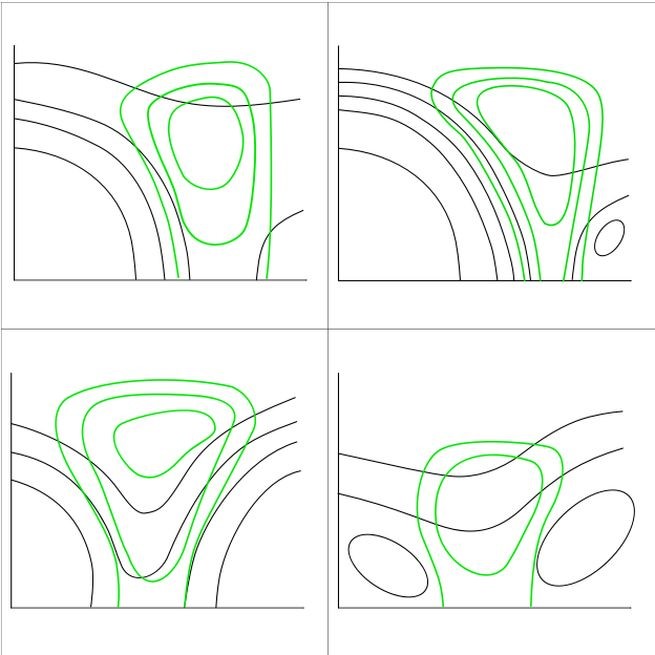
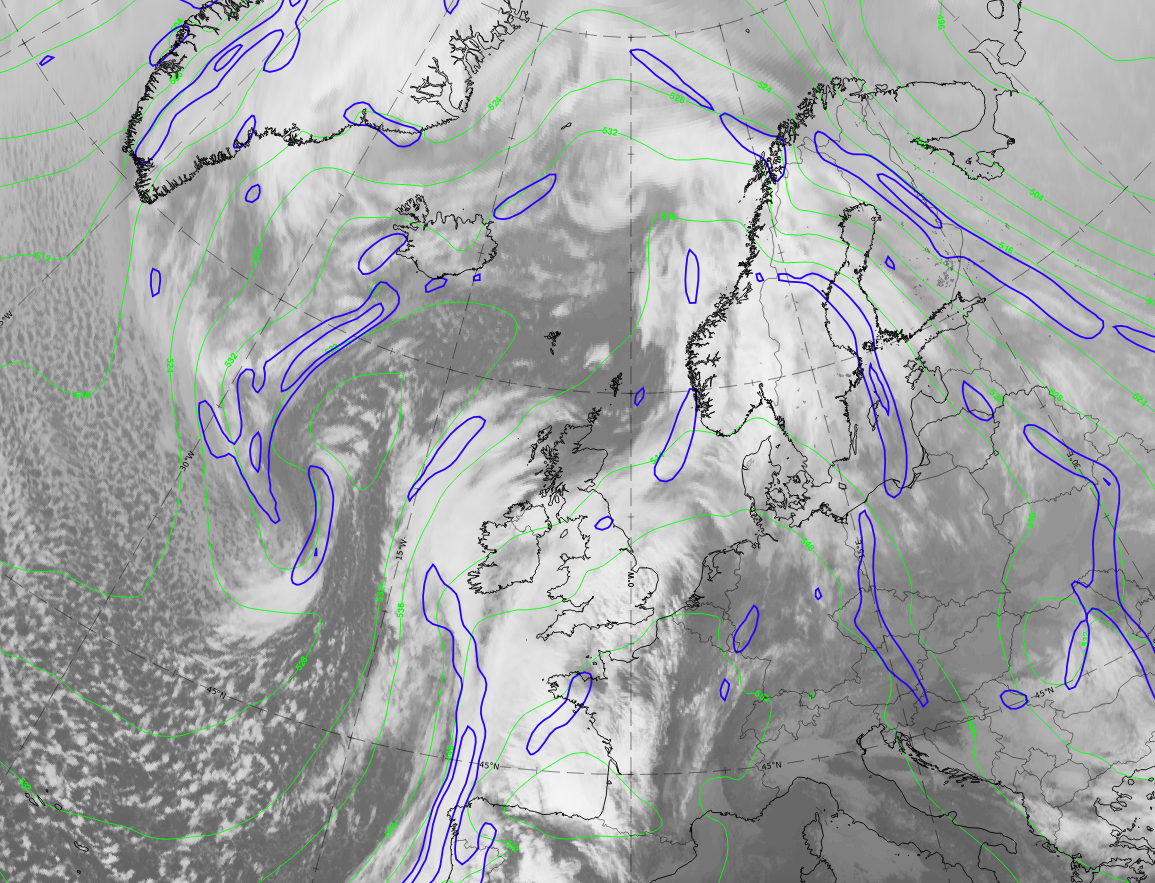
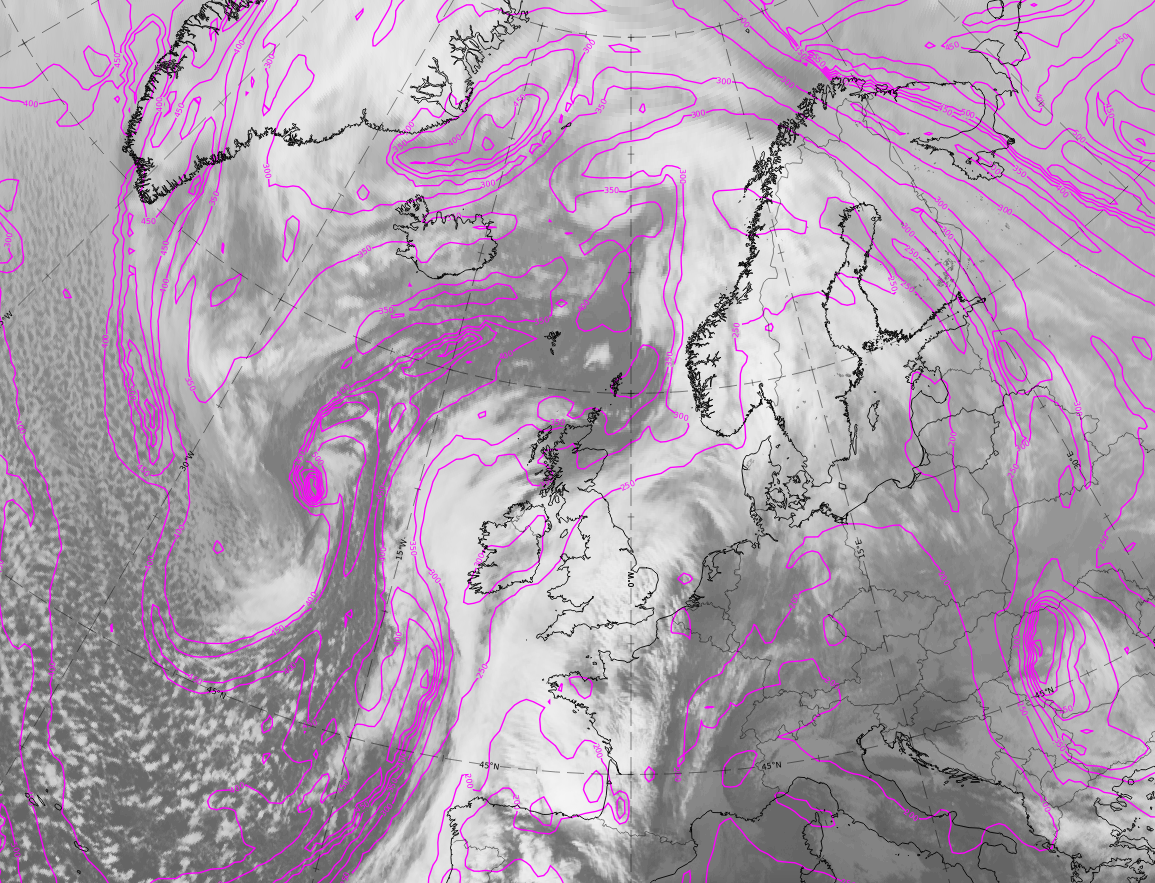
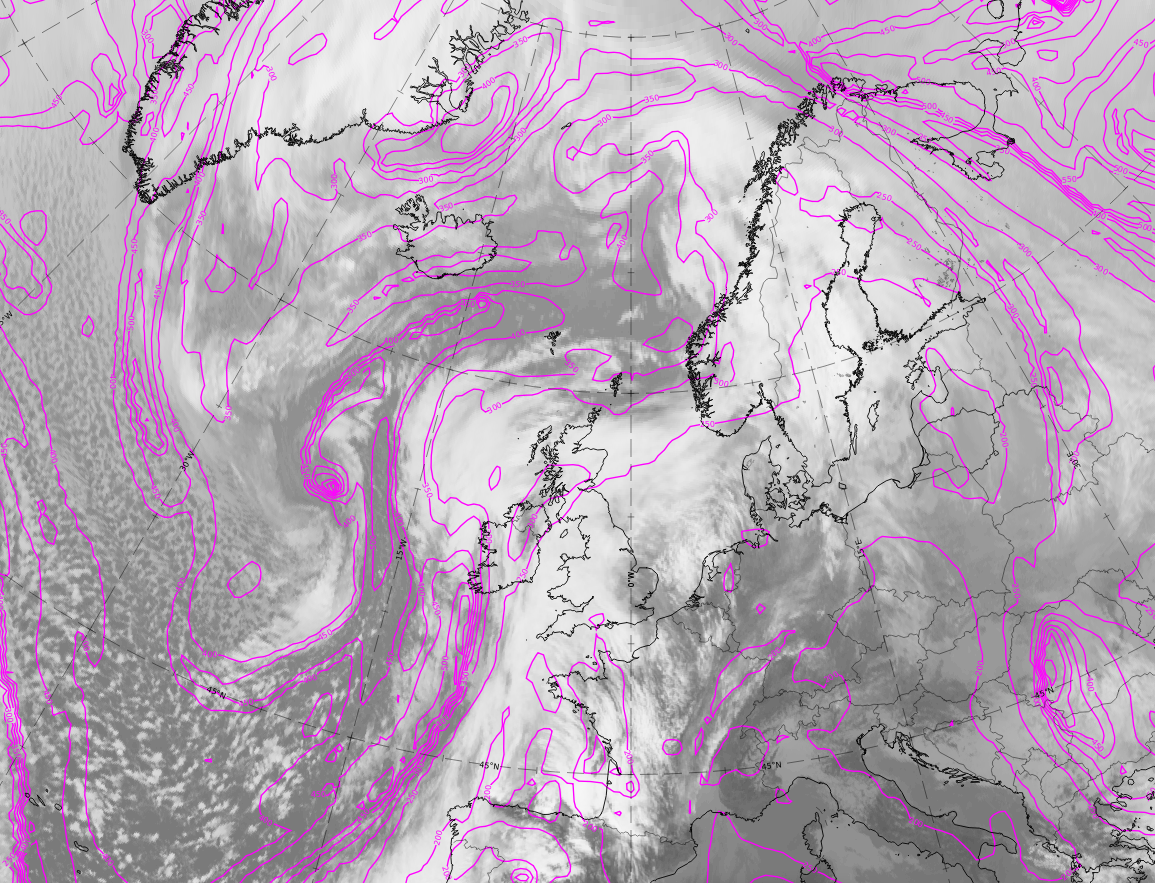
Upper-Level Parameters
- Wind speed (isotachs) - Jet streak
- There is usually a jet streak along the rear side of the cold front cloud, bending from north-west to south-west and further to north-east where it ends usually close to the wave bulge.
- In the Mature stage and the Dissipation stage, the exit region of the jet streak can be found along the inner boundary of the occlusion spiral in the centre of the low.
- In the Mature stage and the Dissipation stage, very often a second jet streak develops at the north-eastern boundary of the occlusion spiral, at the leading edge of the warm front cloud.
- Cyclonic Vorticity Advection (CVA)
- Maxima of CVA accompany the jet streak on the cyclonic side; they are the result of both, curvature and shear vorticity. In the Mature stage and the Dissipation stage, usually the CVA maximum widens and intensifies in the left exit region of the jet streak, which is mostly in the cloud-free centre of the low; but it can also extend a bit into the cloud band.
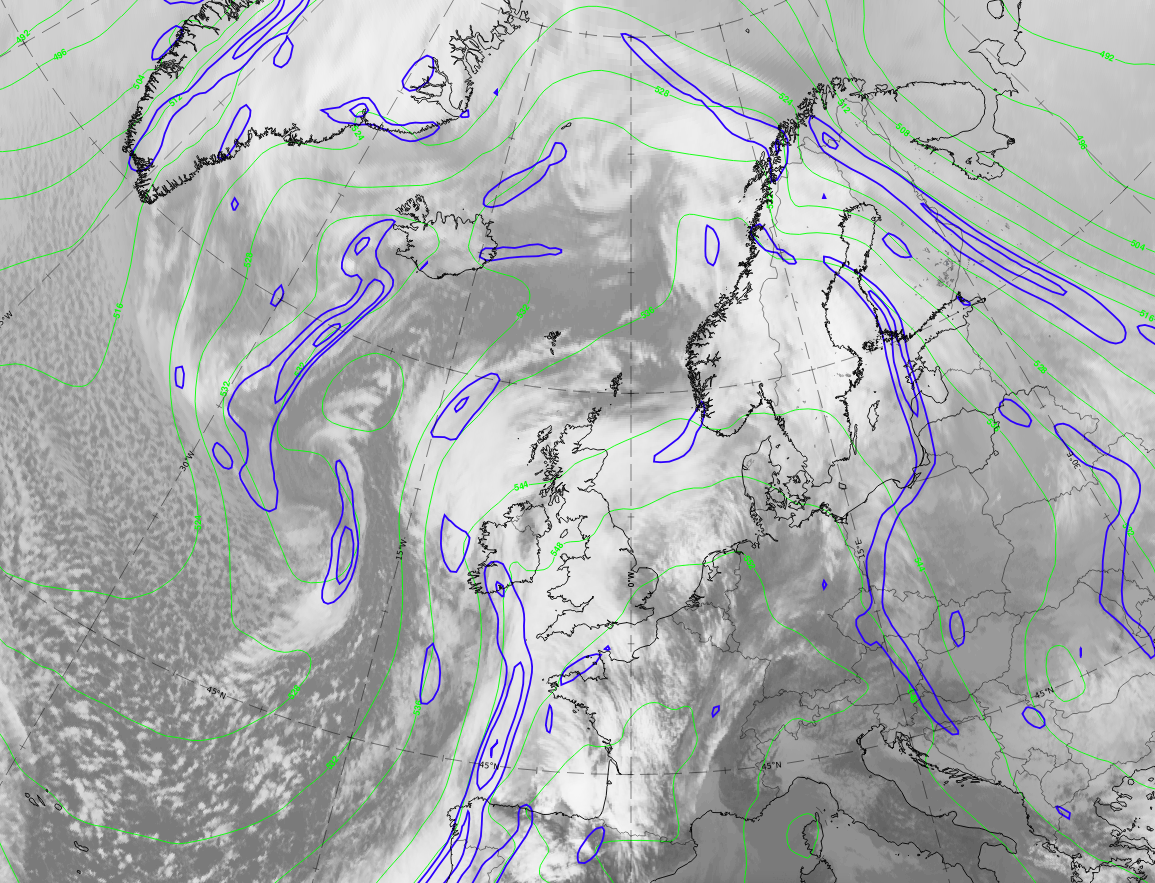
- Potential Vorticity (PV): Height at which PV >= 1.5 units (PVU).
- As frontogenesis is connected with a tropopause folding, stratospheric air protrudes downward below the cold front. This is reflected in a high gradient of PV >= 1.5 PVU height along the cold front and a developing wave bulge separating high values (high tropopause) within the cloud systems from low values (stratospheric air) behind. These areas of stratospheric air can be found close to and at the rear of the wave bulge. The 1.5 PVU heights can be as low as approximately 500 hPa.
- During the Mature stage and the Dissipation stage, a centre of closed isolines can be found in the centre of the cloud spiral, representing sharply increasing values, which means that a tunnel of PV from the tropopause to very low altitudes has developed. This is a consequence of the mutual intensification of vorticity rotation as the stratospheric air protrudes downward. (Meteorological-physical background).
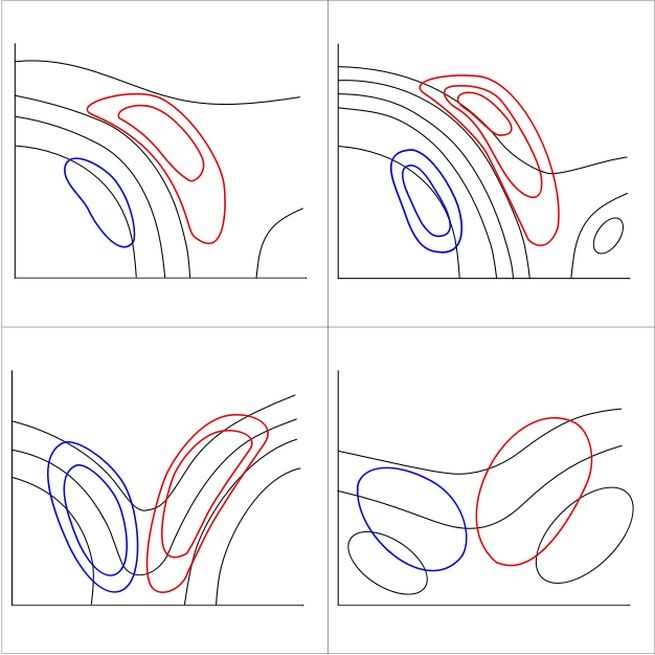
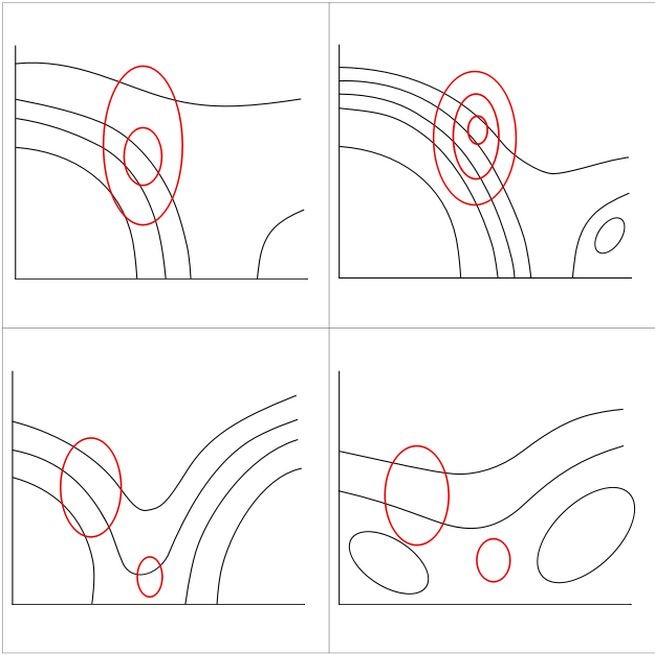
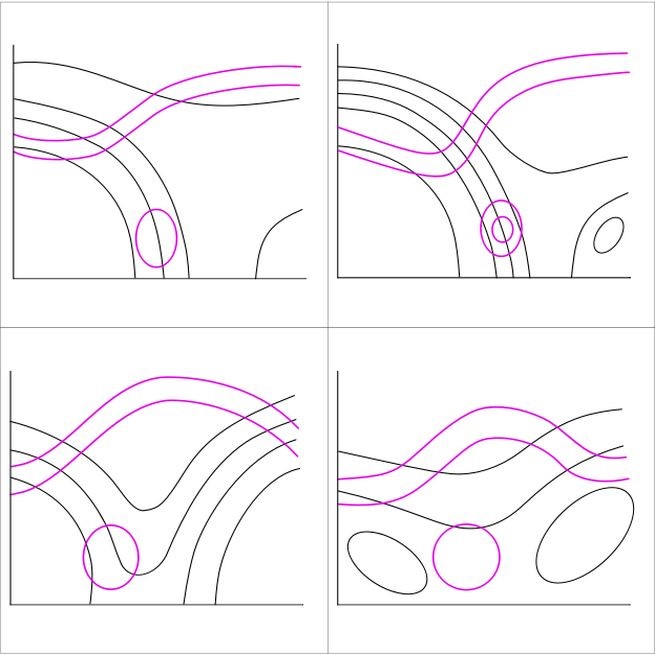
Legend:
Schematics of upper-level parameters.
U.l.: isotachs at 500 hPa (yellow), maxima cyclonic vorticity at 500 hPa (red); r.: contours of 1.5 PVU heights (magenta).
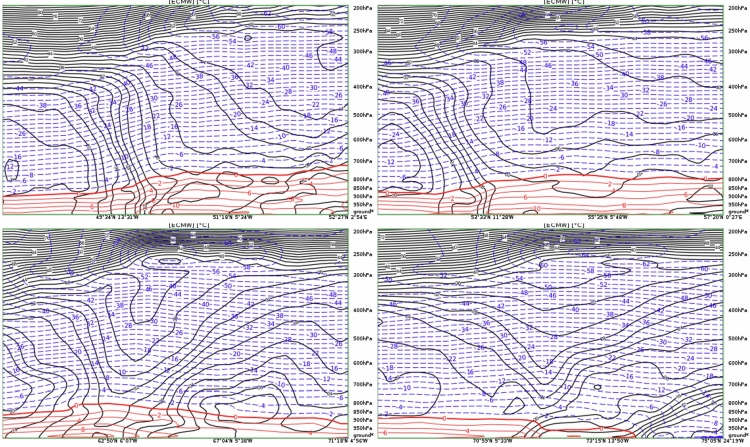
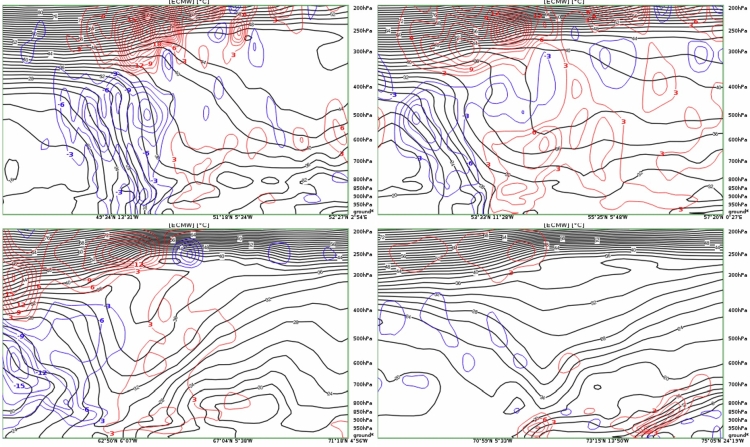
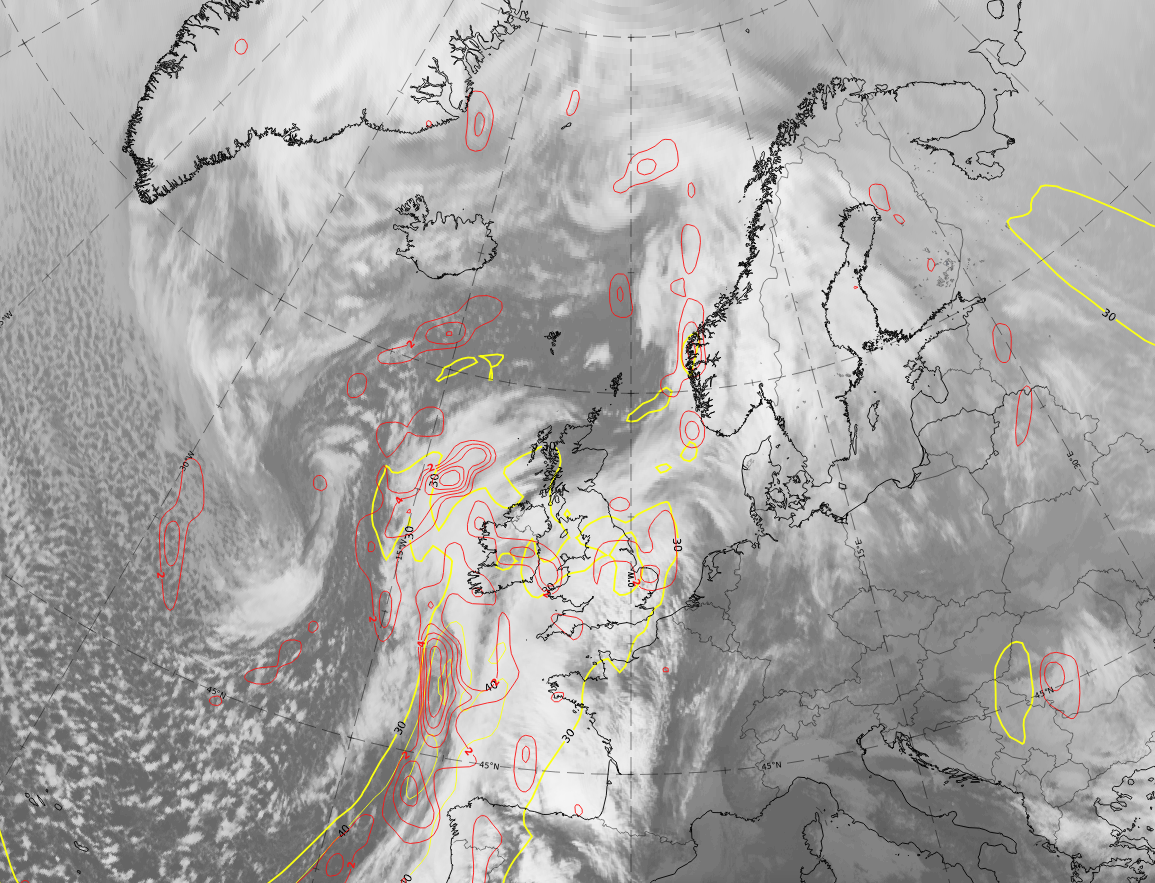
Legend: 20-21 February 2021, IR; isotachs at 500 hPa (yellow); CVA maxima at 500 hPa (red).
U.l.: 9 UTC on 20 February 2021, Wave stage; u.r.: 12 UTC on 21 February 2021, Intensification stage; 00 UTC on 21 February 2021, Mature stage; 12 UTC on 21 February 2021, Dissipation stage.
Note: To enlarge the image, click on it.
Note: To access the gallery of individual images click here
The isotachs in yellow show the typical jet streak along the rearward edge of the cold front cloud band, in this case with a double structure, which is a consequence of the history of the case: the merging of two frontal systems. Less well pronounced in this case, is the jet streak at the leading edge of the warm front.
The cyclonic vorticity isoline field is in most real cases much more structured, as presented in the schematic. This is because also small structures within the height fields appear much more clearly in the derived field of vorticity (curvature- and shear vorticity) and its related vorticity advection. In this demonstration case, a band of strong cyclonic vorticity advection accompanies the jet streak centre. This can be seen very clearly in the Wave stage and the Intensification stages along the rear edge of the cold front cloud. The maximum in the left exit region is the most significant meteorological feature in the CVA field, and is the result of curvature and shear in the jet streak exit region. Such an intense CVA maximum occurs in this case in the exit region moving from south-west of Ireland across Ireland and Scotland into the Norwegian Sea and over southern Norway.
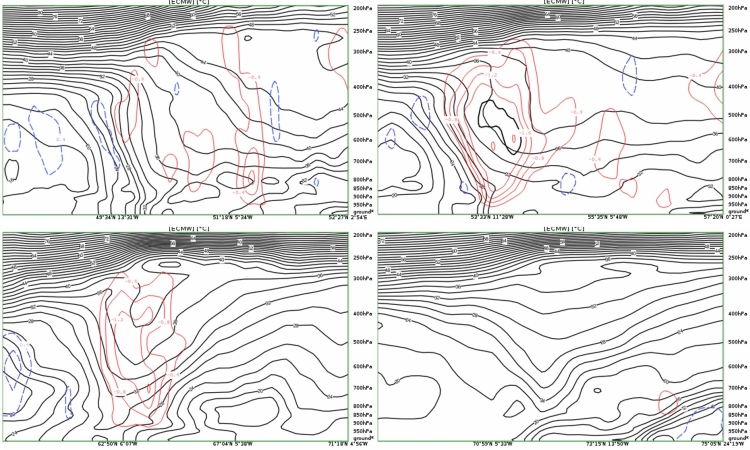
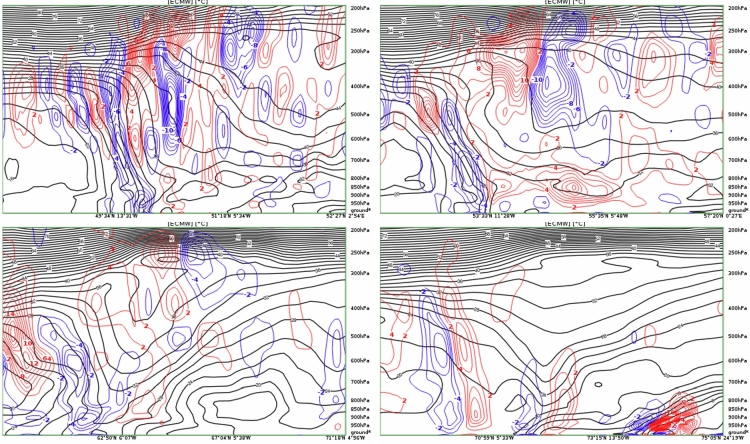
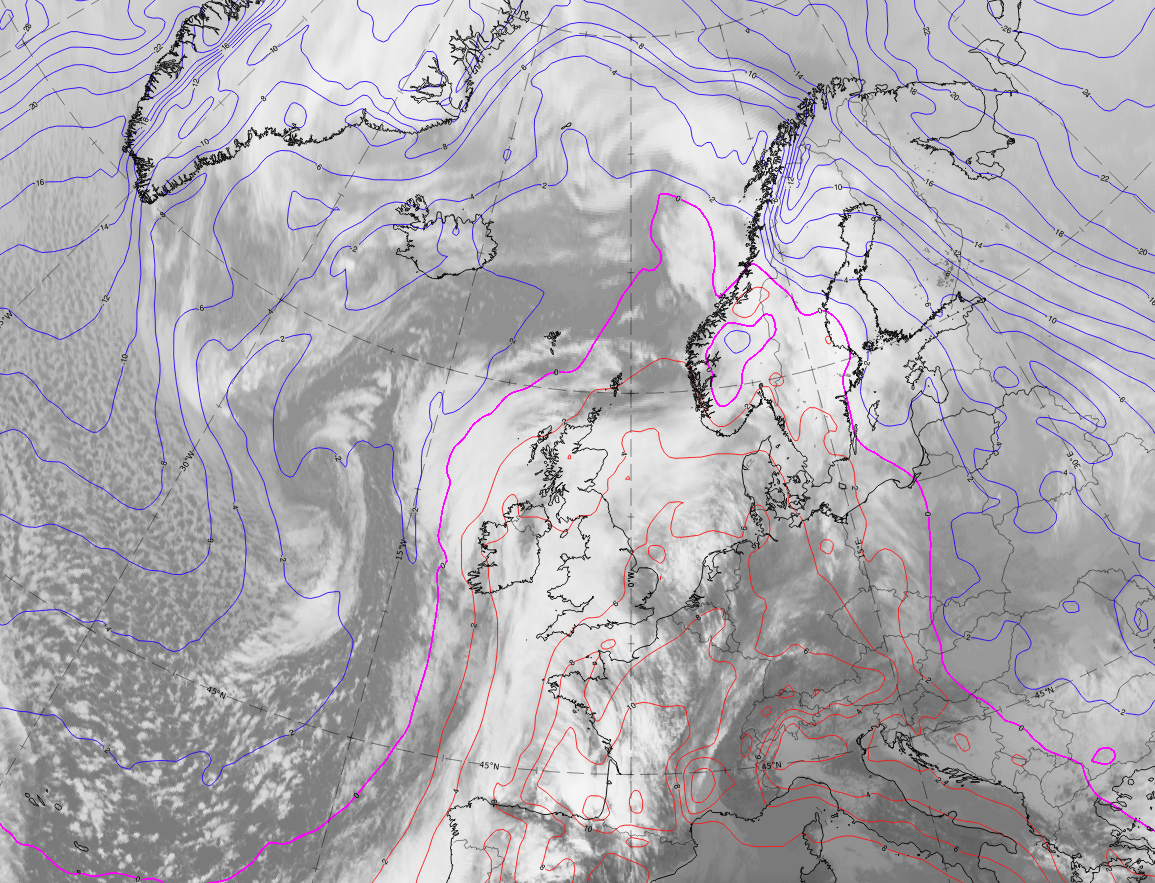
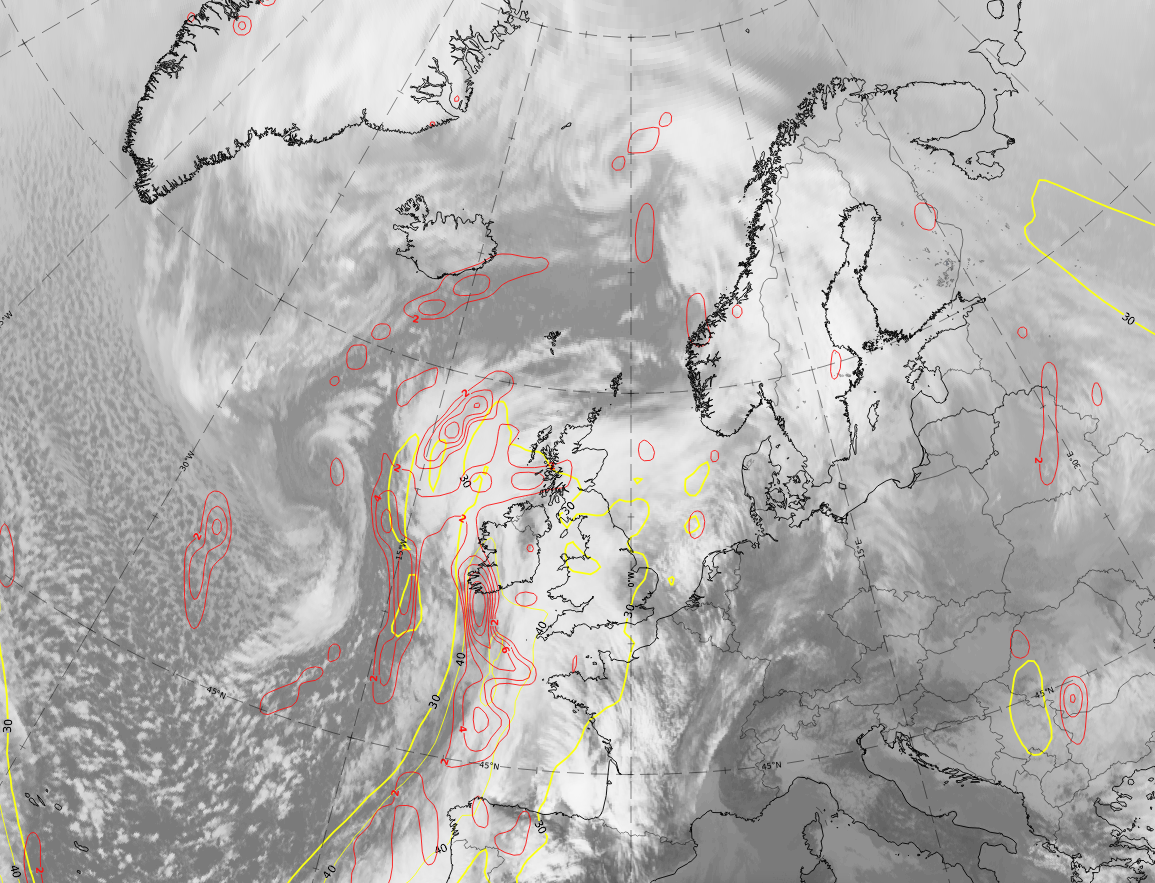
Legend: 20-21 February 2021, IR; height at which PV is >=1.5 PVU.
U.l.: 9 UTC on 20 February 2021, Wave stage; u.r.: 12 UTC on 21 February 2021, Intensification stage; 00 UTC on 21 February 2021, Mature stage; 12 UTC on 21 February 2021, Dissipation stage.
Note: To enlarge the image, click on it.
Note: To access the gallery of individual images click here
The main characteristics of PV >= 1.5 PVU height in this demonstration case are:
- In all four stages the difference between the high values of tropopause (where PV = 1,5 PV units) in the cloud bands and the low tropopause in the cold air behind is very clear.
- The boundary between the two systems is at a height of about 250 hPa.
- In the Wave stage and the Intensification stage, stratospheric extends down to a height of 500-550 hPa.
- In the Mature stage, there are small areas in the spiral centre where a tube of stratospheric air extending from upper levels down to 800 hPa has developed. This is usually formed by a combination of the sinking stratospheric air and intensification of rotation in the low layer.
- In the Dissipation stage, the lowest height reached by stratospheric air is 600 hPa.
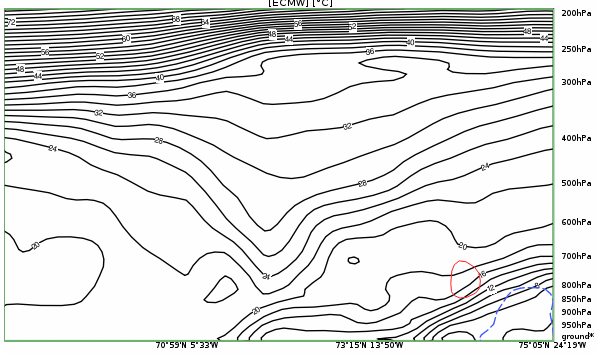
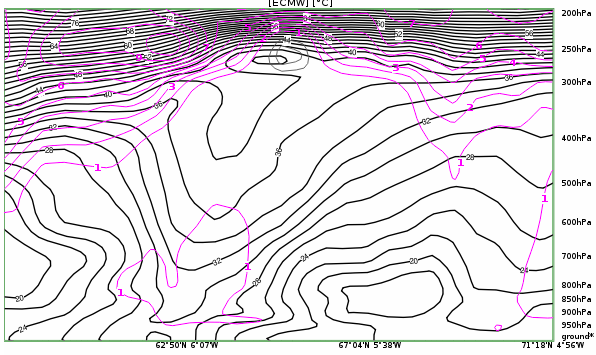
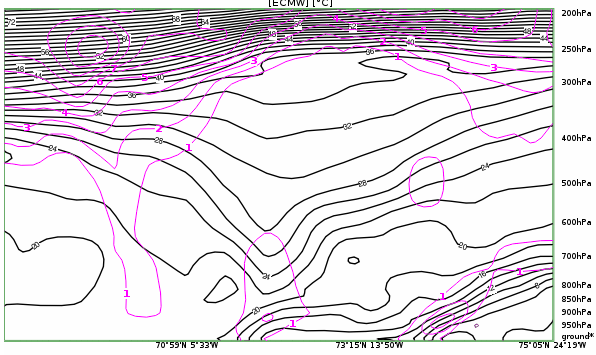
Typical Appearance In Vertical Cross Sections
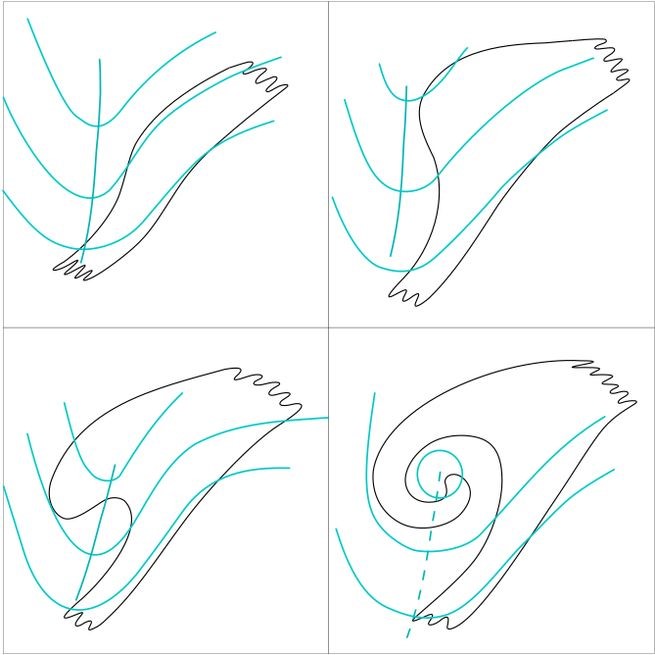
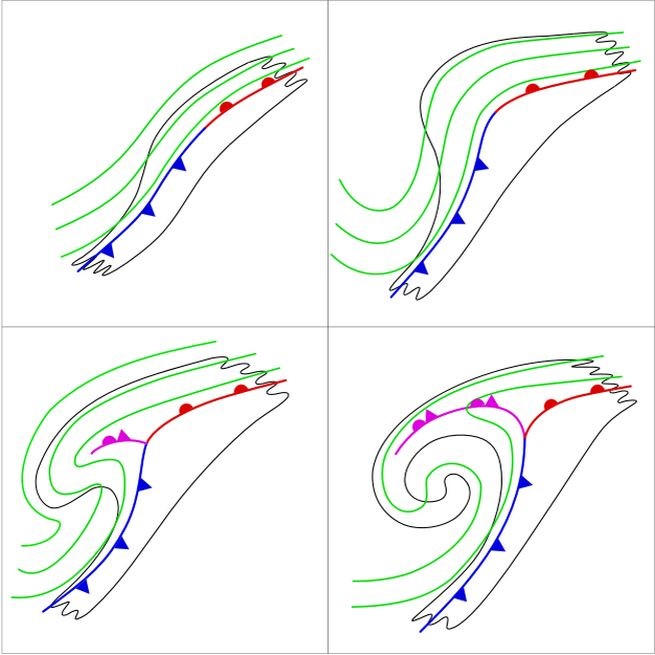
Vertical cross sections provide a very interesting insight into the processes over the whole troposphere. To investigate cyclogenesis, they are most usefully located across the cloud bands and oriented in direction of the movement of the cloud systems. The schematic below shows the general relationship between cloud bands and the vertical cross section (VCS) line in the four development stages of Polar-Front-type cyclogenesis.
The four development stages in cyclogenesis of the Polar-Front type are:
- Wave stage
- Intensification stage
- Mature stage
- Dissipation stage
The main characteristics of the key parameters in VCSs, and their changes, during these four development stages are described here. More details are described in the relevant individual CMs.
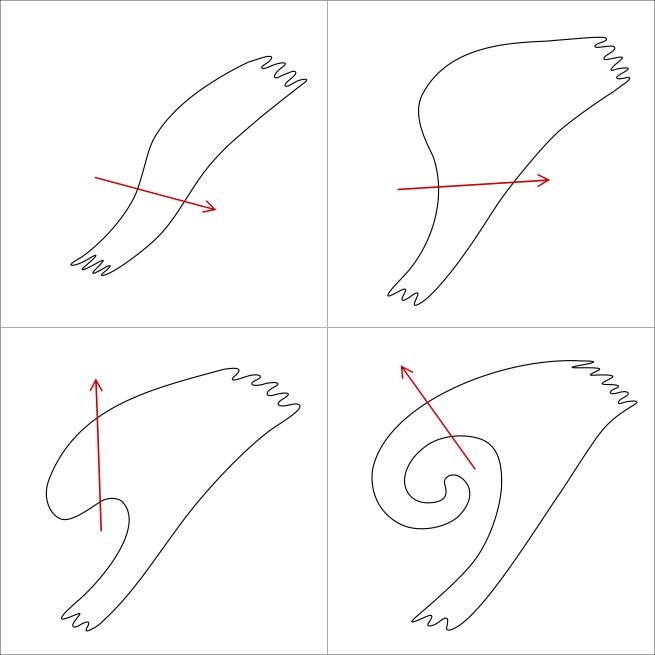
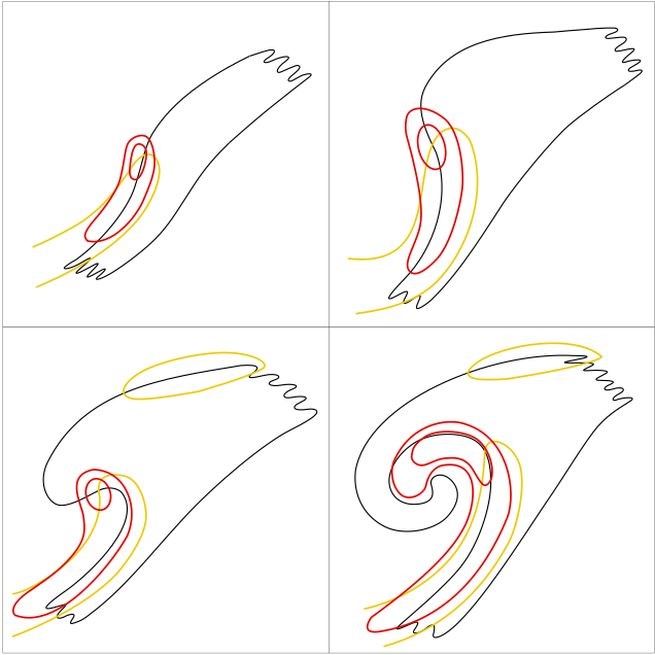
Legend: Schematics of cloud configurations and typical locations of the vertical cross section line.
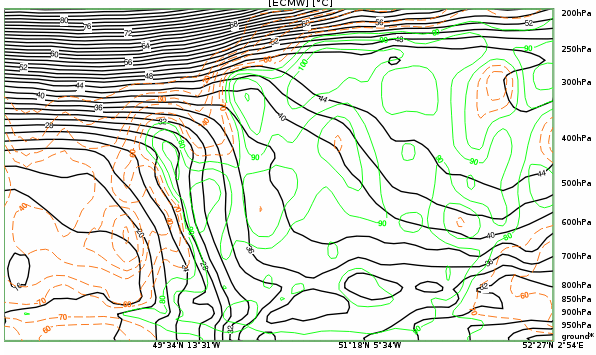
To demonstrate the schematically "ideal" vertical cross sections, the same case is used as in previous chapters, from 20 to 22 February 2021. However, to best illustrate the Dissipation stage, a later time is chosen to represent this.
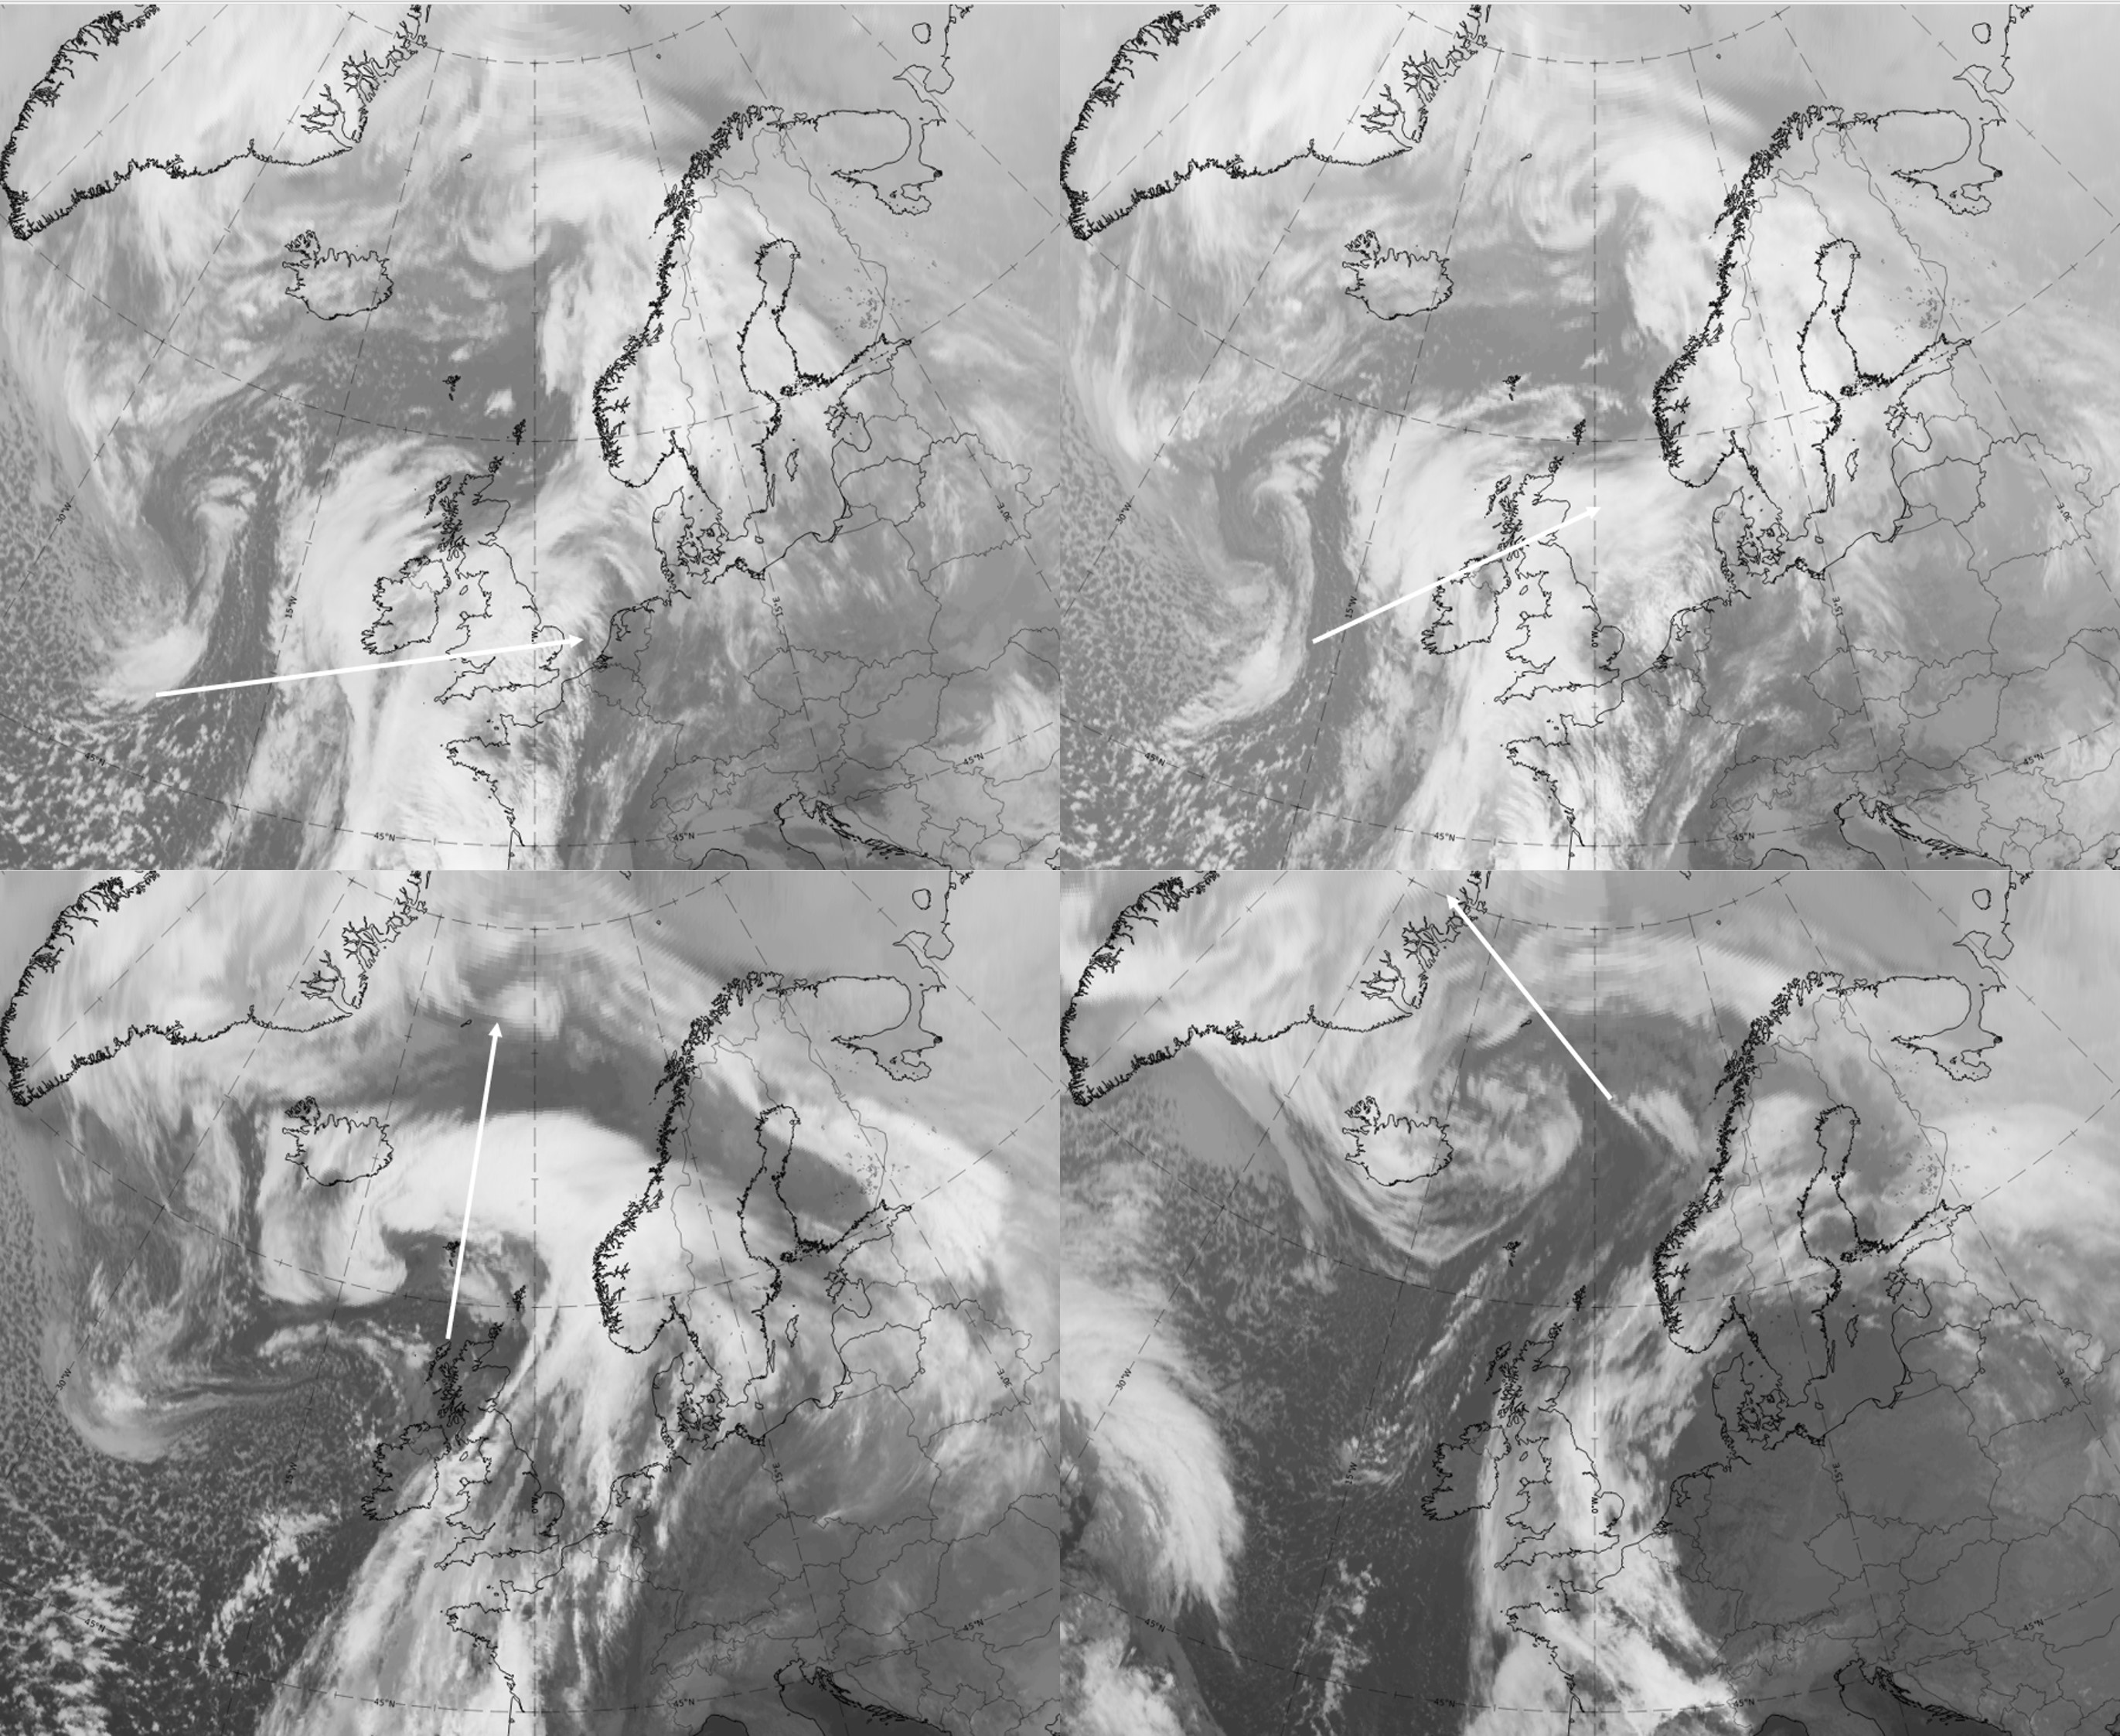
Legend: 20-22 February 2021, IR.
U.l.: 9 UTC on 20 February 2021, Wave stage; u.r.: 12 UTC on 20 February 2021, Intensification stage; 00 UTC on 21 February 2021, Mature stage; 00 UTC on 22 February 2021, Dissipation stage.
Note: To enlarge the image, click on it.
Idealised configurations of key parameters in vertical cross sections
- Equivalent potential temperature, ThetaE: (Humid) isentropes
- In the Wave stage, the vertical cross section shows the typical appearance of a cold front: a dense region of downward inclined isentropes with unstable cold air below the frontal surface. Often, there is also some unstable air also ahead of the frontal surface and a distinct upper-level cold front ahead of the main cold front surface.
- In the Intensification stage, the main structures are very similar but the gradient is increasing.
- In the two stages with occlusion cloud spirals, the Mature stage and the Dissipation stage, the main feature is a distinct trough in the isentropes, which indicates warm air aloft. The boundaries between two airmasses at the front and at the rear of the occlusion band can be recognised by the frontal gradients.
- In the early part of the Dissipation stage, the isentropic trough and the frontal surfaces at the boundary are mostly still fully formed, whereas later in this stage the configurations dissipate.
- Relative humidity
- In all four development stages, high values of relative humidity indicate the thick cloudiness of the cloud bands. In the Wave stage and the Intensification stage, the area of high humidity is bent back on the frontal surfaces. In most cases, the upper-level cold front is also accompanied by high values of relative humidity.
- Very high relative humidity is also present in the two stages with occlusion cloud spirals, indicating a thick cloud band. It fills the area of the isentropic trough completely and is also upward inclined above the frontal boundaries. Later, in the Dissipation stage, clouds within relatively humid areas can become narrower and lower as they dissipate.
- Vertical motion (Omega)
- Cloud bands and spirals are accompanied by strong upward motion. This is especially so in the stages with occlusion spirals.
- In the Dissipation stage, in the beginning strong upward motion still exists, but becomes weaker and weaker towards the end of this stage.
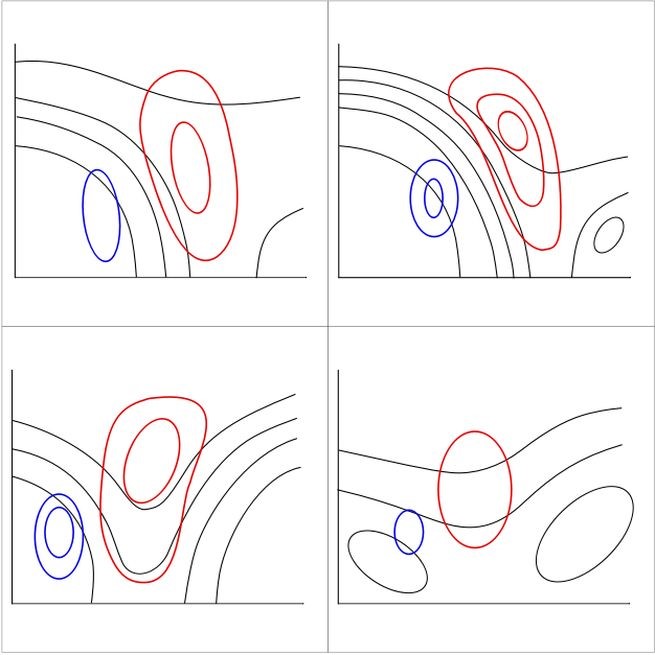
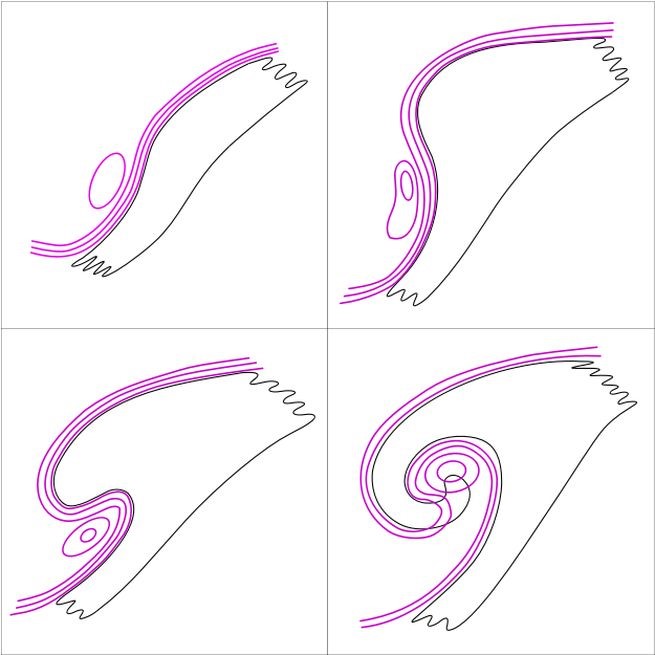
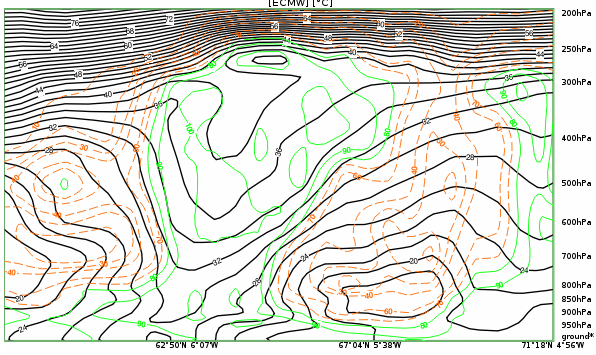
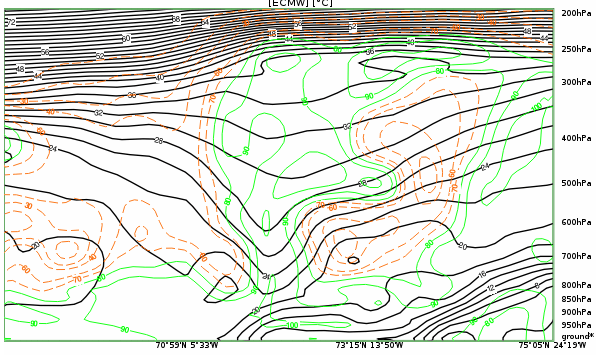
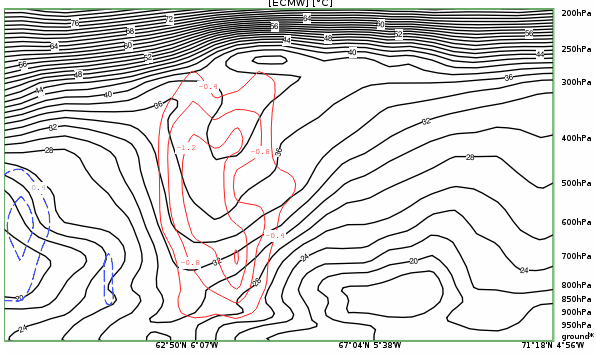
Legend: Schematics of ThetaE, relative humidity and omega for the four stages of development.
U.l.:(humid) isentropes (black); u.r.: relative humidity (green); l.l.: Omega (upward in red an downward in blue).
Note: To enlarge the images, click on them.
|
|
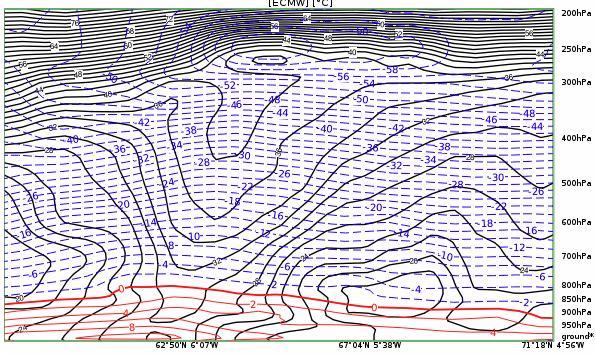
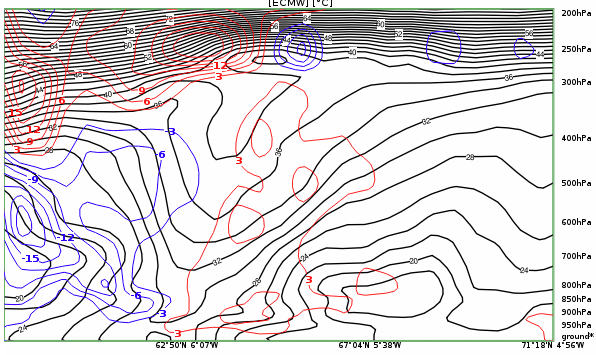
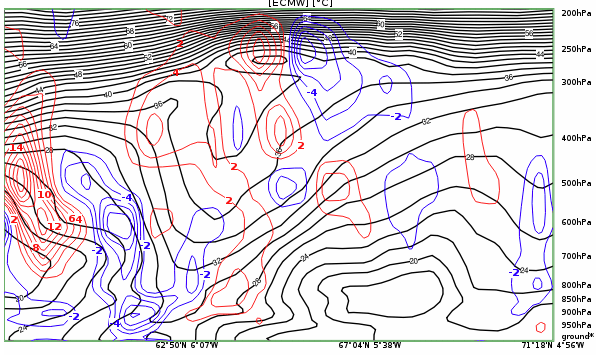
Legend: 20-22 February 2021, Vertical cross sections. IR.; u.: isentropes (black), relative humidity (green); l.: upward motion (red), downward motion (blue).
U.l.: 9 UTC on 20 February 2021, Wave stage; u.r.: 12 UTC on 20 February 2021, Intensification stage; 00 UTC on 21 February 2021, Mature stage; 00 UTC on 22 February 2021, Dissipation stage.
Note: To access the gallery of individual images click here
Typical features of equivalent potential temperature, relative humidity and vertical motion and their changes observed in the show case are:
- The Wave and Intensification stages show the typical downward inclined zone of high gradients in the isentropes; the rather broad frontal zone in the Wave stage (representing, as discussed in the previous chapter, two systems) becomes narrower with a sharper gradient in the Intensification stage.
- Upward motion increases strongly from the Wave stage to the Intensification stage.
- The Mature stage, with a well-developed occlusion band, shows a distinct isentropic trough indicating the lifted warm air, while this isentropic trough becomes much smaller and narrower in the Dissipation stage.
- The same is true for upward motion, which is very strong in the Mature stage and very weak in the Dissipation stage.
- While relative humidity is high in the cloud bands during all stages, the dry air typical of the cold region behind the front is represented by low values of relative humidity.
- Temperature
- The most recognisable feature in the isotherms is a distinct rise across the frontal surface, typical for a cold front, in both the Wave stage and the Intensification stage. Often there is a second smaller rise at the upper-level frontal surface ahead of the main front.
- During the stages with occlusion spirals, isotherms follow a ridge within the centre of the occlusion and correspondingly rise and fall at the boundaries. This signals the warm lifted air.
- Temperature advection
- In the Wave stage and the Intensification stage, the distribution of temperature advection is typical for cold fronts: warm advection in the rising air above the frontal surface and cold advection in the sinking air below the frontal surface.
- In the stages with occlusion spirals, the typical process of rising warm air is represented by the area of warm advection in the cloud spiral and cold advection in the south-eastern part of the cloud spiral, where the cold air from the rear is advected into the centre of the spiral.
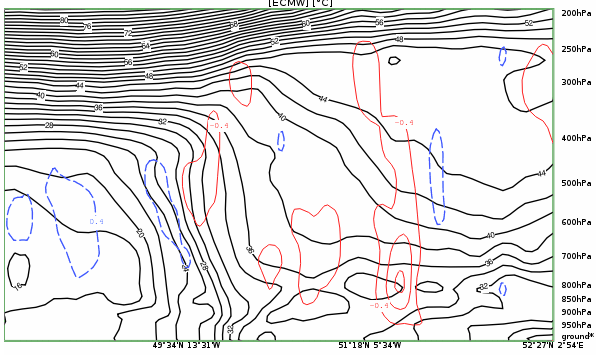
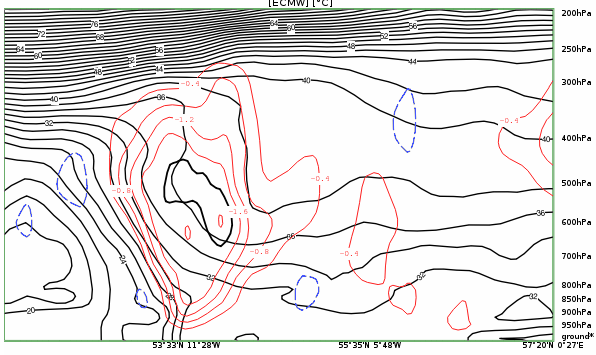
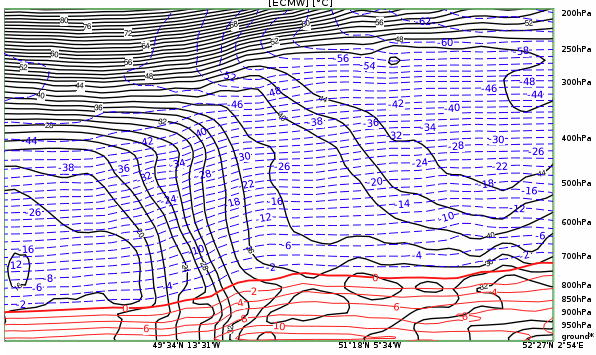
Legend: Schematics of temperature and temperature advection for the four stages of development.
L.: (humid) isentropes (black), temperature at 850 hPa (blue); r.: (humid) isentropes (black), temperature advection at 850 hPa (warm advection in red, cold advection in blue).
Note: To enlarge the images, click on them.
|
|
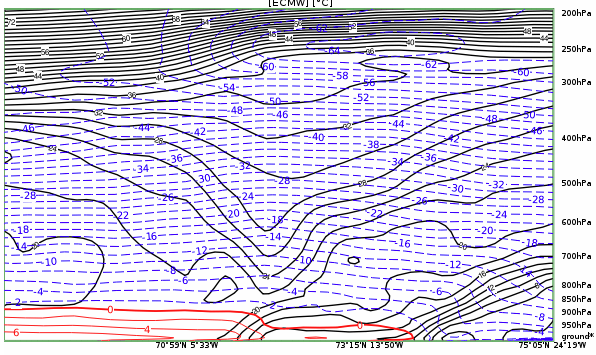
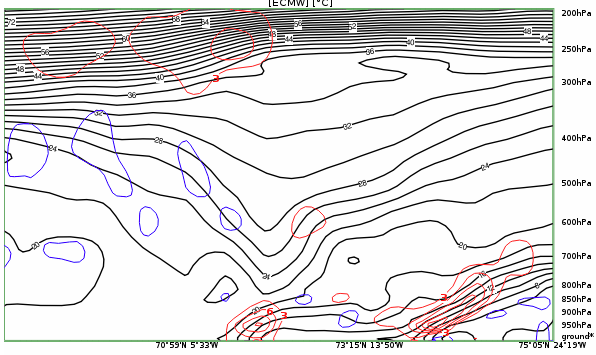
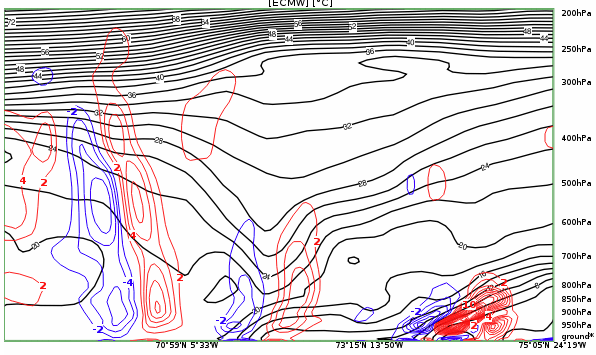
Legend: 20-22 February 2021, Vertical cross sections. IR; u.: isentropes (black), blue: temperature at 850 hPa (blue); l.: temperature advection at 850hPa (warm advection in red, cold advection in blue).
U.l.: 9 UTC on 20 February 2021, Wave stage; u.r.: 12 UTC on 20 February 2021, Intensification stage; 00 UTC on 21 February 2021, Mature stage; 00 UTC on 22 February 2021, Dissipation stage.
Note: To access the gallery of individual images click here
Typical features of temperature and temperature advection fields in VCSs demonstrated by the case from 20 to 22 February 2021 are:
- Isotherms rise across the frontal zone in the Wave and Intensification stages.
- A temperature ridge occurs in the Mature and Dissipation stages.
- There is very strong cold advection below the frontal surfaces in the Wave and Intensification stages, as well as an intensification of warm advection in the Intensification stage.
- In the Mature stage, warm advection can be found in the area of the occlusion cloud band, and cold advection in the low centre in the cloud-free part of the spiral.
- From the Mature stage to the Dissipation stage, both warm and cold advection significantly decrease, demonstrating that the occlusion development has come to an end and dissipation has started.
- Wind speed (isotachs) and vorticity advection
- Maxima of cyclonic vorticity advection (CVA maxima) at high levels are connected to shear vorticity (in the jet streak) and curvature vorticity (in the upper-level trough). Large numbers of case studies have shown that looking at the distribution of CVA maxima in a VCS can be very confusing and it changes from case to case. CVA maxima accompany every small-scale cyclonic vorticity variation, and are not always of central synoptic importance.
- There is, however, a most common location for a CVA maximum at high levels:
In the Wave and Intensification stages this is the rear side of the frontal zone and in the Mature and Dissipation stages it is the inner side of the occlusion spiral. - In well-developed occlusion systems, a CVA maximum very often also appears at low levels. It is weaker than that in upper levels and it indicates a deepening and moving surface low.
- Potential vorticity
- The Wave stage and the Intensification stage are characterised by two main features: the tropopause folding at the frontal surface, with a protrusion of stratospheric air downward below the frontal surface into the troposphere, and the intensification of potential vorticity in lower layers by a mutual strengthening of the vorticity rotation.
- By the Intensification stage, a tube (tunnel) of PV has often developed.
- In the stages with occlusion cloud spirals, the Mature and the Dissipation stages, the main features are: low tropopause heights at the boundaries of the occlusion cloud spiral, a high tropopause within the occlusion cloud spiral bands, and very often an area of increased PV at lower layers close to the inner boundary (increased PV values in the lower part of the PV tunnel).
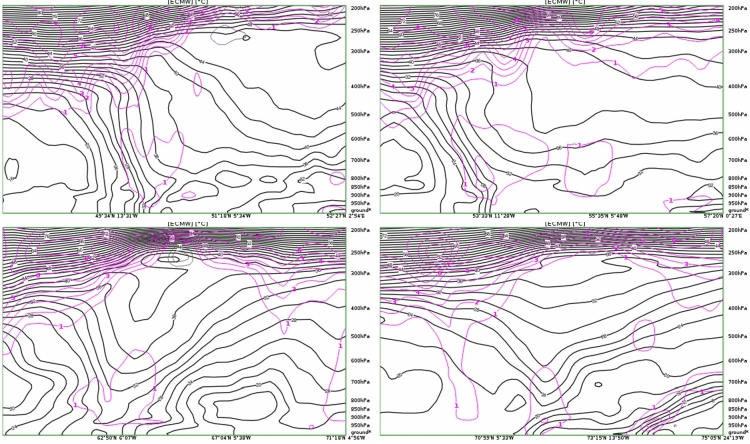
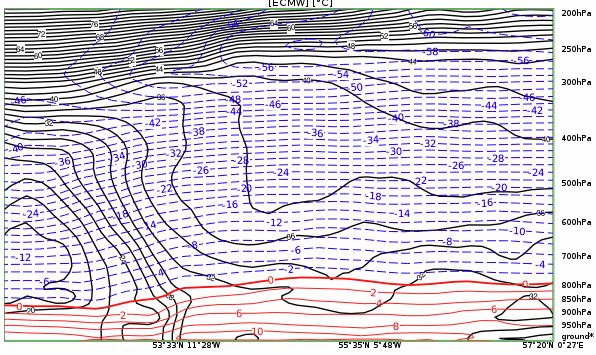
Legend: Schematics of vorticity advection and height at which PV is >=1.5 PVU for the four stages of development.
L.: (humid) isentropes (black); vorticity advection (cyclonic in red, anticyclonic in blue); r.: (humid) isentropes (black); magenta: height at which PV is >=1,5 PV units.
Note: To enlarge the images, click on them.
|
|
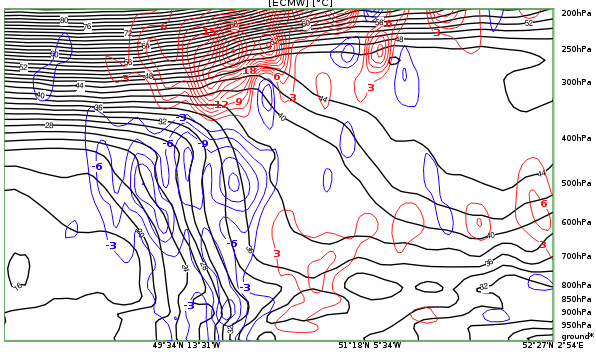
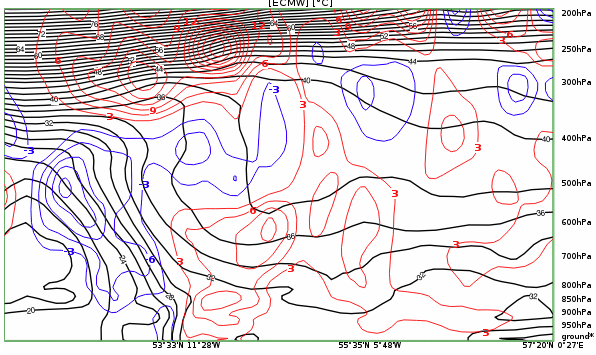
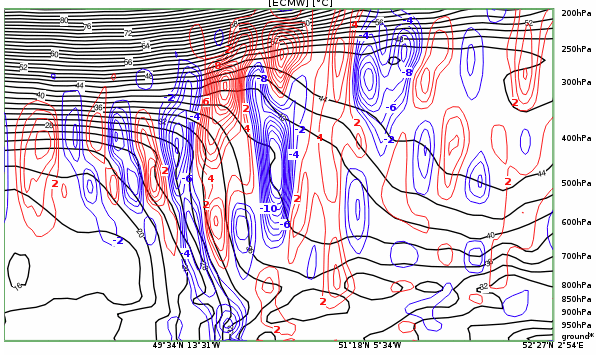
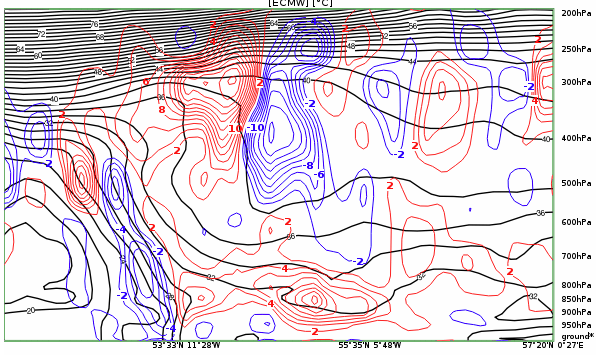
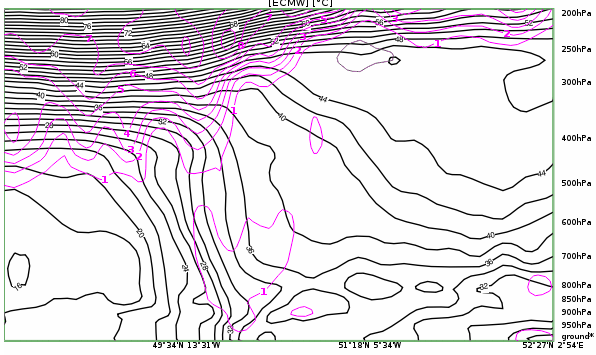
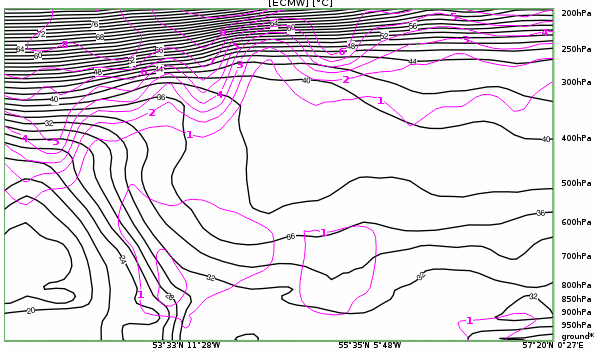
Legend: 20-22 February 2021, IR. Vertical cross sections.
Above: isentropes (black), vorticity advection (cyclonic in red, anticyclonic in blue); Below: Height of PV >= 1.5 PVU (magenta).
U.l.: 9 UTC on 20 February 2021, Wave stage; u.r.: 12 UTC on 20 February 2021, Intensification stage; 00 UTC on 21 February 2021, Mature stage; 00 UTC on 22 February 2021, Dissipation stage.
Note: To access the gallery of individual images click here
As mentioned above, CVA has a complicated distribution with many maxima and minima at all levels. But some characteristic features can be found also in this demonstration case:
- In the Wave and Intensification stages, an initial double structure can be seen in upper levels, immediately behind the frontal zone of high isentropic gradients. This is indicated by arrows.
- In the Mature stage there are two maxima in the upper levels of the huge extended low centre.
- In both the Mature and Dissipation stages, a VA maximum in low layers intensifies and represents the centre of the low at the surface or low layers.
The PV height shows both the downward protrusion of stratospheric air (where PV > = 1.5 PVU) and the development of the cyclonic rotation at low levels.
Weather Events
Weather events are described in detail in the relevant CMs "Wave" and "Warm Conveyor Belt Occlusion".
In this chapter, looking at weather events during a Polar Front type cyclogenesis, it is difficult to make clear distinctions between the four development stages, so no schematics are presented here except those below, taken from the individual CMs "Wave" and "Warm Conveyor Belt Occlusion".
Legend:
Synoptic observations for: l.: wave stage; r.: mature stage
However, a few statements about weather events and their developments during the cyclogenesis process can be made:
- The whole cyclogenesis process and its cloud configurations are meteorologically very active, with intensive precipitation in both, non-showery and shower form; depending on the season, rain or snow is observed.
- Showery precipitation is mainly found in the areas of the cold front and the wave. The warm front is rather usually accompanied by non-showery precipitation.
- Generally, non-showery rain (or snow) appears more in the early phases, especially in the Wave stage, while showery precipitation appears more in the later occlusion stages around the occlusion point in the inner part of the cloud spiral.
- The rain intensity decreases markedly from the Mature stage to the Dissipation stage.
This is demonstrated here with a case from 13-14 October 2020.
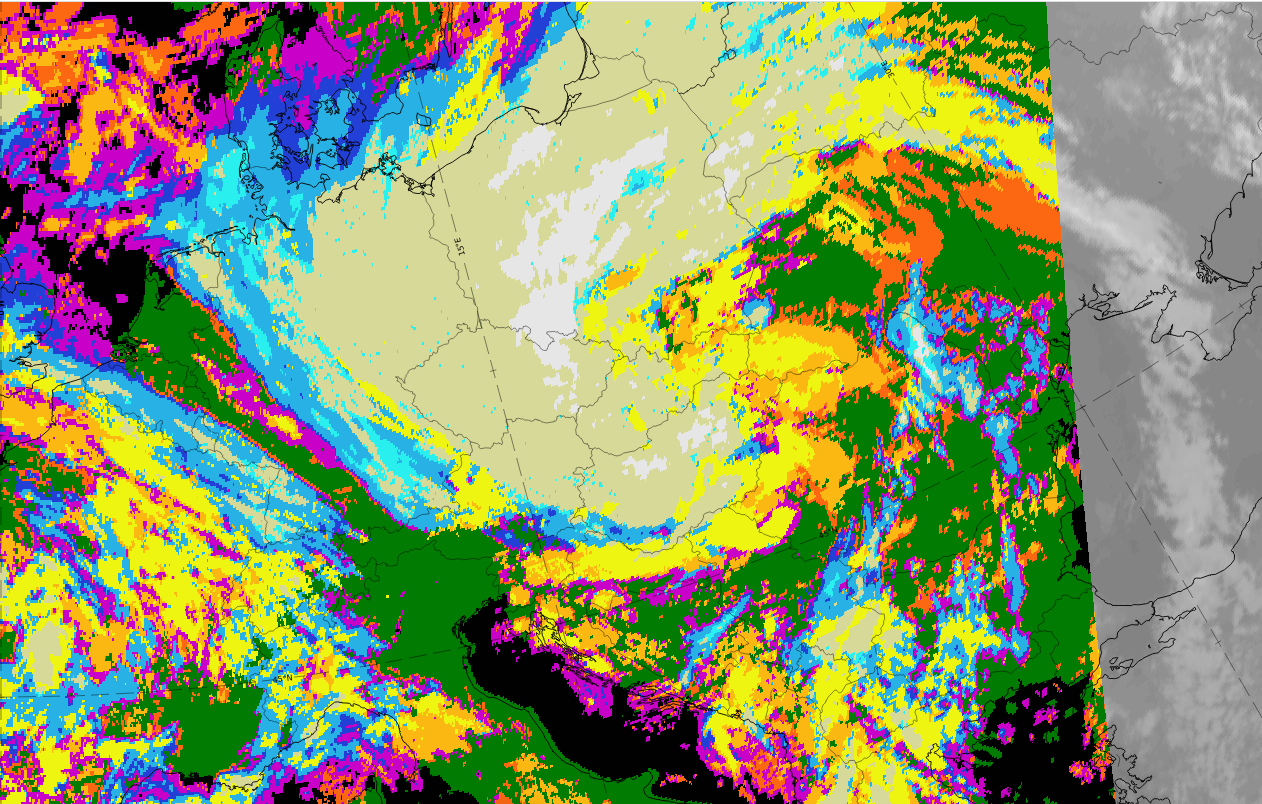
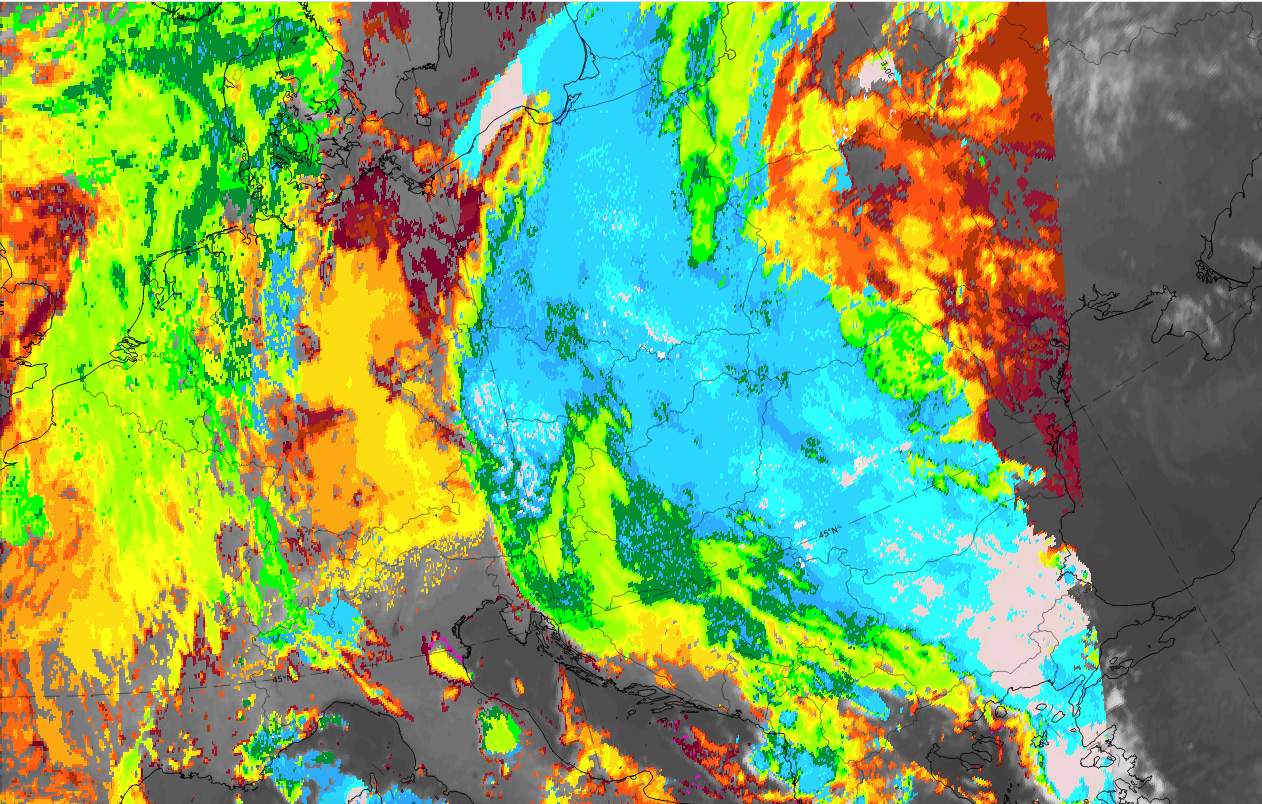
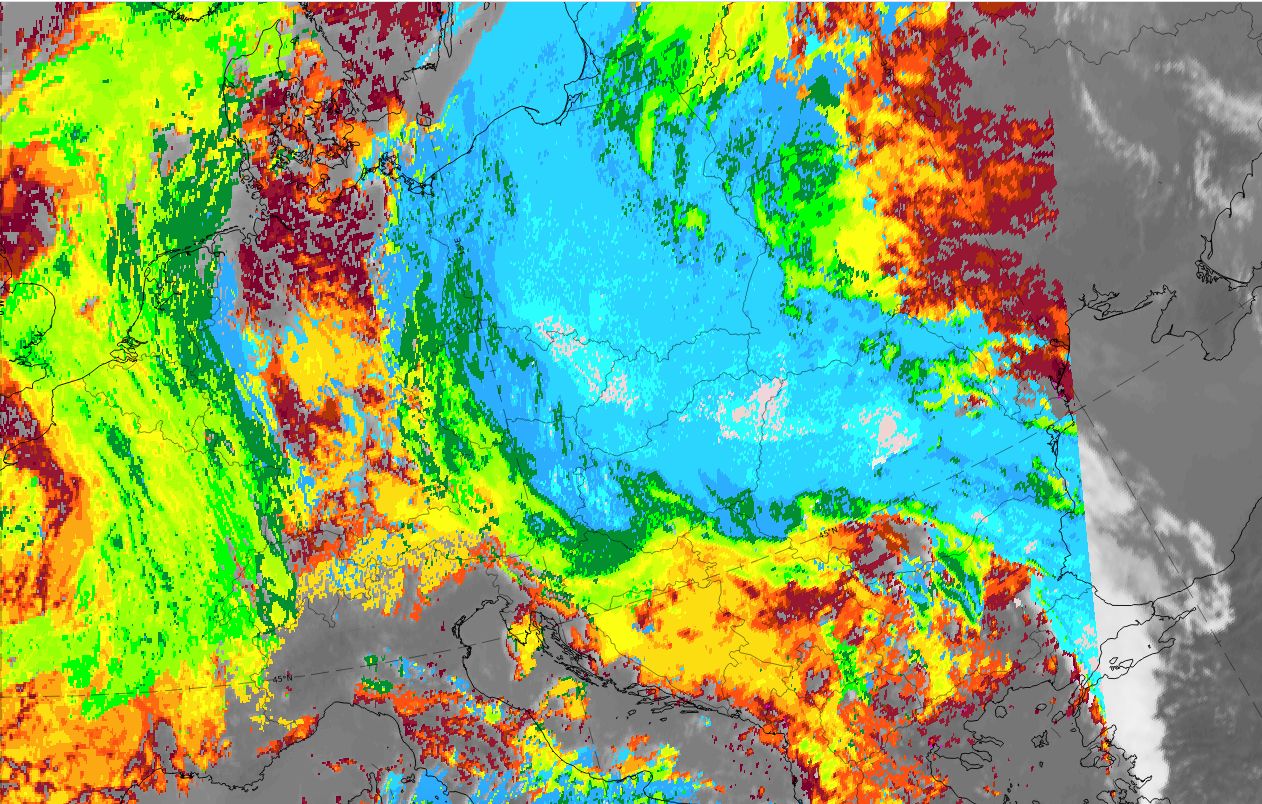
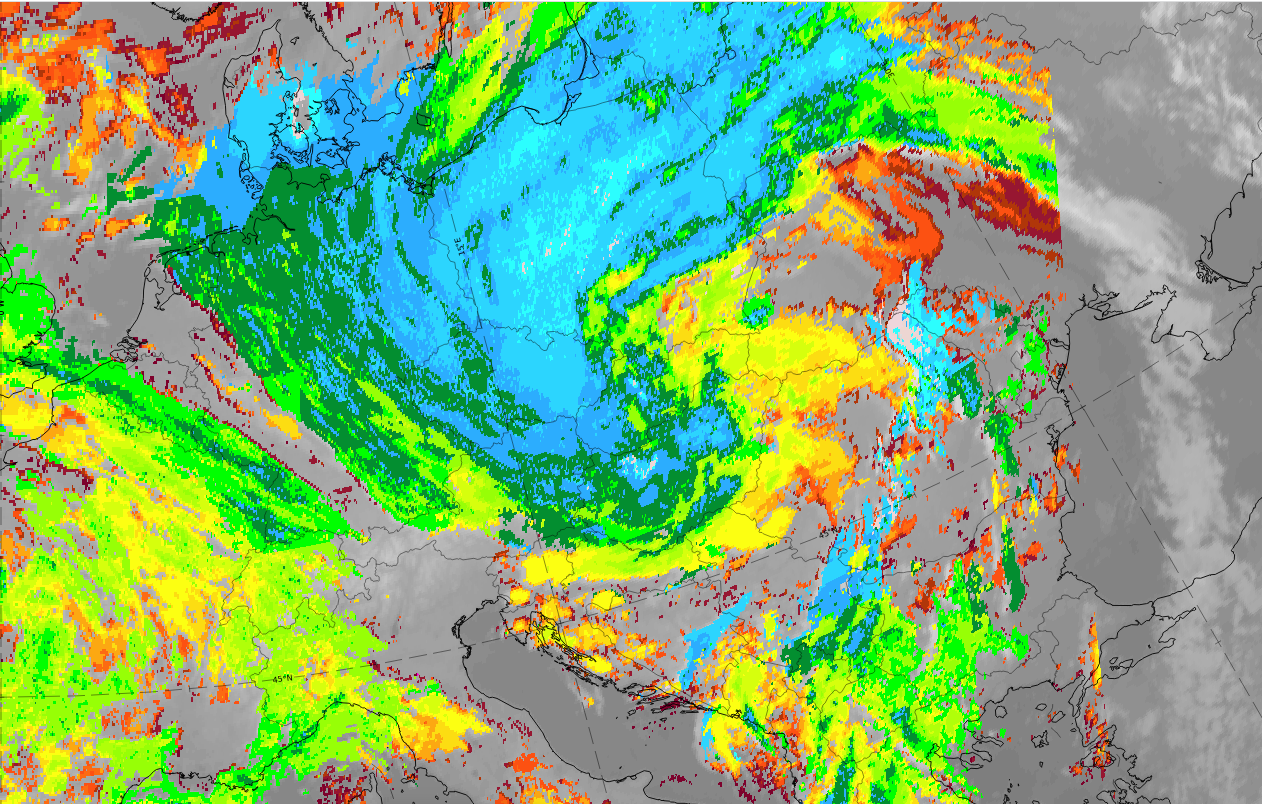
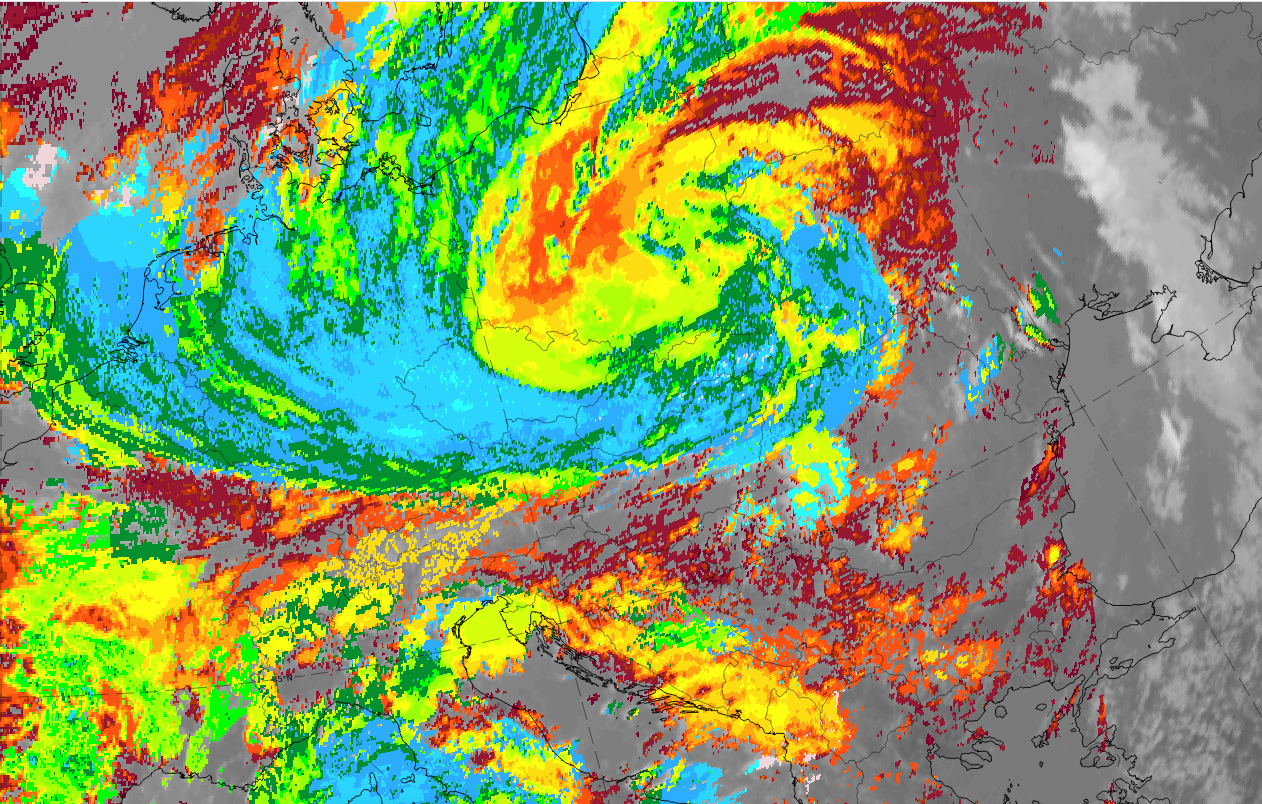
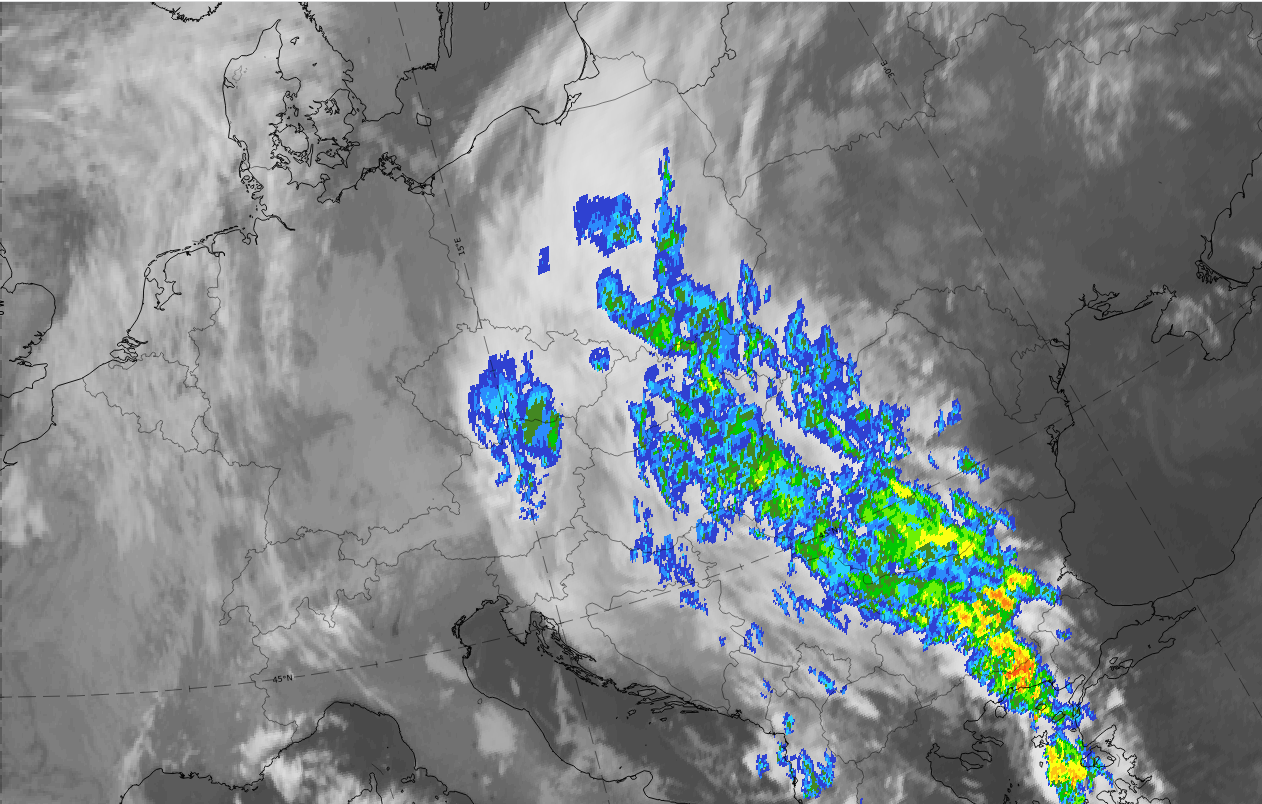
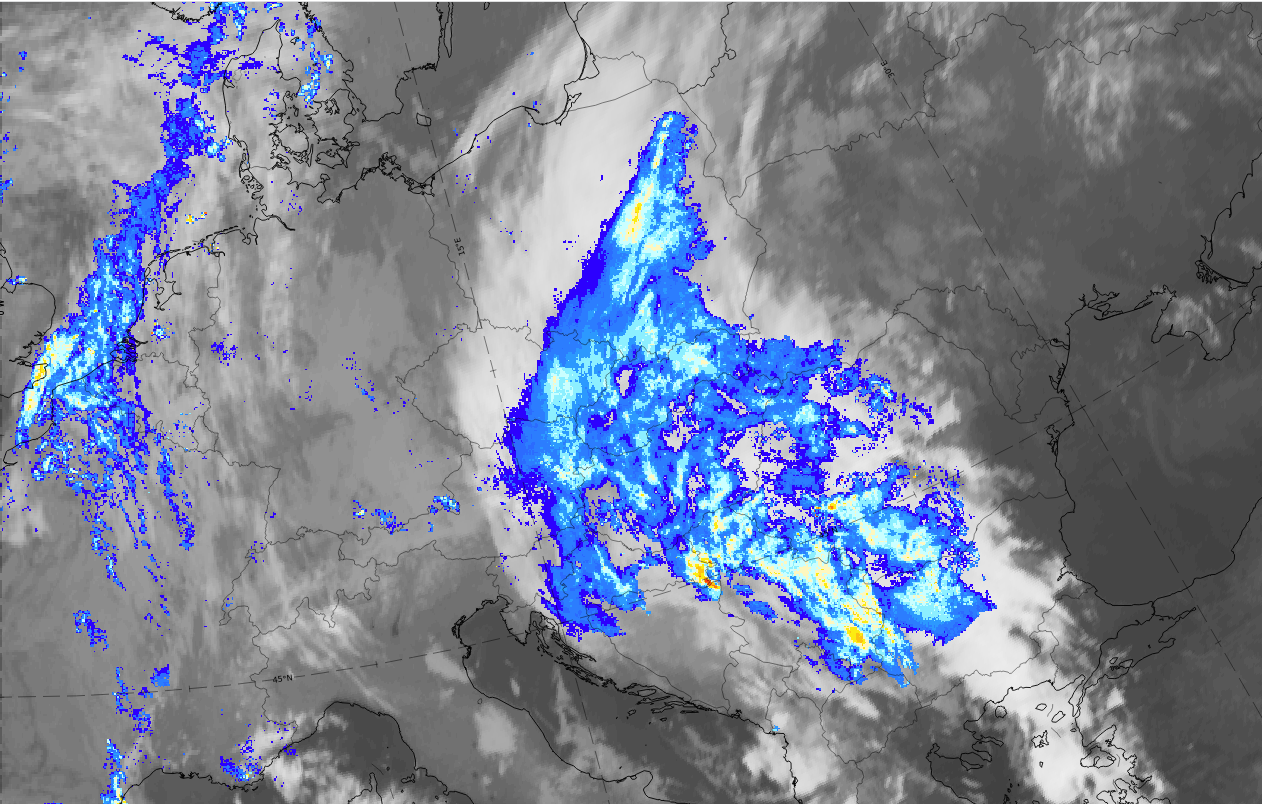
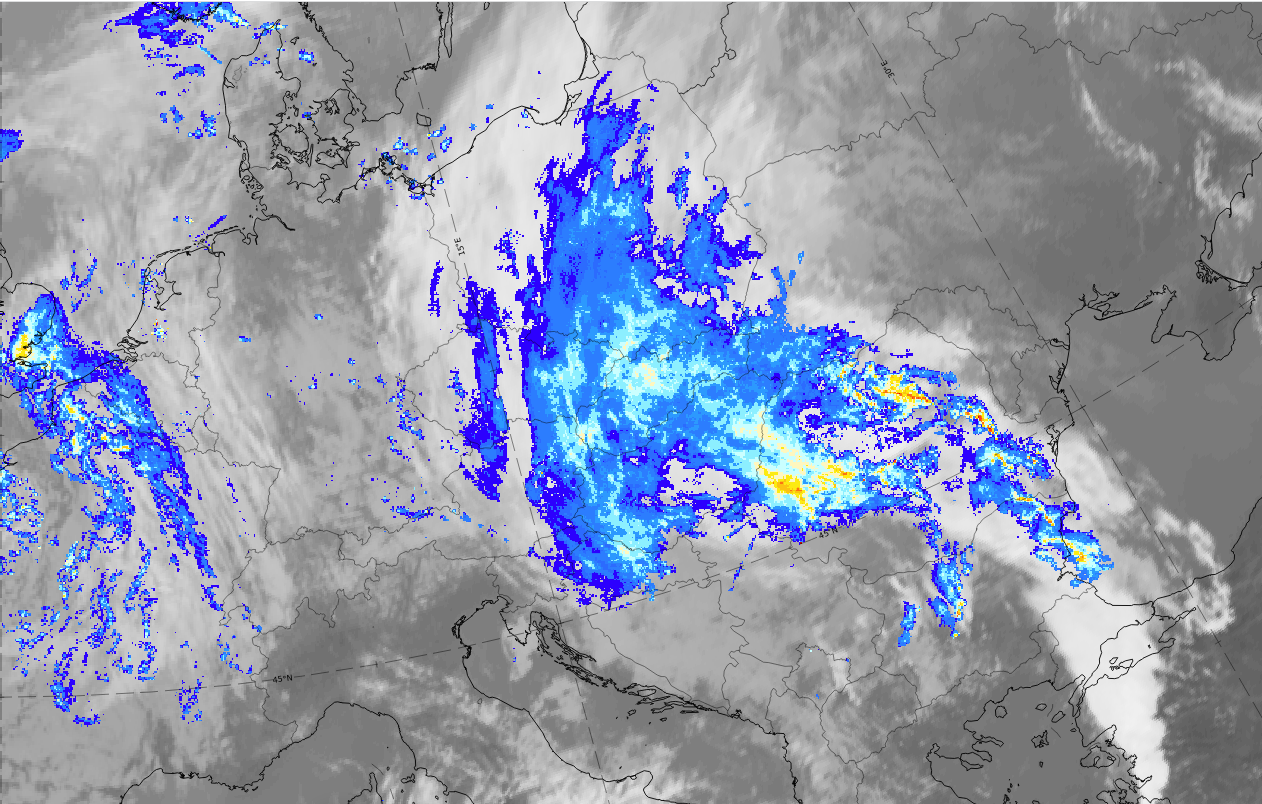
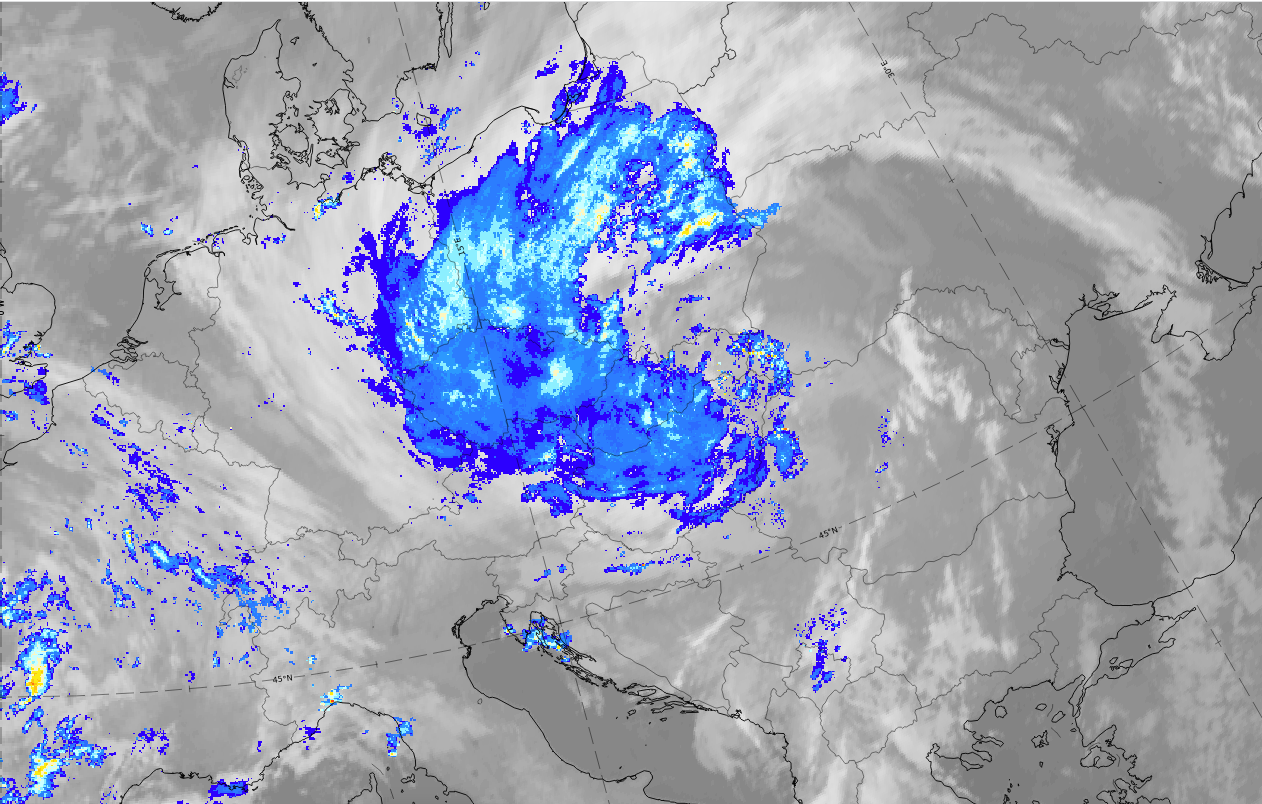
Legend: 13-14 October 2020, IR.
U.l.: 06 on 13 October 2020, Wave stage; u.r.: 12 UTC on 13 October 2020, Intensification stage; 00 UTC on 14 October 2020, Mature stage; 12 UTC on 14 October 2020, Dissipation stage.
Note: To enlarge the image, click on it.
Note: To access the gallery of individual images click here
The cloud configurations in the four cyclogenesis stages are very typical of Polar-Front-type cyclogenesis. They show a distinct cloud bulge in the Wave stage, which intensifies to more pronounced S shape in the Intensification stage, a bright occlusion cloud spiral in the Mature stage and the typical narrowing of the occlusion cloud spiral with some cloud in the centre splitting off in the Dissipation stage.
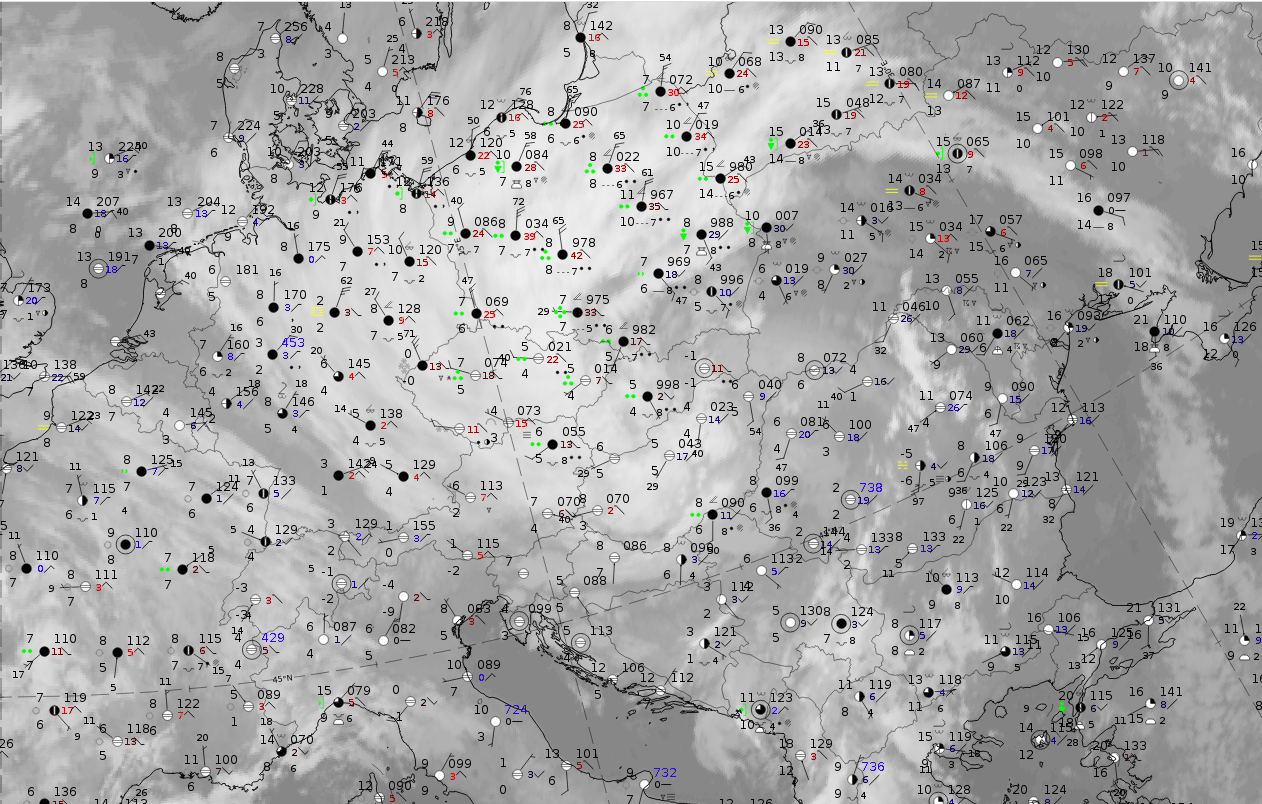
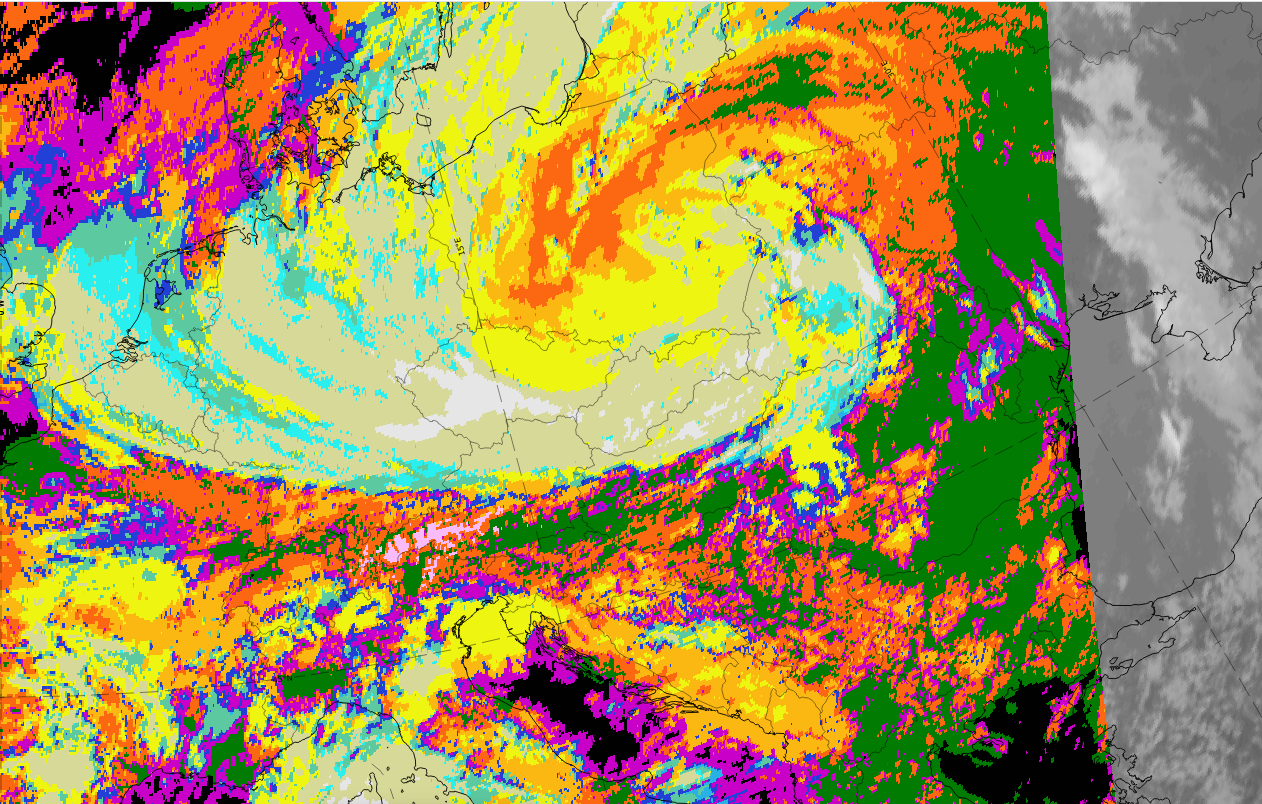
Legend: 13-14 October 2020, IR; synoptic observations
U.l.: 06 on 13 October 2020, Wave stage; u.r.: 12 UTC on 13 October 2020, Intensification stage; 00 UTC on 14 October 2020, Mature stage; 12 UTC on 14 October 2020, Dissipation stage.
Note: To enlarge the image, click on it.
Note: To access the gallery of individual images click here
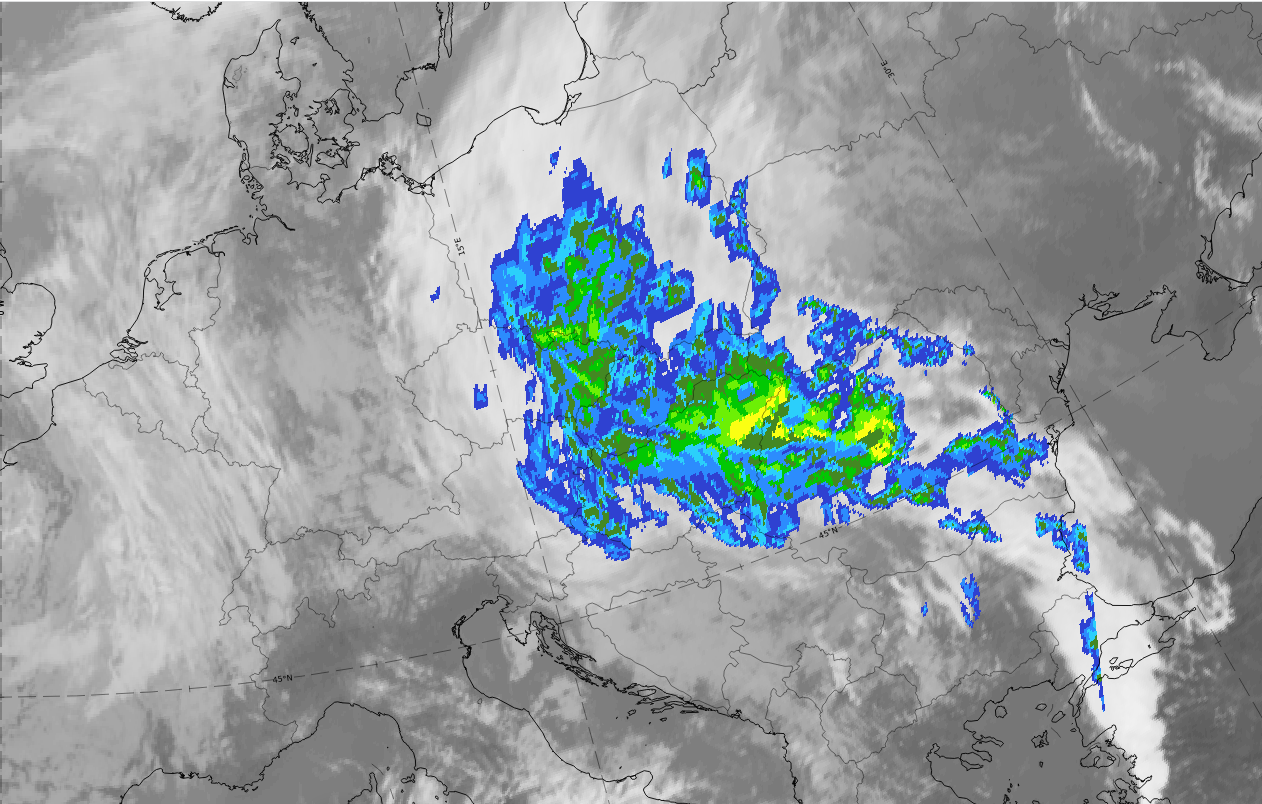
All four stages are accompanied by heavy precipitation, including showers. Showers appear more in the occlusion early on and in the inner part of the cloud spiral. The Mature stage has the highest rain intensities (according the numbers in the weather key) while a decrease of intensity is clearly visible in the Dissipation stage.
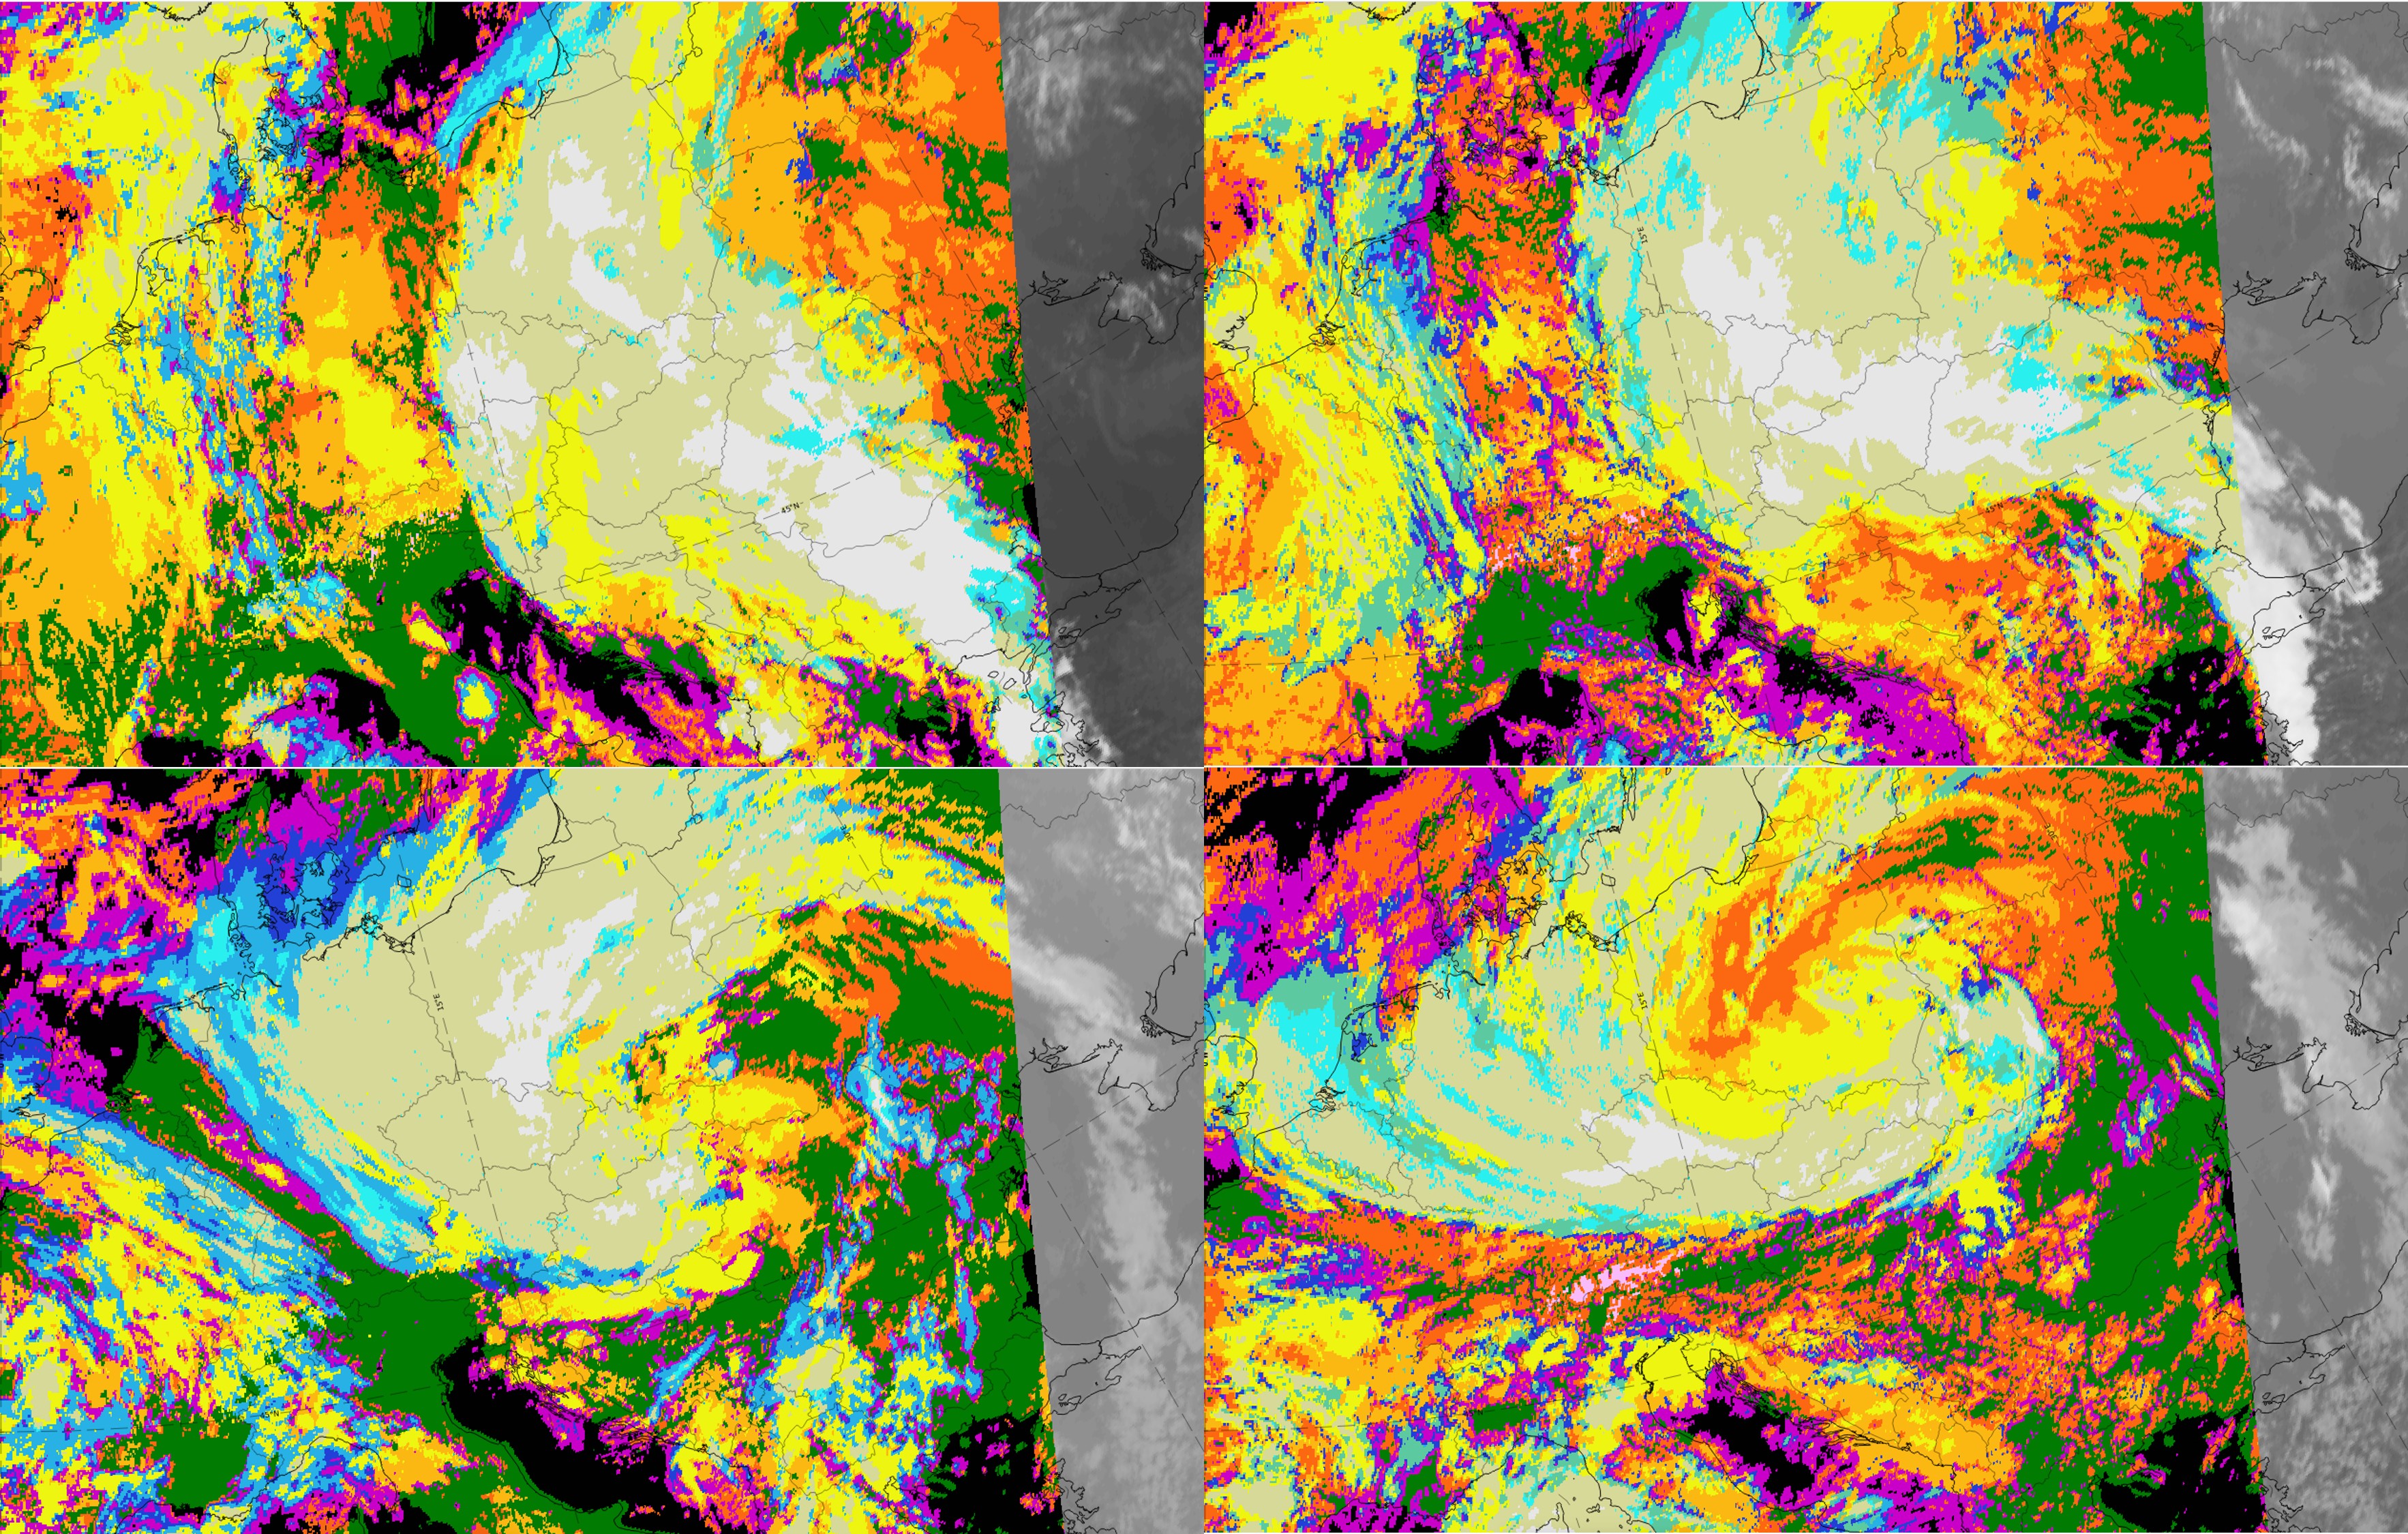
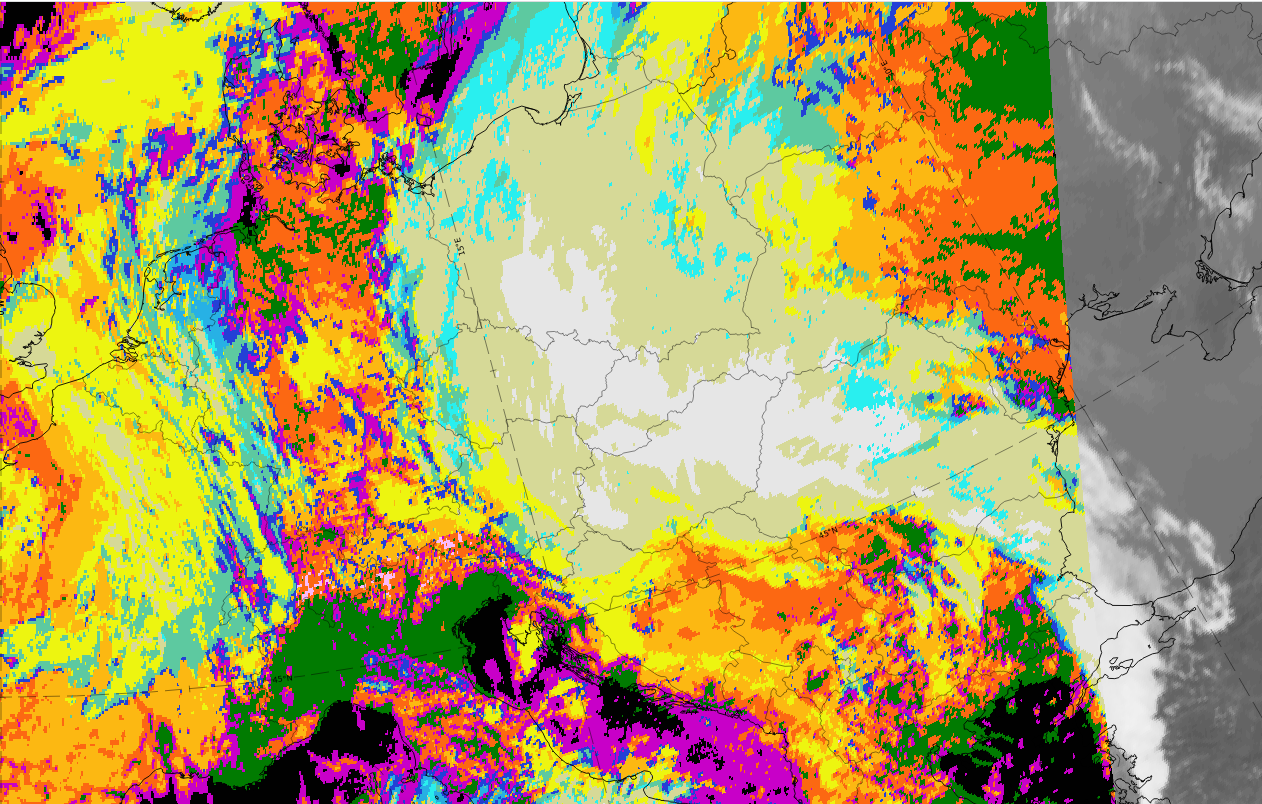
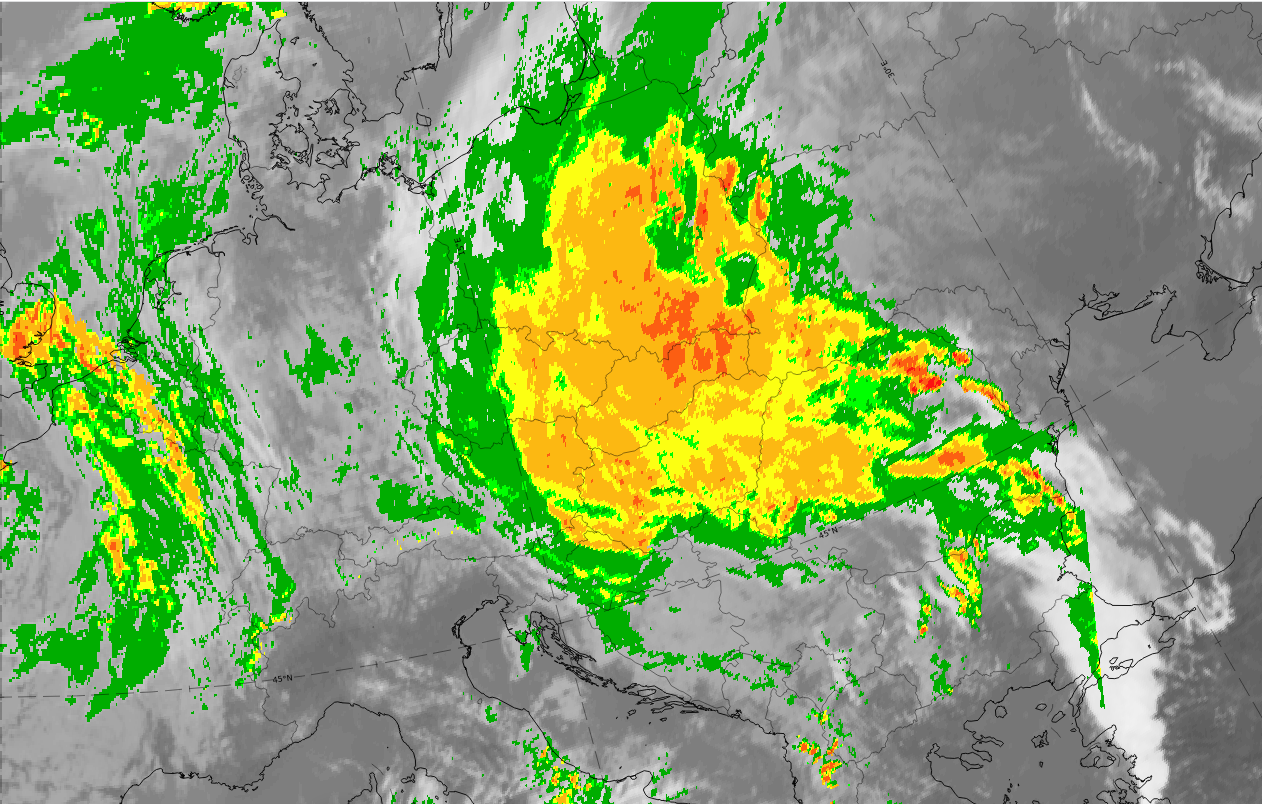
Legend: 13-14 October 2020, IR; Cloud Type (CT) from NWCSAF.
U.l.: 06 on 13 October 2020, Wave stage; u.r.: 12 UTC on 13 October 2020, Intensification stage; 00 UTC on 14 October 2020, Mature stage; 12 UTC on 14 October 2020, Dissipation stage.
Note: To enlarge the image, click on it.
Note: To access the gallery of individual images click here
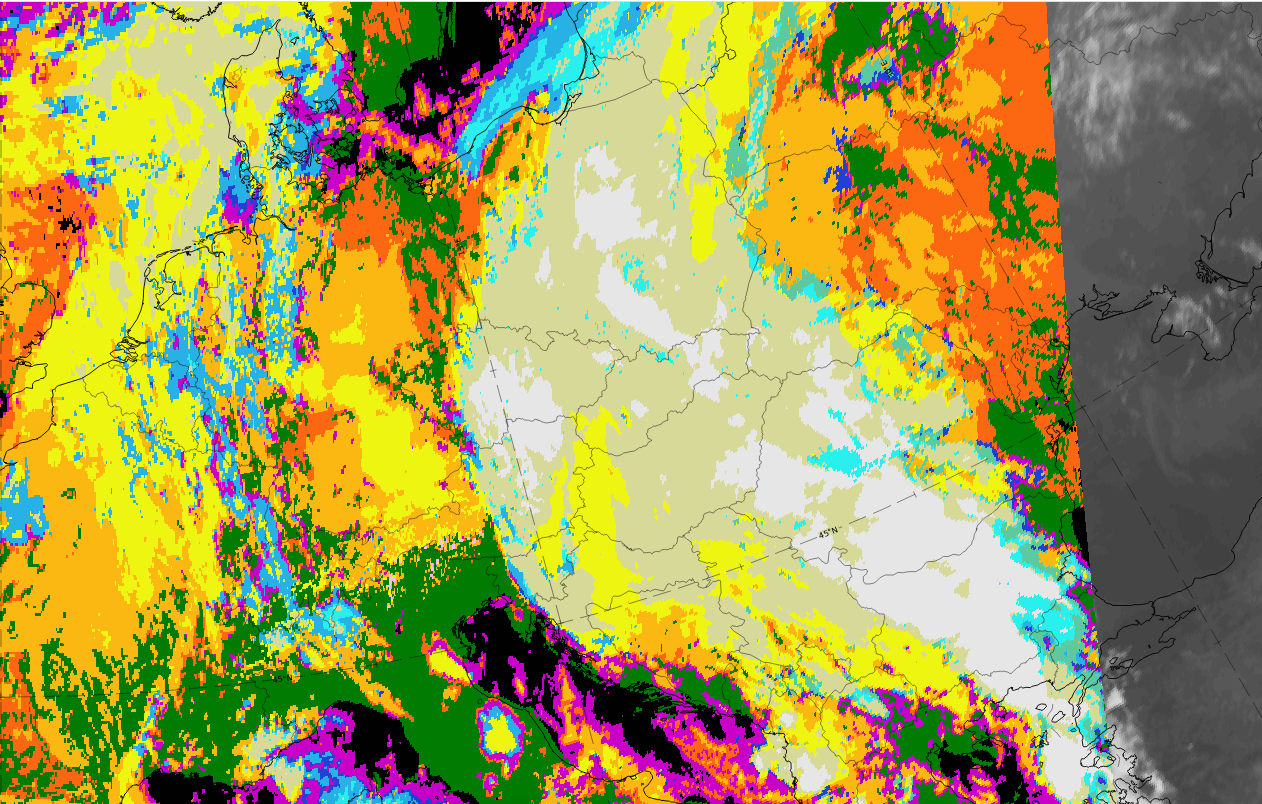
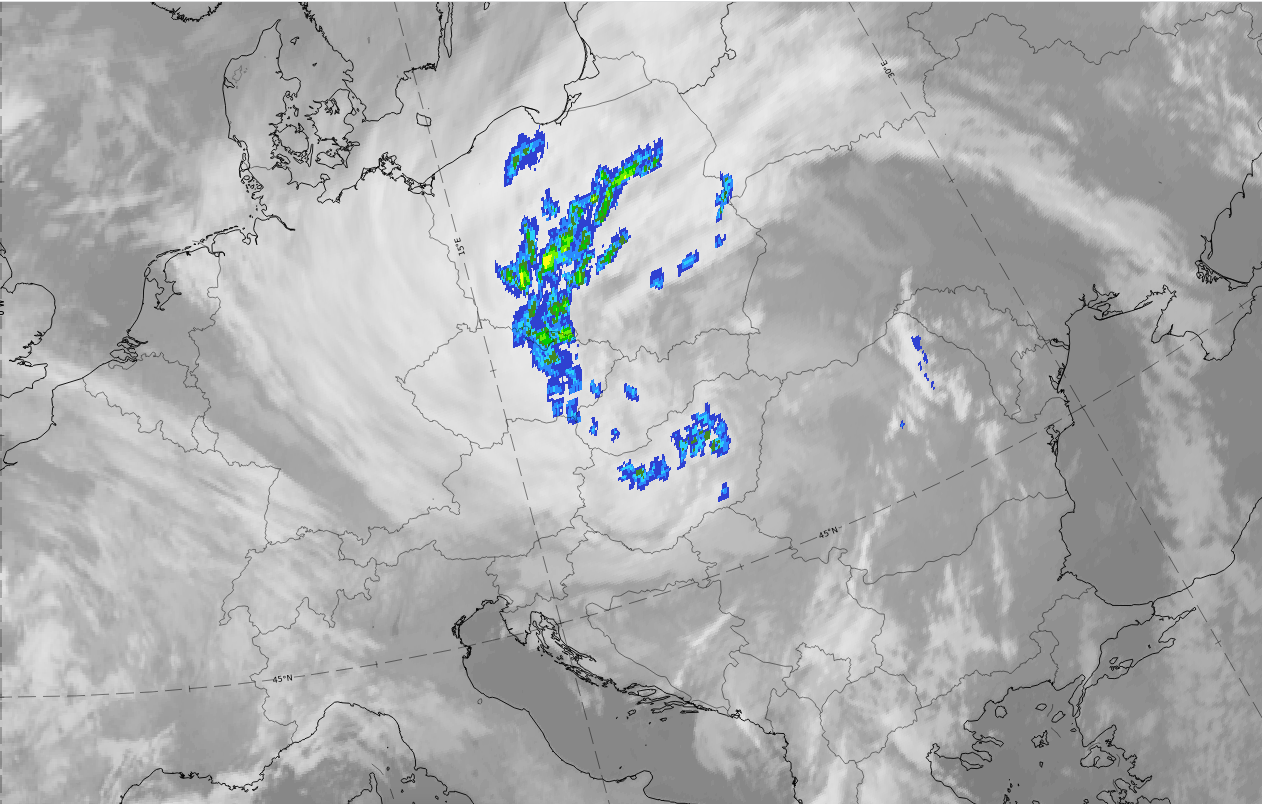
Legend: 13-14 October 2020, IR; Cloud Top height (CTTH) from NWCSAF.
U.l.: 06 on 13 October 2020, Wave stage; u.r.: 12 UTC on 13 October 2020, Intensification stage; 00 UTC on 14 October 2020, Mature stage; 12 UTC on 14 October 2020, Dissipation stage.
Note: To enlarge the image, click on it.
Note: To access the gallery of individual images click here
In all four stages the are "high opaque" clouds, embedded with areas of "very high opaque". In the Dissipation stage, more areas of "semi-transparent thick" clouds appear.
The cloud top heights of these "high opaque" and "very high opaque" clouds are between 8000 and 10000 meters. In the "Intensification stage" there are some small spots reaching tops of 12000 metres and, in the Dissipation stage, areas with cloud top heights of 4000-6000 metres appear in the inner parts as well as at their boundaries.
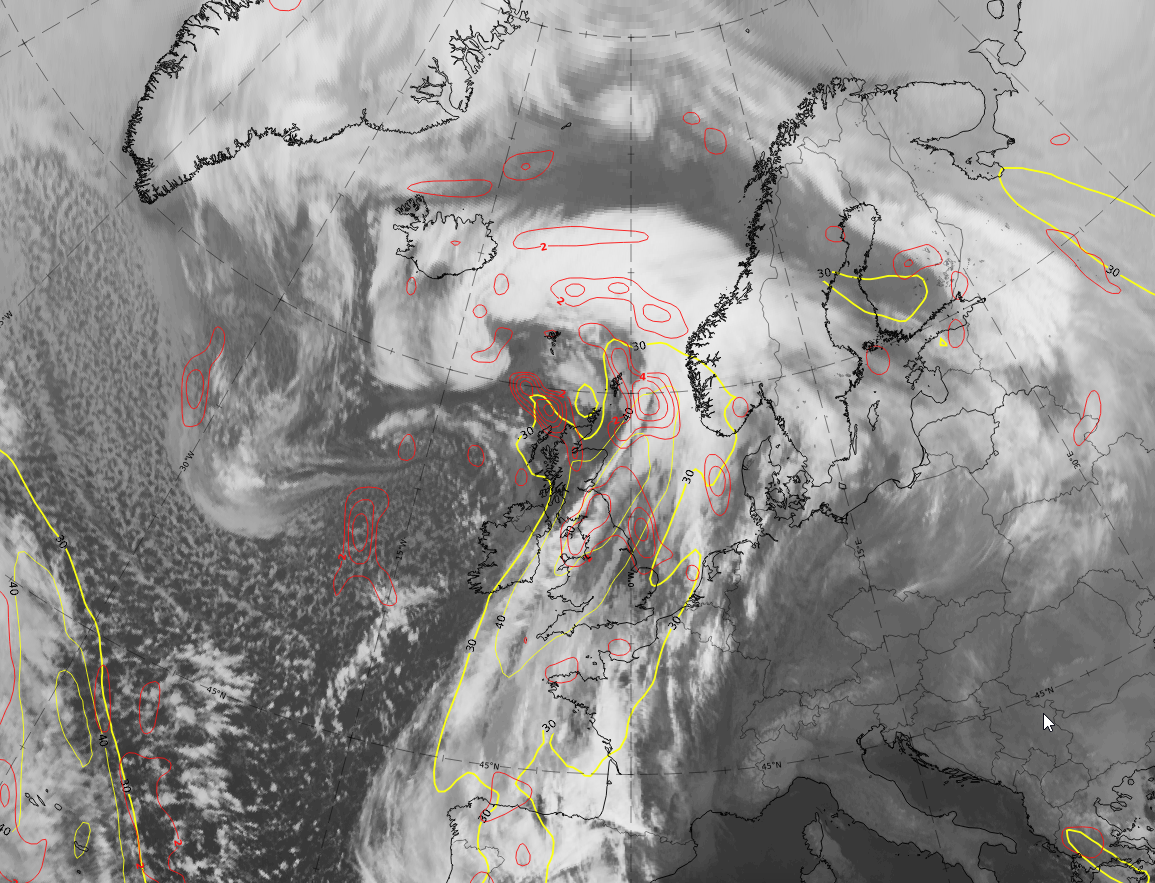
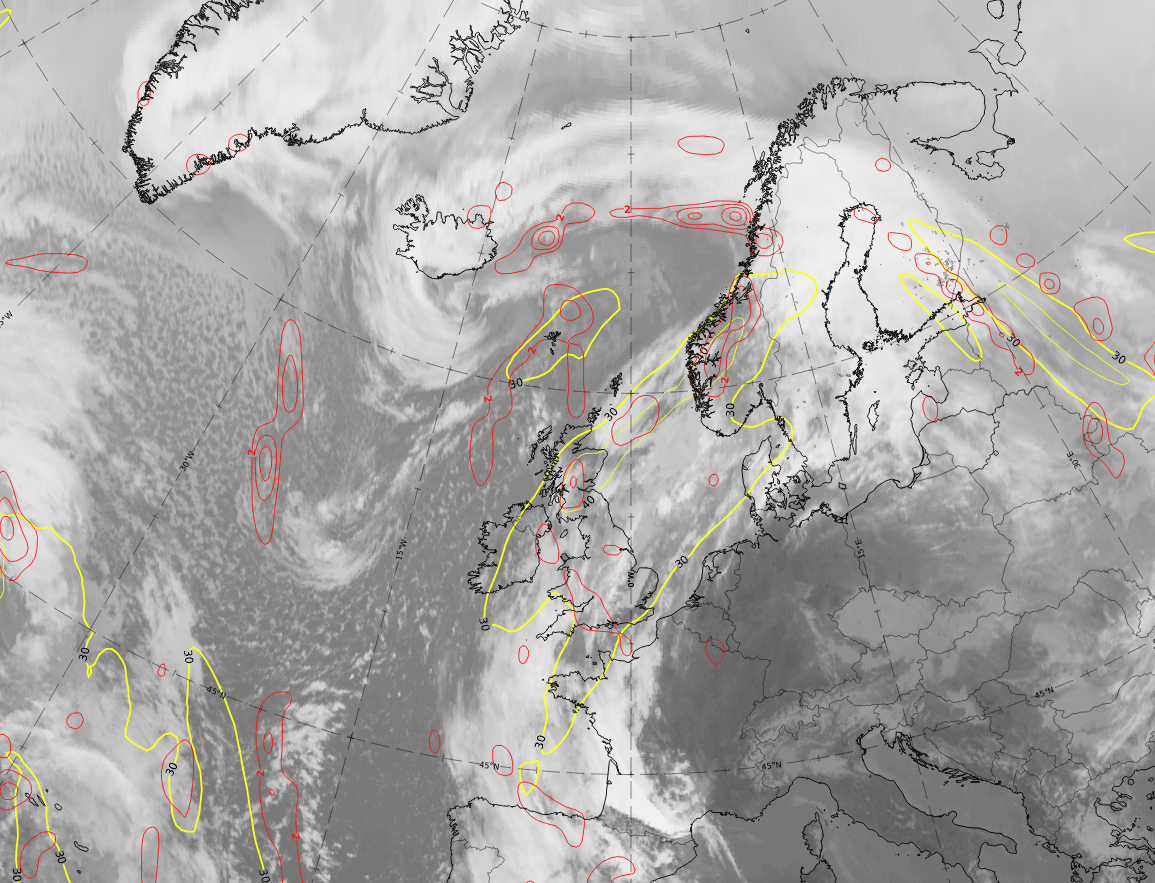
Legend: 13-14 October 2020, IR; Convective Rainfall Rate (CRR) from NWCSAF.
U.l.: 06 on 13 October 2020, Wave stage; u.r.: 12 UTC on 13 October 2020, Intensification stage; 00 UTC on 14 October 2020, Mature stage; 12 UTC on 14 October 2020, Dissipation stage.
Note: To enlarge the image, click on it.
Note: To access the gallery of individual images click here
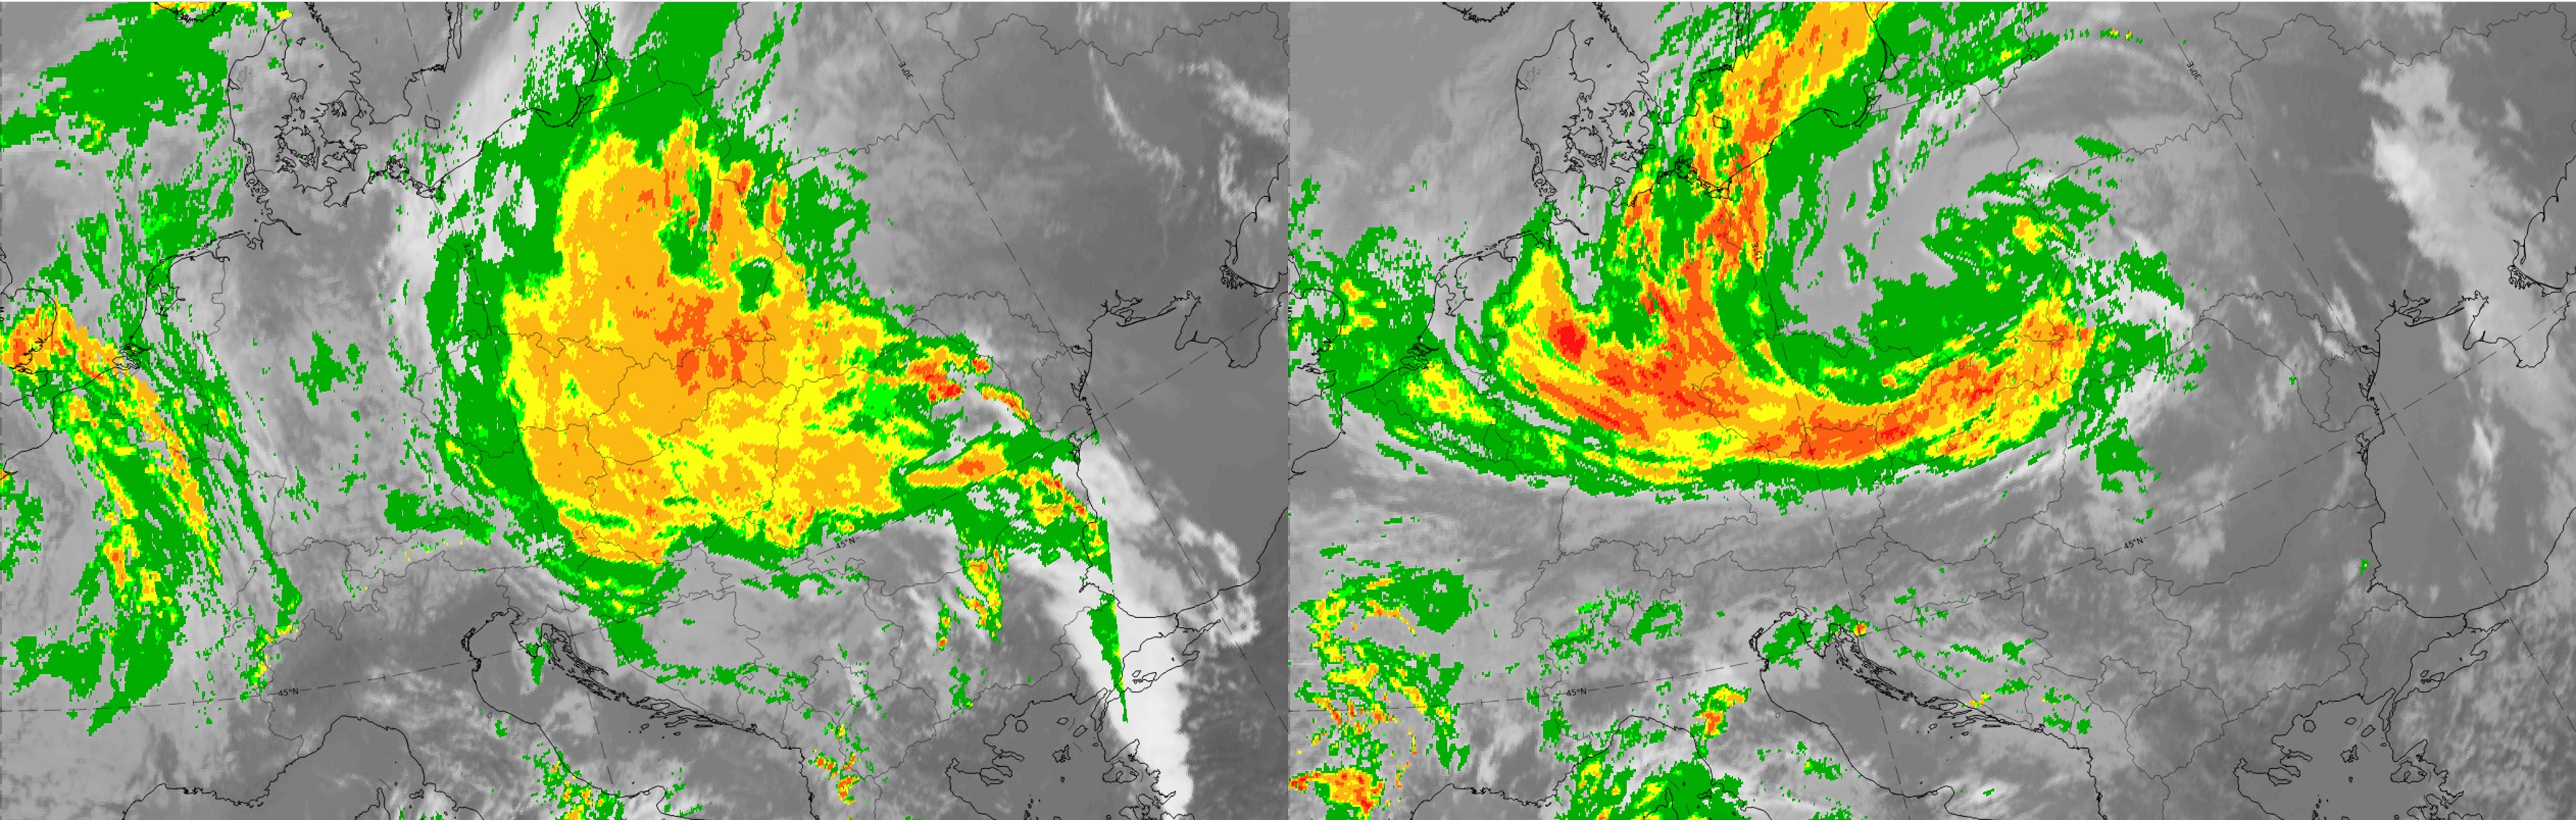
Legend: 13-14 October 2020, IR; Precipitating Clouds (PC) from NWCSAF.L.: 12 on 13 October 2020, Intensification stage; R.: 12 UTC on 14 October 2020, Dissipation stage.
Note: To enlarge the image, click on it.
Note: To access the gallery of individual images click here
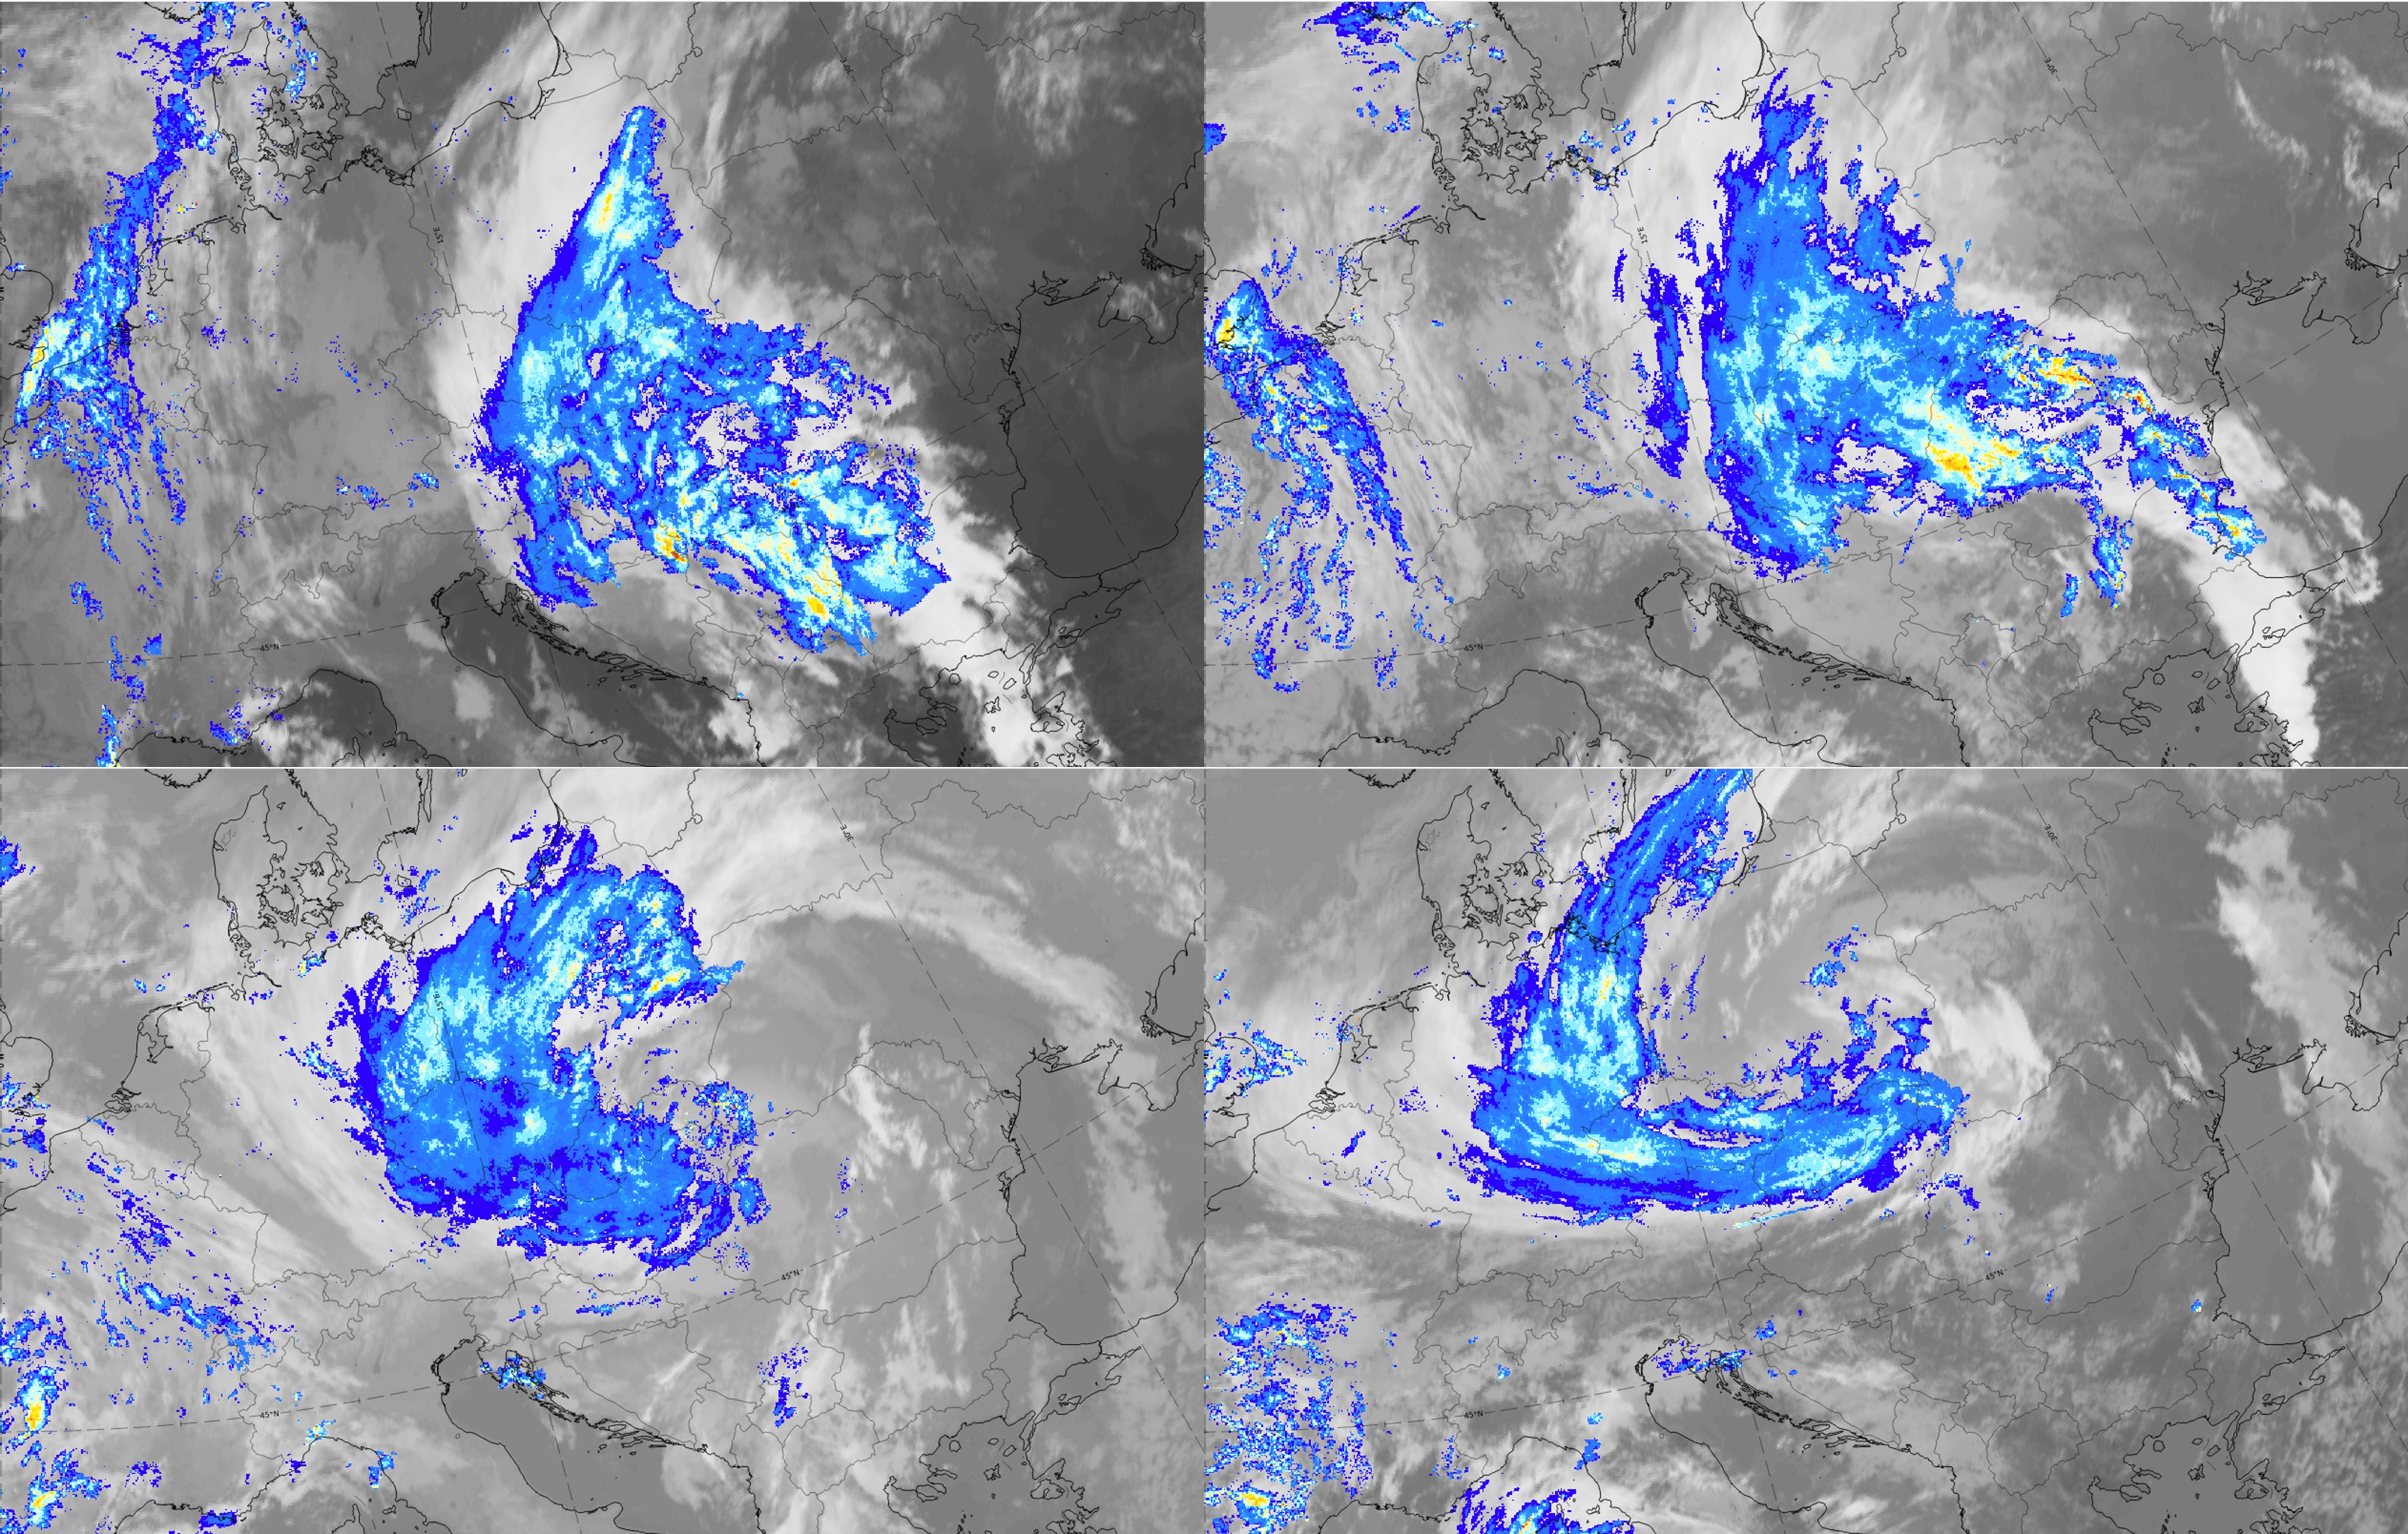
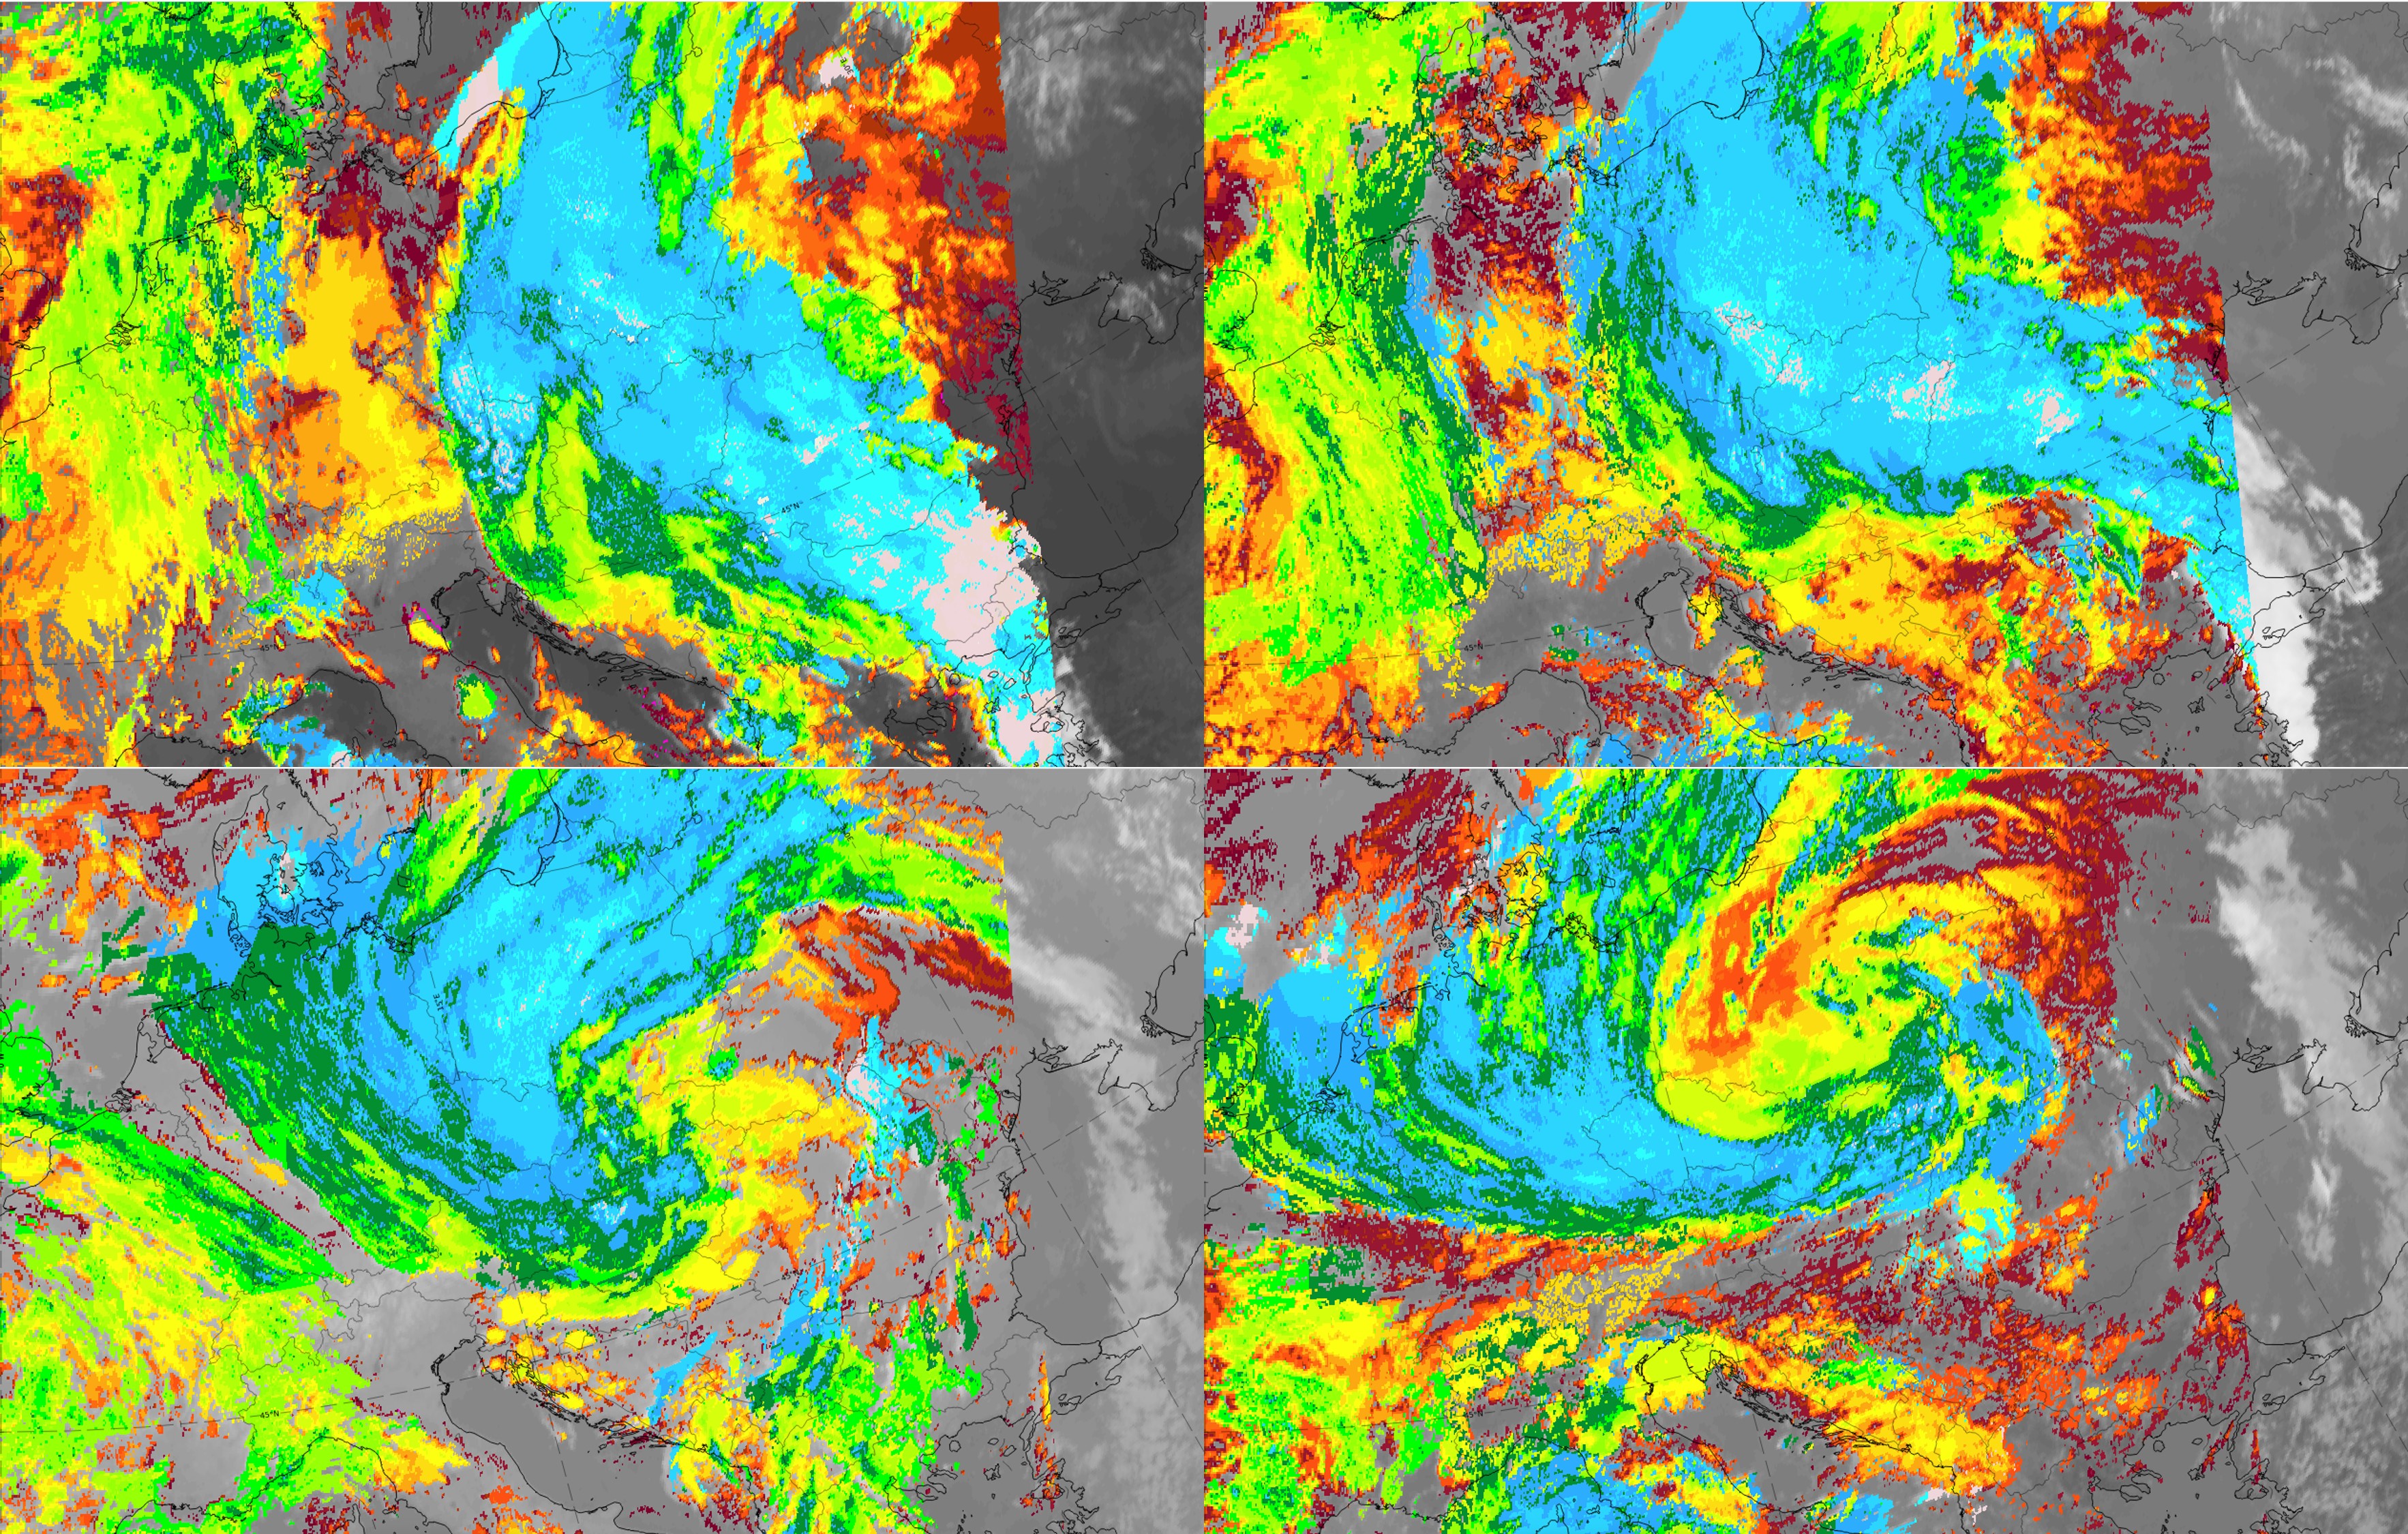
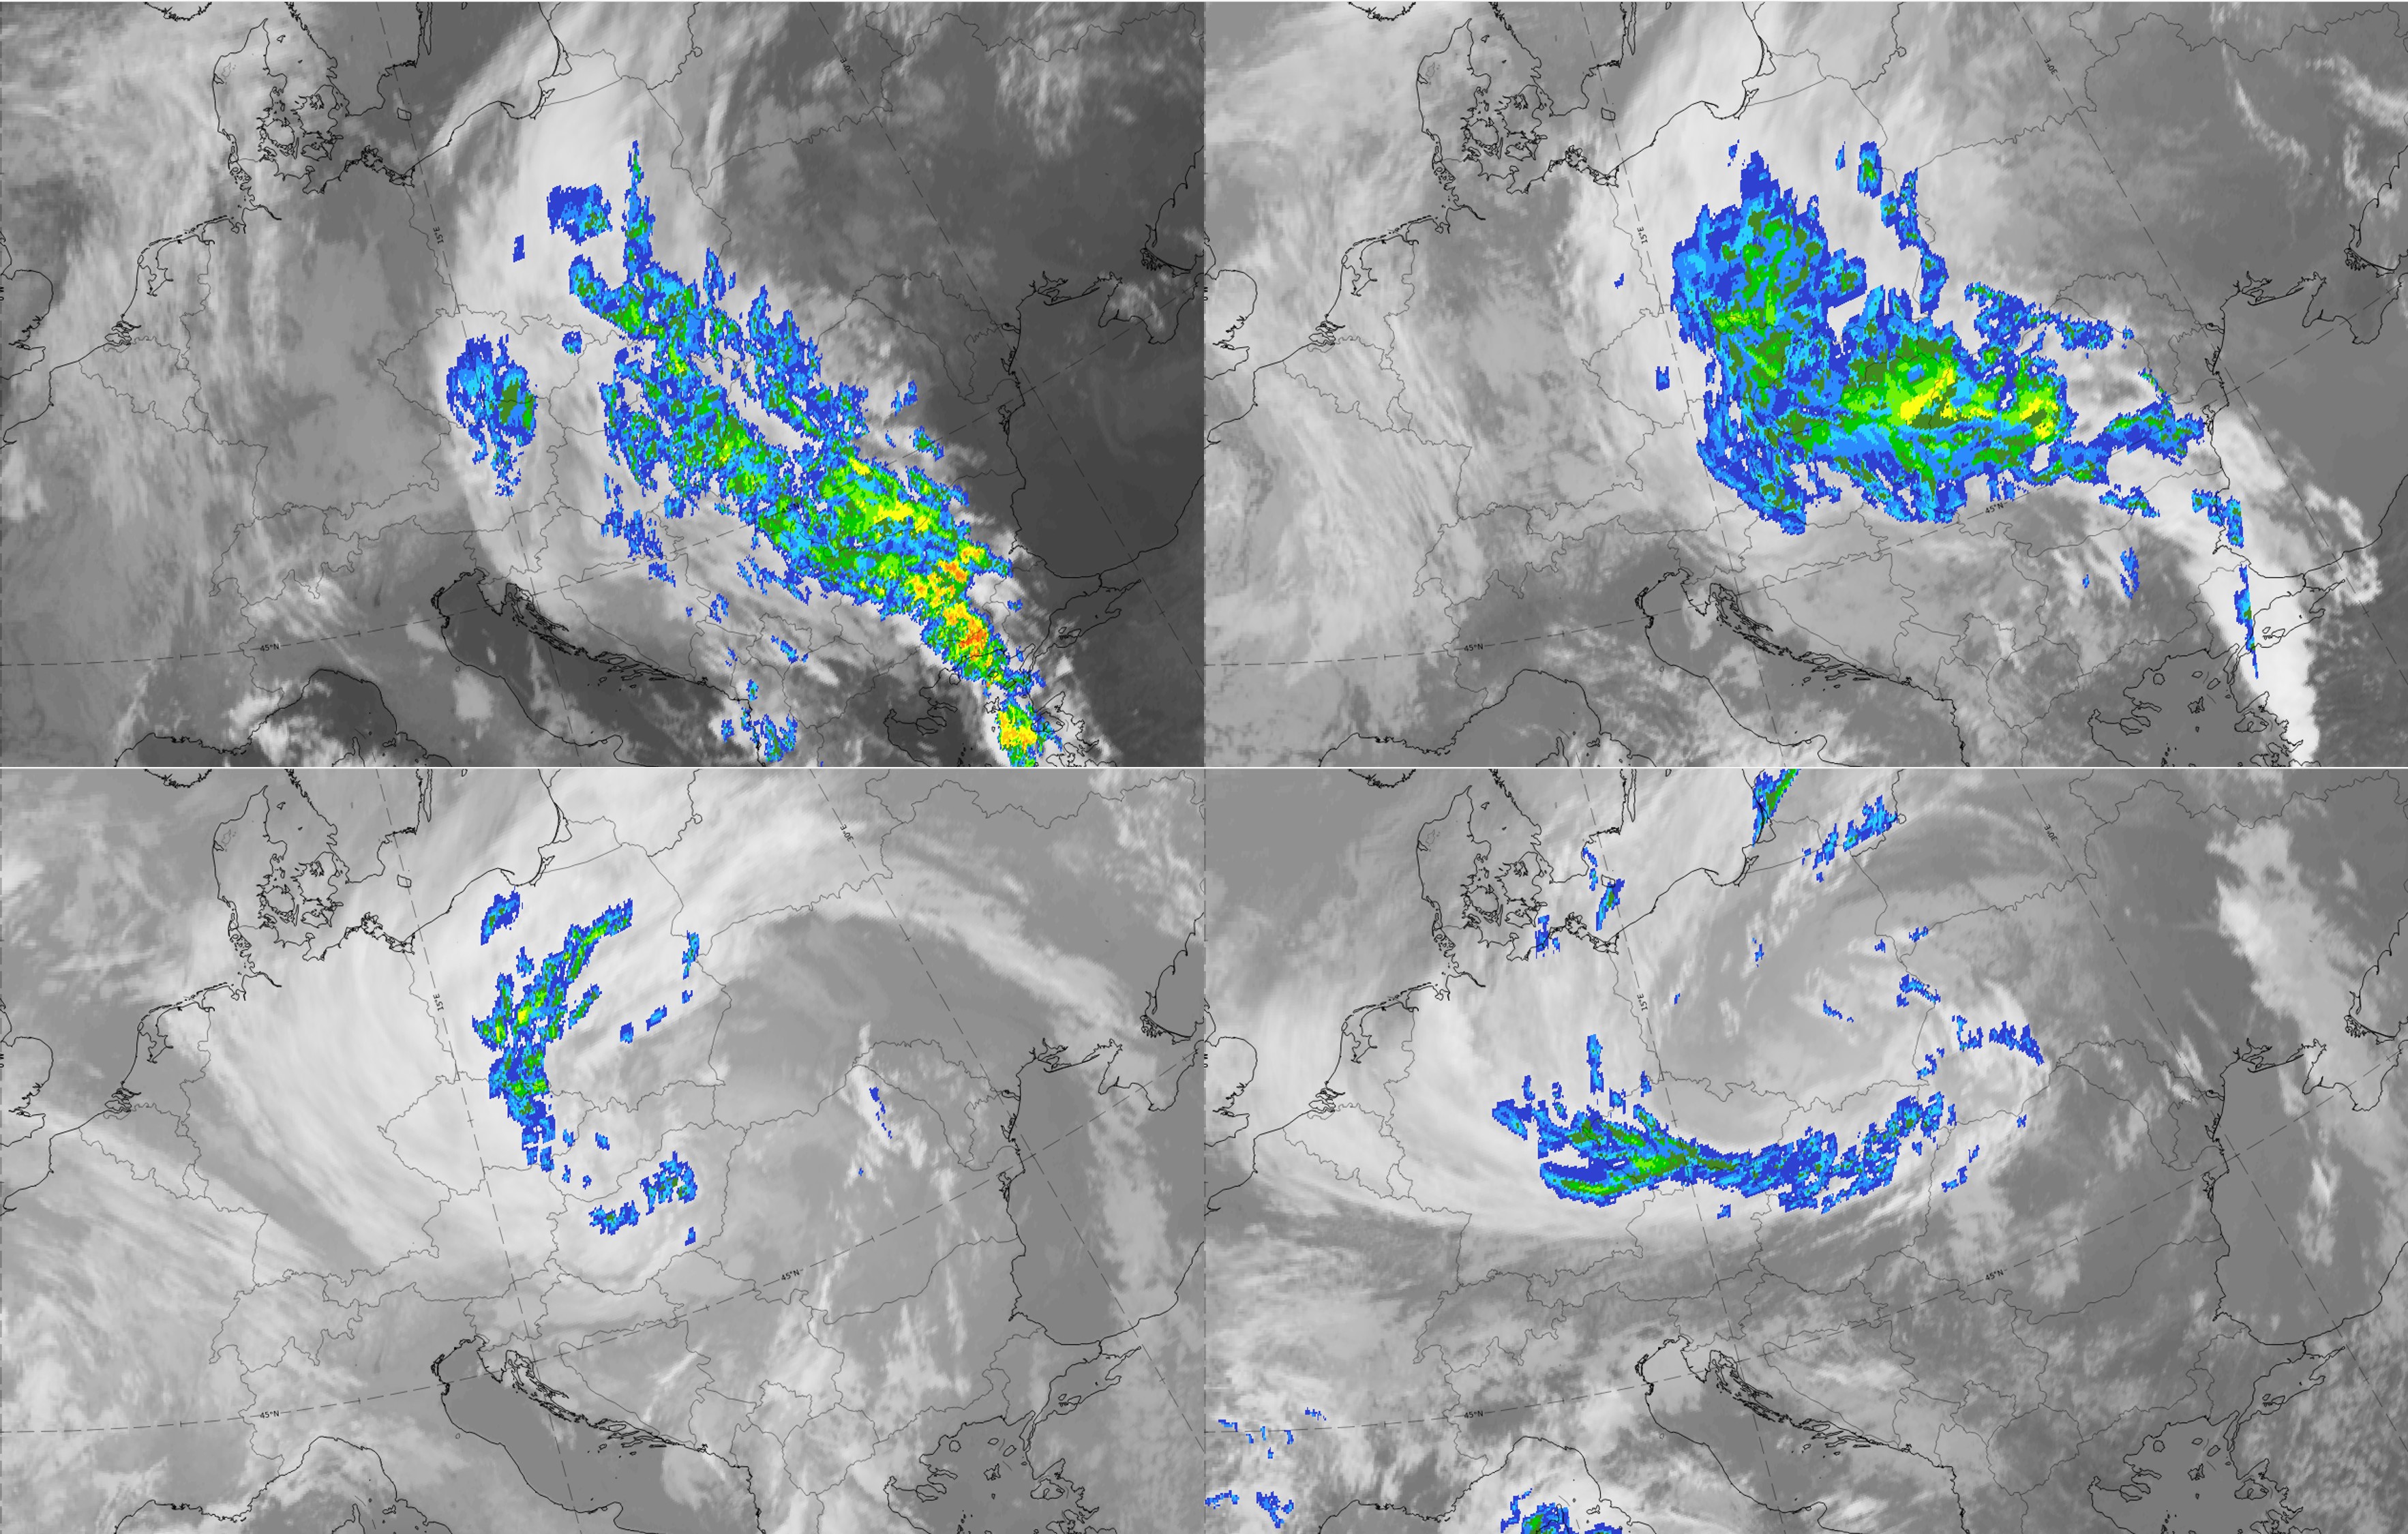
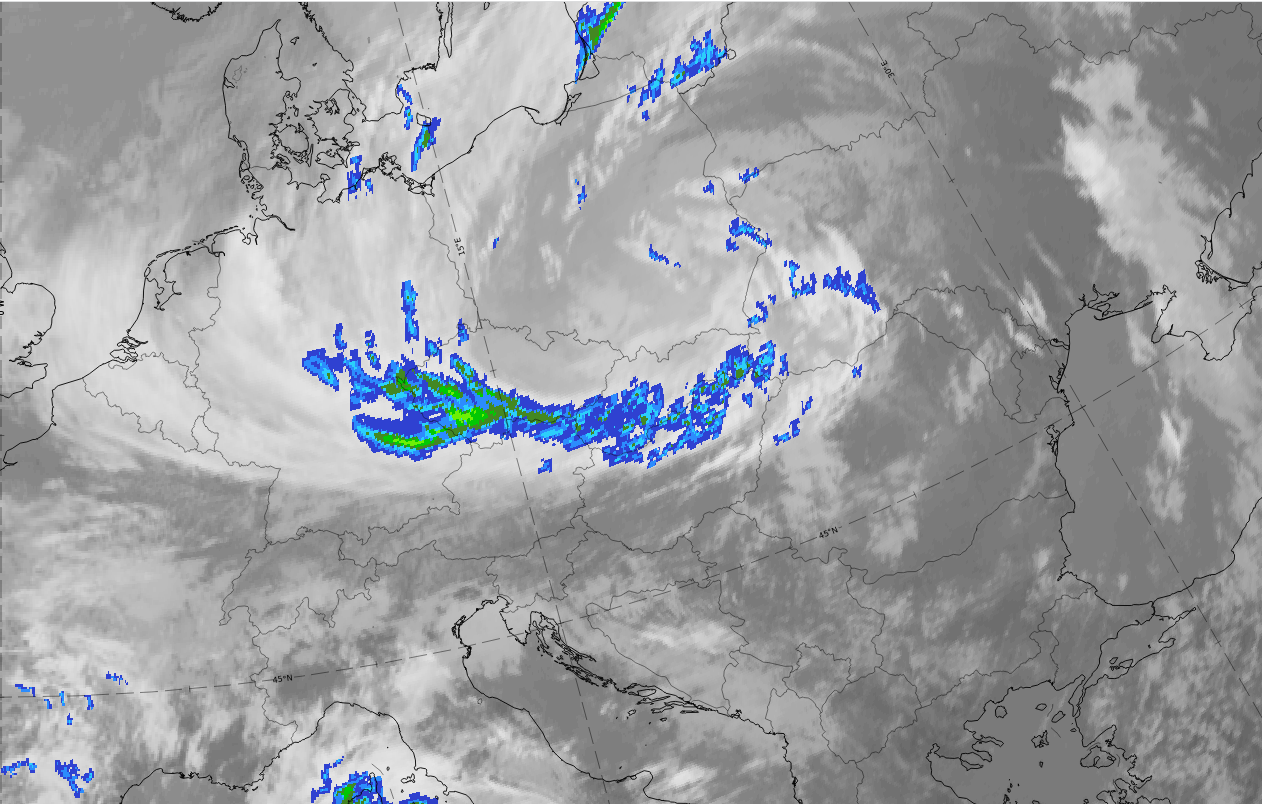
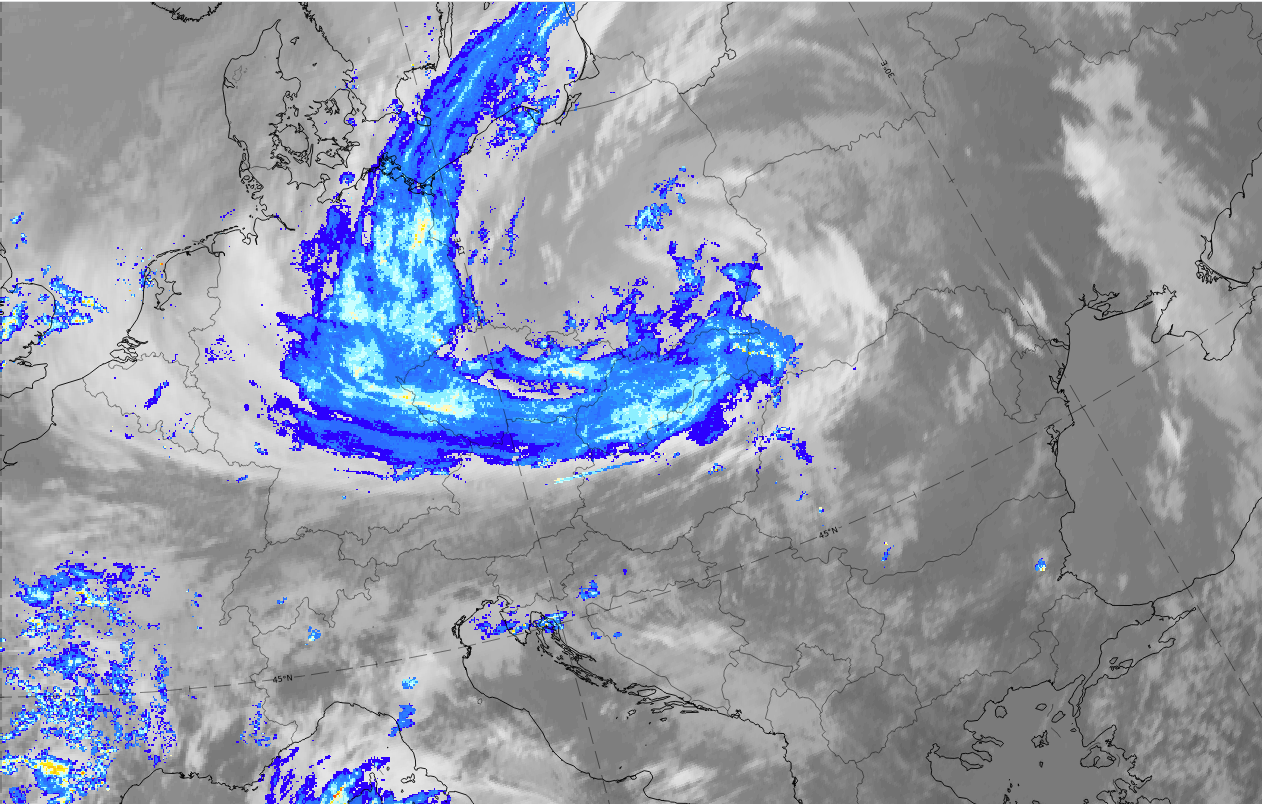
Legend: 13-14 October 2020, IR; Opera Radar system.
U.l.: 06 on 13 October 2020, Wave stage; u.r.: 12 UTC on 13 October 2020, Intensification stage; 00 UTC on 14 October 2020, Mature stage; 12 UTC on 14 October 2020, Dissipation stage.
Note: To enlarge the image, click on it.
Note: To access the gallery of individual images click here
Precipitation is shown in the following three parameters:
- Convective rainfall rate (CRR) from NWCSAF
- Precipitating clouds (PC) from NWCSAF
- Radar intensity from the Opera Radar System.
The parameter PC, which represents non-showery precipitation has reasonable values only at 12 UTC; CRR shows only showery precipitation, while the radar system does not differentiate between these two kinds of precipitation.
The largest areas of precipitation occur in the stages with a cloud bulge: the Wave stage and the Intensification stage. In these stages the convective rain appears more in the transition region between cold front and the wave bulge. In the stages with occlusion cloud spirals, the Mature stage and the Dissipation stage, rainfall intensity decreases overall and the convective rainfall is concentrated on the inner part of the occlusion spiral.