Typical Appearance In Vertical Cross Sections
Vertical cross sections provide a very interesting insight into the processes over the whole troposphere. To investigate cyclogenesis, they are most usefully located across the cloud bands and oriented in direction of the movement of the cloud systems. The schematic below shows the general relationship between cloud bands and the vertical cross section (VCS) line in the four development stages of Polar-Front-type cyclogenesis.
The four development stages in cyclogenesis of the Polar-Front type are:
- Wave stage
- Intensification stage
- Mature stage
- Dissipation stage
The main characteristics of the key parameters in VCSs, and their changes, during these four development stages are described here. More details are described in the relevant individual CMs.
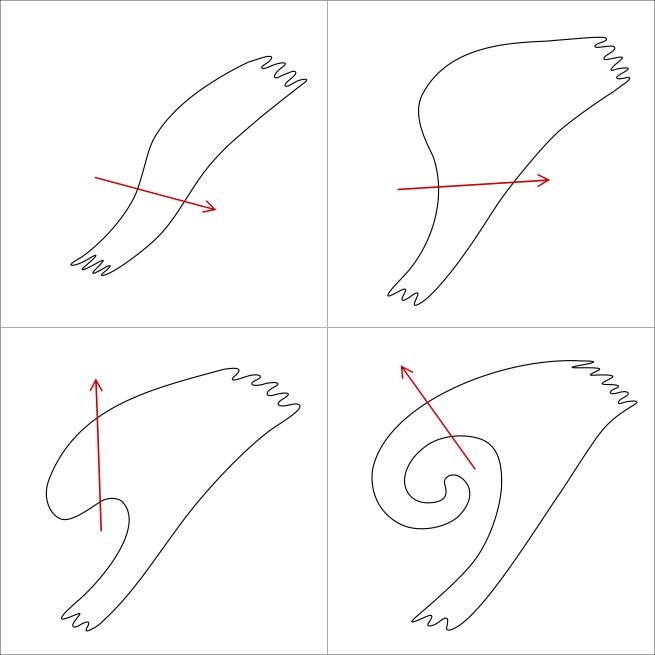
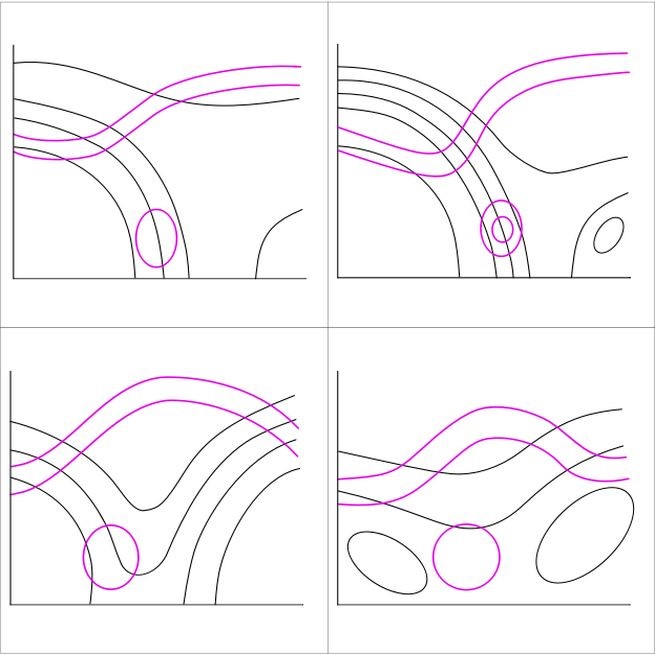
Legend: Schematics of cloud configurations and typical locations of the vertical cross section line.
To demonstrate the schematically "ideal" vertical cross sections, the same case is used as in previous chapters, from 20 to 22 February 2021. However, to best illustrate the Dissipation stage, a later time is chosen to represent this.
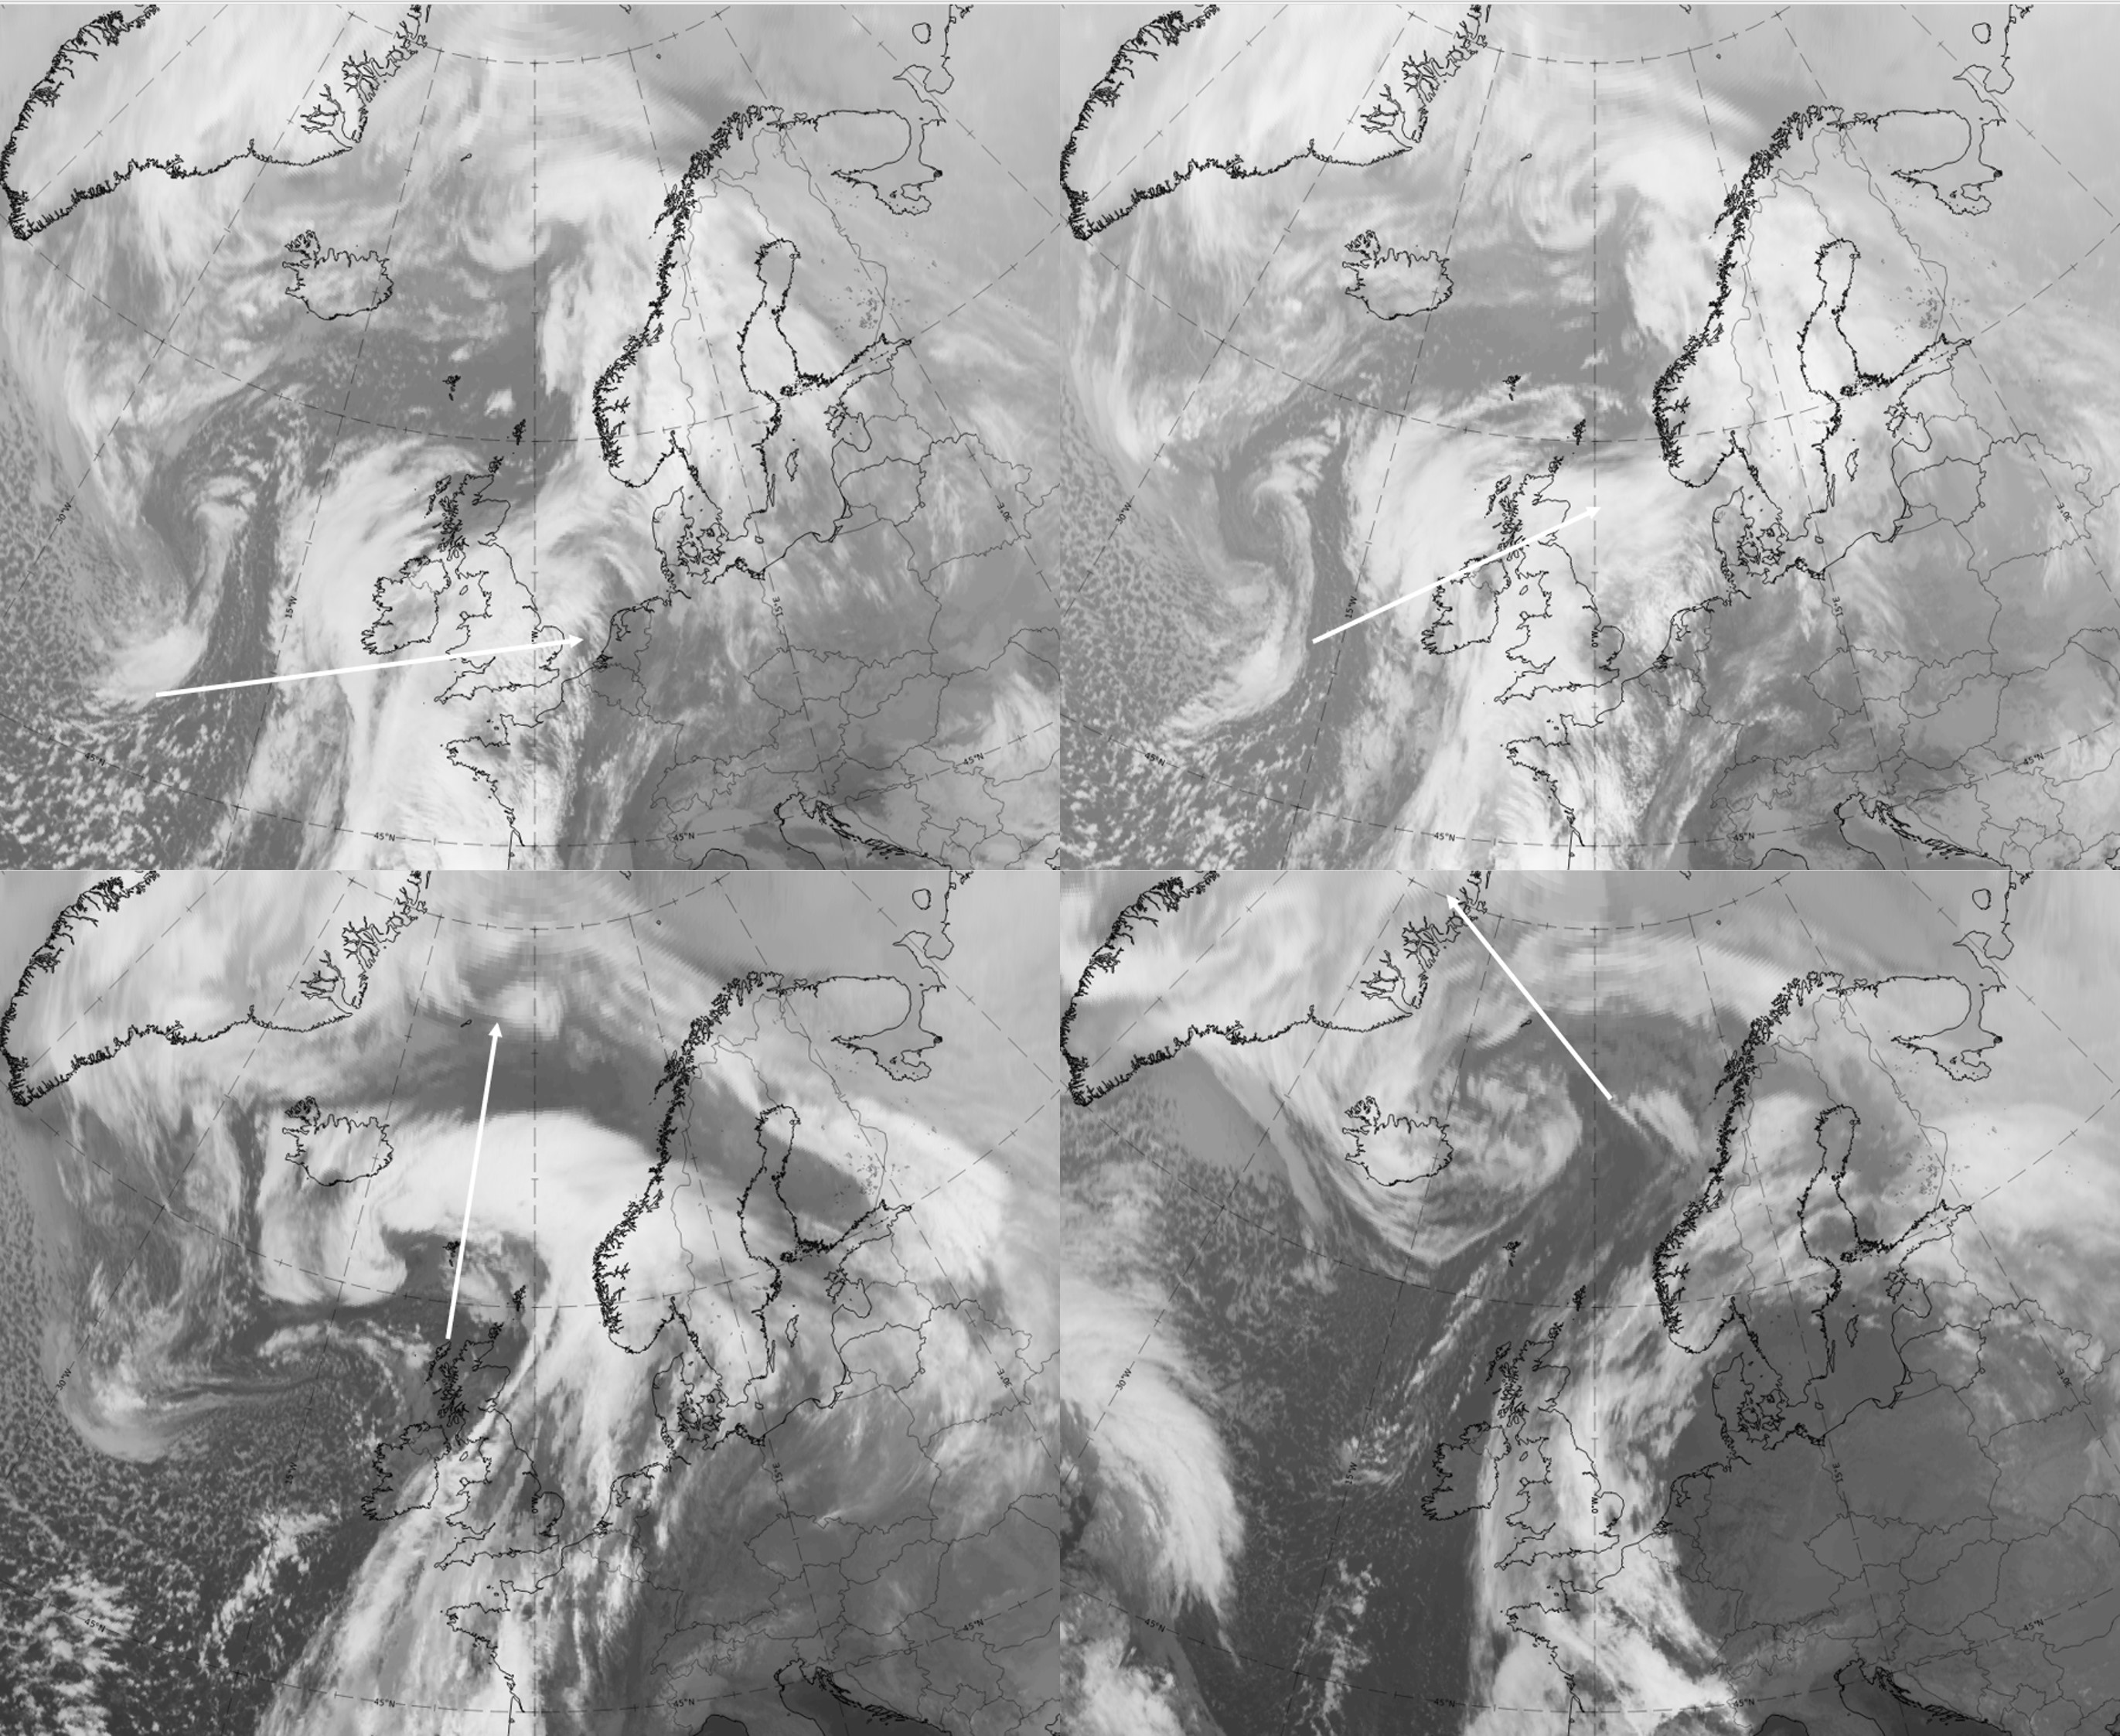
Legend: 20-22 February 2021, IR.
U.l.: 9 UTC on 20 February 2021, Wave stage; u.r.: 12 UTC on 20 February 2021, Intensification stage; 00 UTC on 21 February 2021, Mature stage; 00 UTC on 22 February 2021, Dissipation stage.
Note: To enlarge the image, click on it.
Idealised configurations of key parameters in vertical cross sections
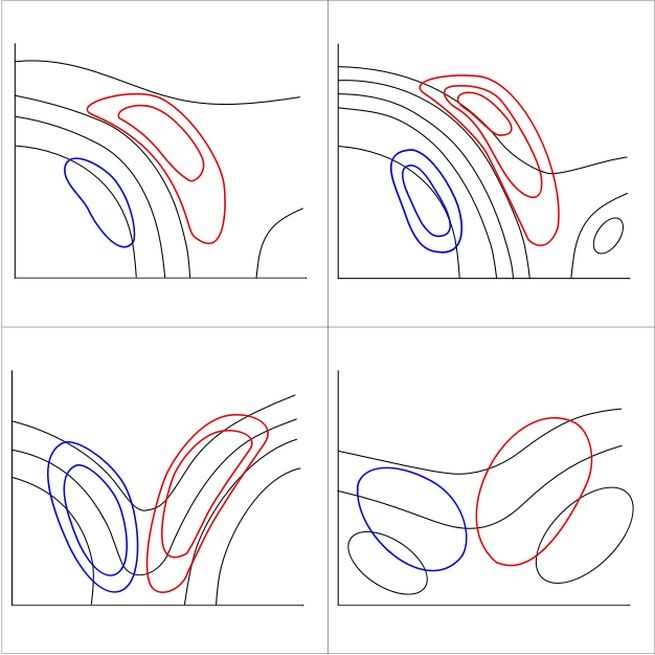
- Equivalent potential temperature, ThetaE: (Humid) isentropes
- In the Wave stage, the vertical cross section shows the typical appearance of a cold front: a dense region of downward inclined isentropes with unstable cold air below the frontal surface. Often, there is also some unstable air also ahead of the frontal surface and a distinct upper-level cold front ahead of the main cold front surface.
- In the Intensification stage, the main structures are very similar but the gradient is increasing.
- In the two stages with occlusion cloud spirals, the Mature stage and the Dissipation stage, the main feature is a distinct trough in the isentropes, which indicates warm air aloft. The boundaries between two airmasses at the front and at the rear of the occlusion band can be recognised by the frontal gradients.
- In the early part of the Dissipation stage, the isentropic trough and the frontal surfaces at the boundary are mostly still fully formed, whereas later in this stage the configurations dissipate.
- Relative humidity
- In all four development stages, high values of relative humidity indicate the thick cloudiness of the cloud bands. In the Wave stage and the Intensification stage, the area of high humidity is bent back on the frontal surfaces. In most cases, the upper-level cold front is also accompanied by high values of relative humidity.
- Very high relative humidity is also present in the two stages with occlusion cloud spirals, indicating a thick cloud band. It fills the area of the isentropic trough completely and is also upward inclined above the frontal boundaries. Later, in the Dissipation stage, clouds within relatively humid areas can become narrower and lower as they dissipate.
- Vertical motion (Omega)
- Cloud bands and spirals are accompanied by strong upward motion. This is especially so in the stages with occlusion spirals.
- In the Dissipation stage, in the beginning strong upward motion still exists, but becomes weaker and weaker towards the end of this stage.
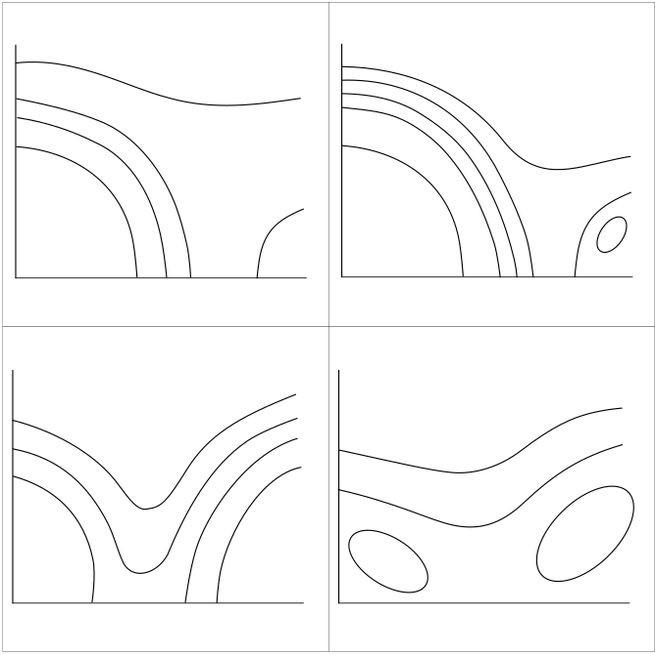
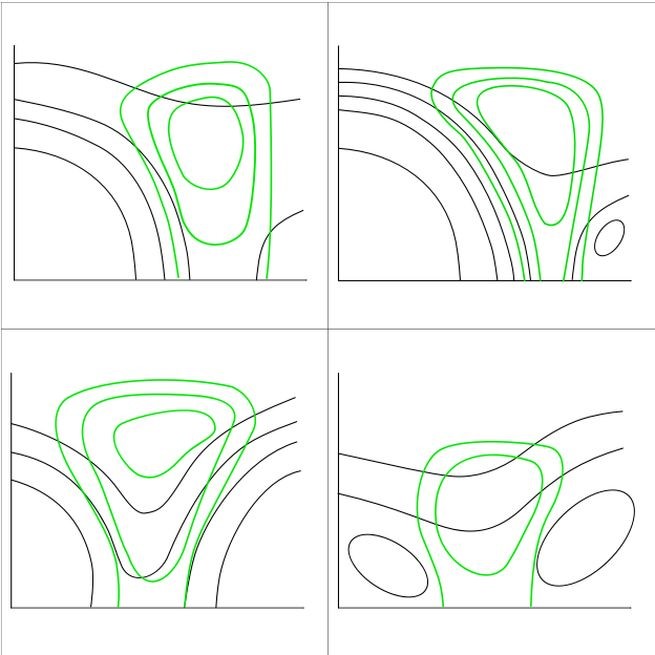
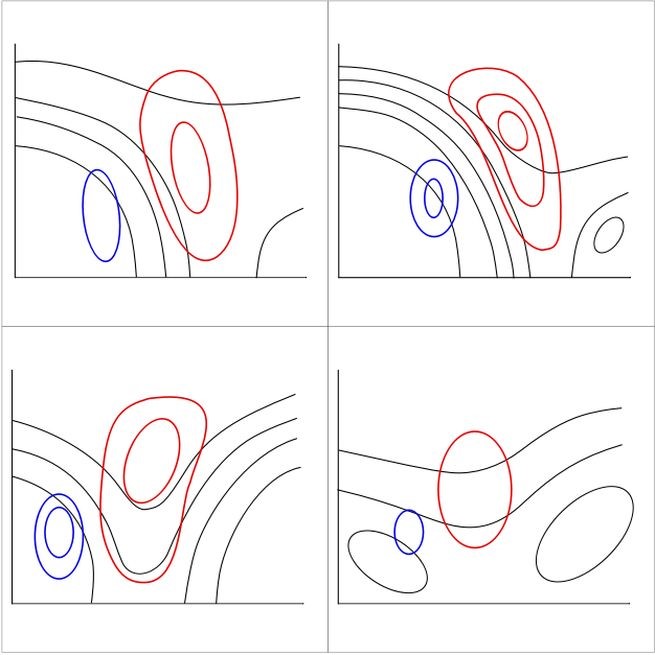
Legend: Schematics of ThetaE, relative humidity and omega for the four stages of development.
U.l.:(humid) isentropes (black); u.r.: relative humidity (green); l.l.: Omega (upward in red an downward in blue).
Note: To enlarge the images, click on them.
|
|
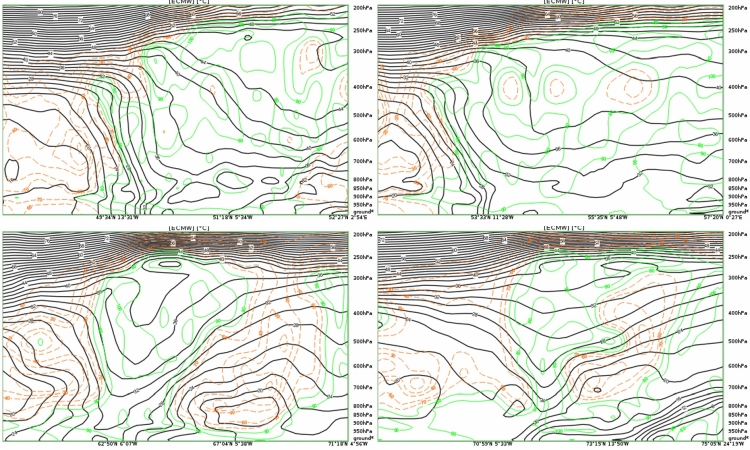
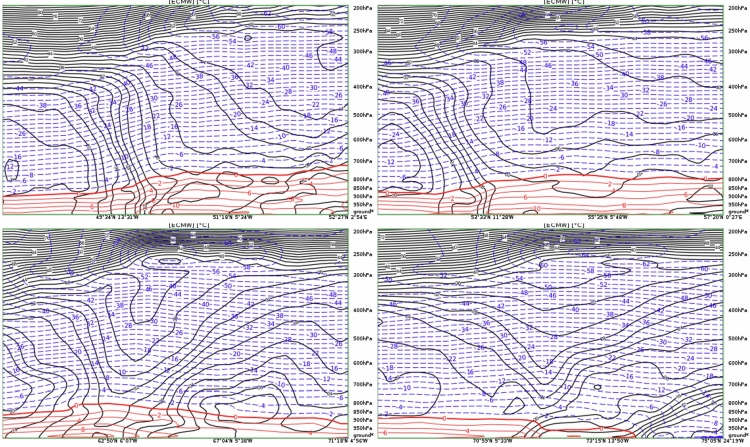
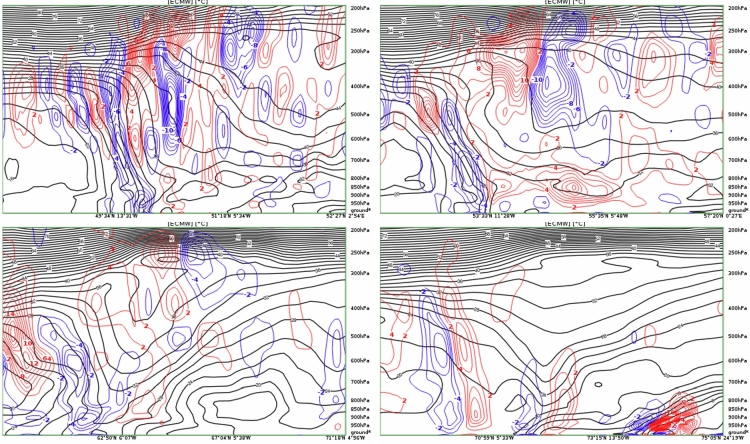
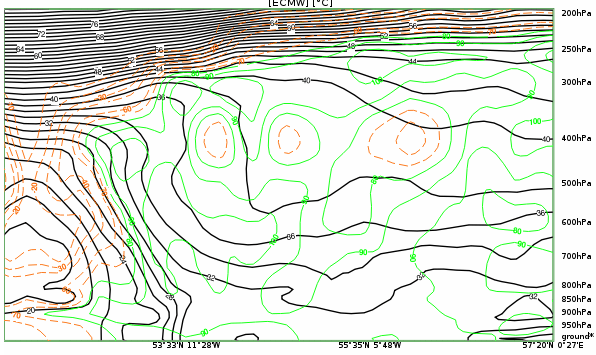
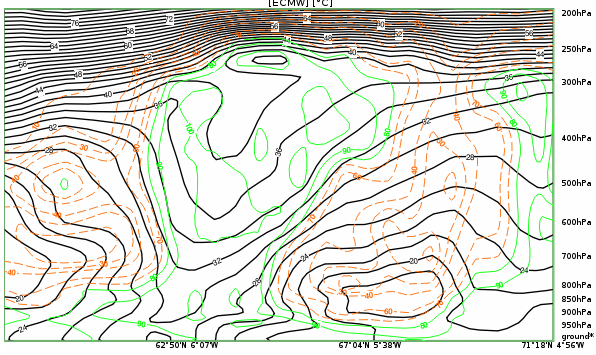
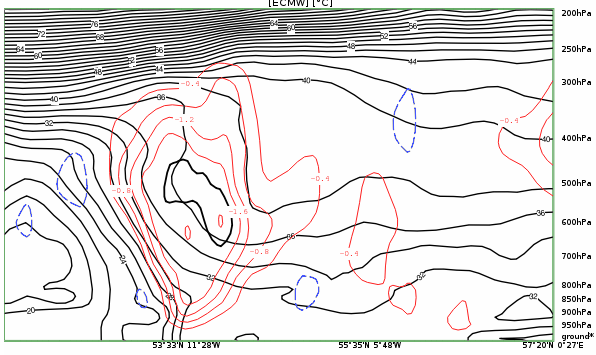
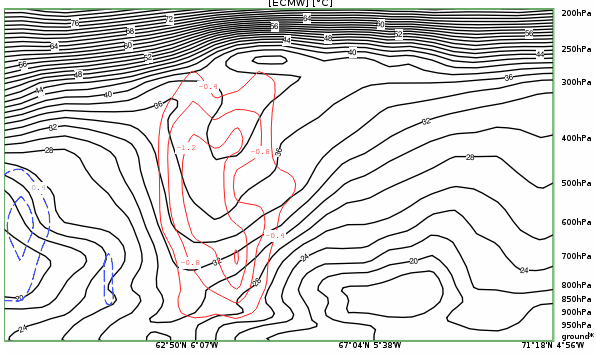
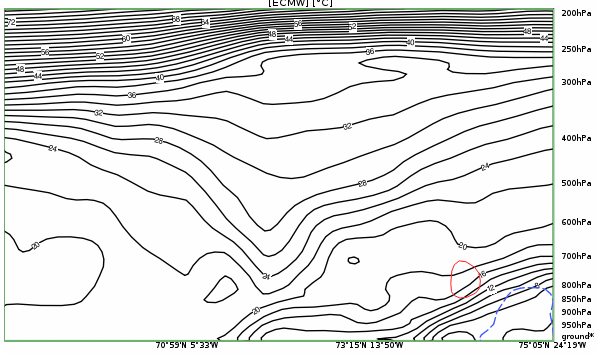
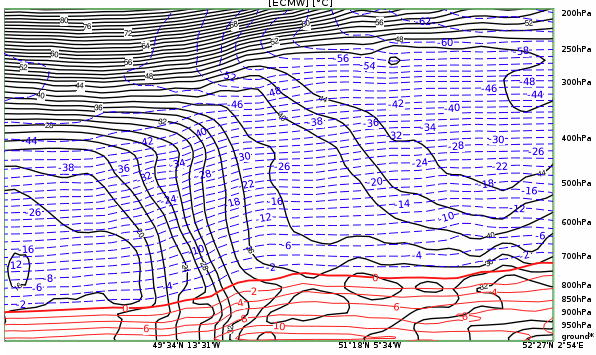
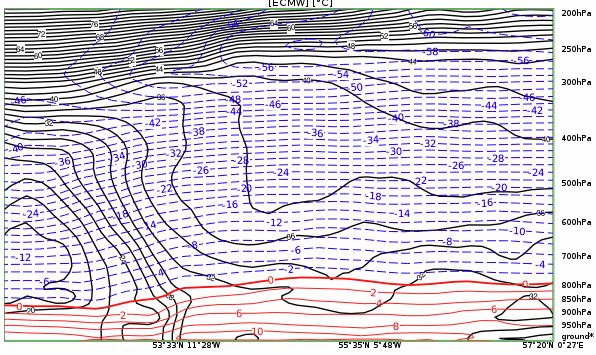
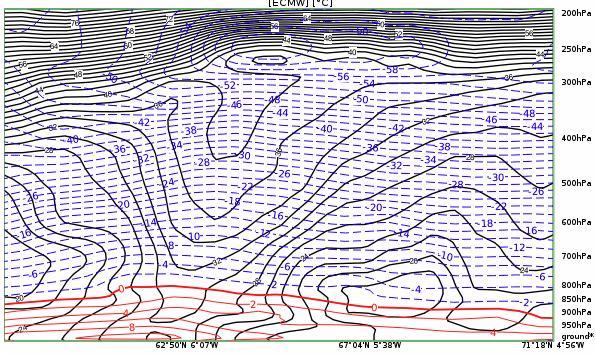
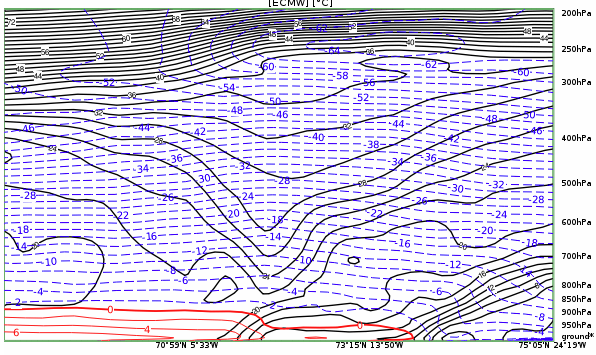
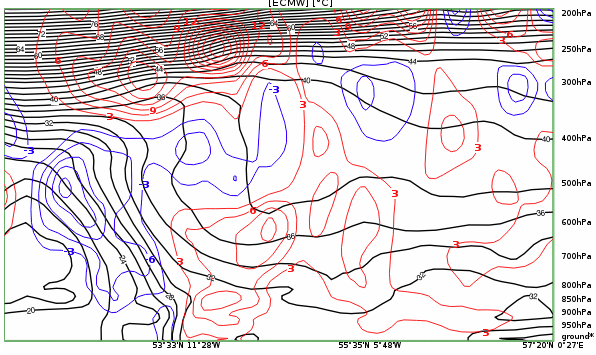
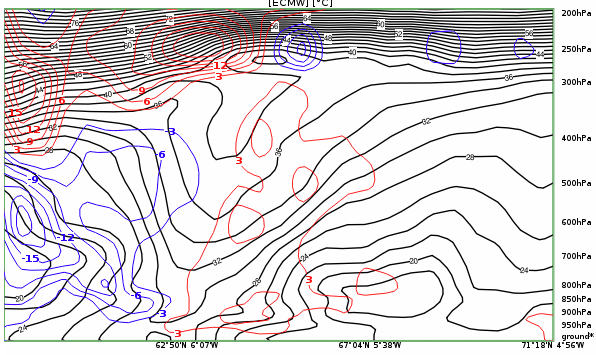
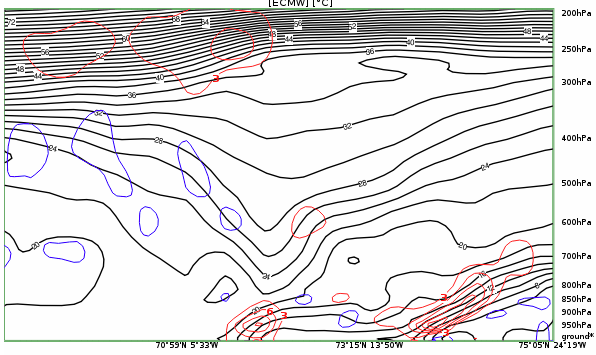
Legend: 20-22 February 2021, Vertical cross sections. IR.; u.: isentropes (black), relative humidity (green); l.: upward motion (red), downward motion (blue).
U.l.: 9 UTC on 20 February 2021, Wave stage; u.r.: 12 UTC on 20 February 2021, Intensification stage; 00 UTC on 21 February 2021, Mature stage; 00 UTC on 22 February 2021, Dissipation stage.
Note: To access the gallery of individual images click here
Typical features of equivalent potential temperature, relative humidity and vertical motion and their changes observed in the show case are:
- The Wave and Intensification stages show the typical downward inclined zone of high gradients in the isentropes; the rather broad frontal zone in the Wave stage (representing, as discussed in the previous chapter, two systems) becomes narrower with a sharper gradient in the Intensification stage.
- Upward motion increases strongly from the Wave stage to the Intensification stage.
- The Mature stage, with a well-developed occlusion band, shows a distinct isentropic trough indicating the lifted warm air, while this isentropic trough becomes much smaller and narrower in the Dissipation stage.
- The same is true for upward motion, which is very strong in the Mature stage and very weak in the Dissipation stage.
- While relative humidity is high in the cloud bands during all stages, the dry air typical of the cold region behind the front is represented by low values of relative humidity.
- Temperature
- The most recognisable feature in the isotherms is a distinct rise across the frontal surface, typical for a cold front, in both the Wave stage and the Intensification stage. Often there is a second smaller rise at the upper-level frontal surface ahead of the main front.
- During the stages with occlusion spirals, isotherms follow a ridge within the centre of the occlusion and correspondingly rise and fall at the boundaries. This signals the warm lifted air.
- Temperature advection
- In the Wave stage and the Intensification stage, the distribution of temperature advection is typical for cold fronts: warm advection in the rising air above the frontal surface and cold advection in the sinking air below the frontal surface.
- In the stages with occlusion spirals, the typical process of rising warm air is represented by the area of warm advection in the cloud spiral and cold advection in the south-eastern part of the cloud spiral, where the cold air from the rear is advected into the centre of the spiral.
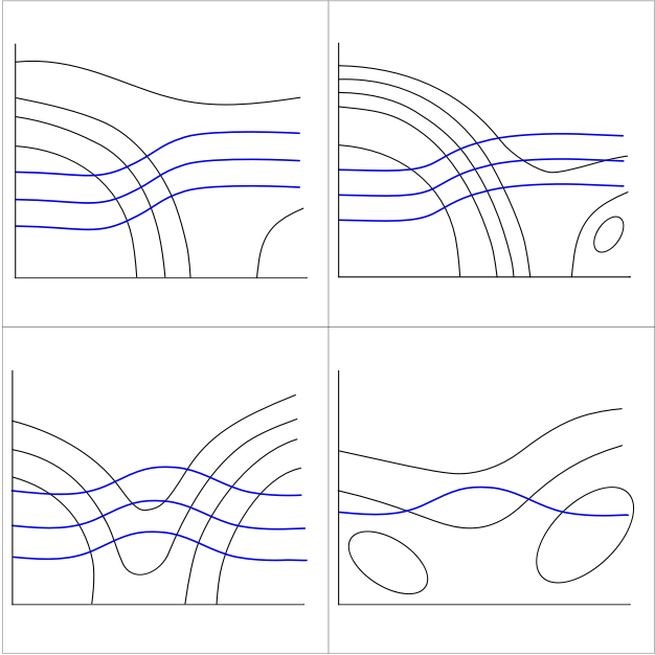
Legend: Schematics of temperature and temperature advection for the four stages of development.
L.: (humid) isentropes (black), temperature at 850 hPa (blue); r.: (humid) isentropes (black), temperature advection at 850 hPa (warm advection in red, cold advection in blue).
Note: To enlarge the images, click on them.
|
|
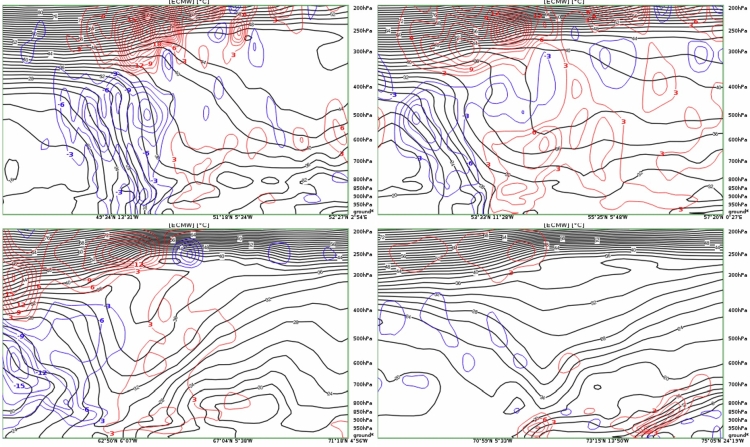
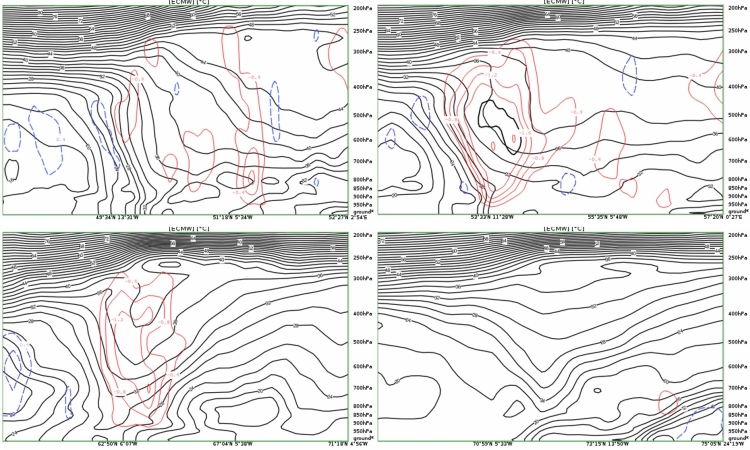
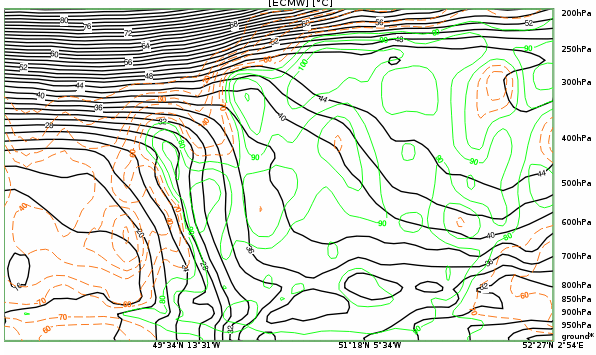
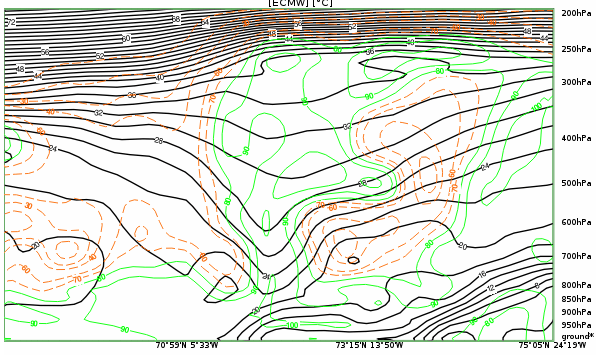
Legend: 20-22 February 2021, Vertical cross sections. IR; u.: isentropes (black), blue: temperature at 850 hPa (blue); l.: temperature advection at 850hPa (warm advection in red, cold advection in blue).
U.l.: 9 UTC on 20 February 2021, Wave stage; u.r.: 12 UTC on 20 February 2021, Intensification stage; 00 UTC on 21 February 2021, Mature stage; 00 UTC on 22 February 2021, Dissipation stage.
Note: To access the gallery of individual images click here
Typical features of temperature and temperature advection fields in VCSs demonstrated by the case from 20 to 22 February 2021 are:
- Isotherms rise across the frontal zone in the Wave and Intensification stages.
- A temperature ridge occurs in the Mature and Dissipation stages.
- There is very strong cold advection below the frontal surfaces in the Wave and Intensification stages, as well as an intensification of warm advection in the Intensification stage.
- In the Mature stage, warm advection can be found in the area of the occlusion cloud band, and cold advection in the low centre in the cloud-free part of the spiral.
- From the Mature stage to the Dissipation stage, both warm and cold advection significantly decrease, demonstrating that the occlusion development has come to an end and dissipation has started.
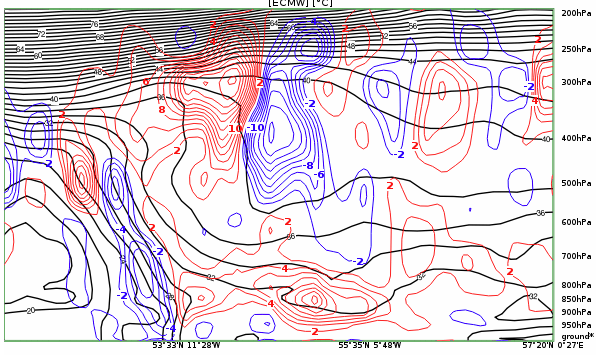
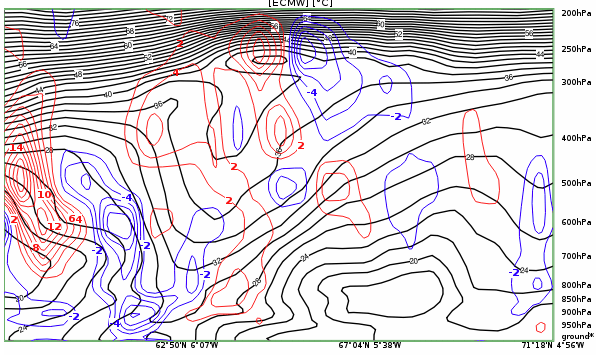
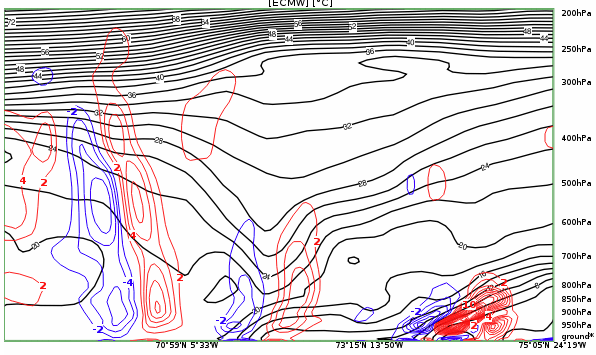
- Wind speed (isotachs) and vorticity advection
- Maxima of cyclonic vorticity advection (CVA maxima) at high levels are connected to shear vorticity (in the jet streak) and curvature vorticity (in the upper-level trough). Large numbers of case studies have shown that looking at the distribution of CVA maxima in a VCS can be very confusing and it changes from case to case. CVA maxima accompany every small-scale cyclonic vorticity variation, and are not always of central synoptic importance.
- There is, however, a most common location for a CVA maximum at high levels:
In the Wave and Intensification stages this is the rear side of the frontal zone and in the Mature and Dissipation stages it is the inner side of the occlusion spiral. - In well-developed occlusion systems, a CVA maximum very often also appears at low levels. It is weaker than that in upper levels and it indicates a deepening and moving surface low.
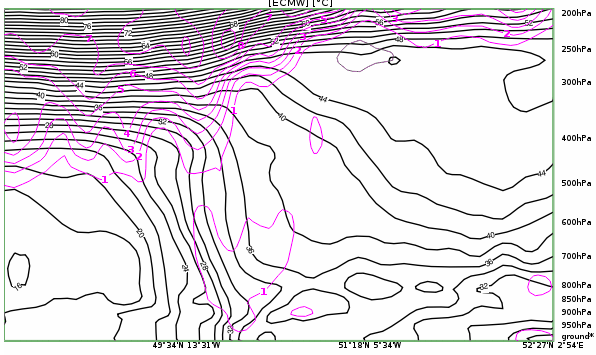
- Potential vorticity
- The Wave stage and the Intensification stage are characterised by two main features: the tropopause folding at the frontal surface, with a protrusion of stratospheric air downward below the frontal surface into the troposphere, and the intensification of potential vorticity in lower layers by a mutual strengthening of the vorticity rotation.
- By the Intensification stage, a tube (tunnel) of PV has often developed.
- In the stages with occlusion cloud spirals, the Mature and the Dissipation stages, the main features are: low tropopause heights at the boundaries of the occlusion cloud spiral, a high tropopause within the occlusion cloud spiral bands, and very often an area of increased PV at lower layers close to the inner boundary (increased PV values in the lower part of the PV tunnel).
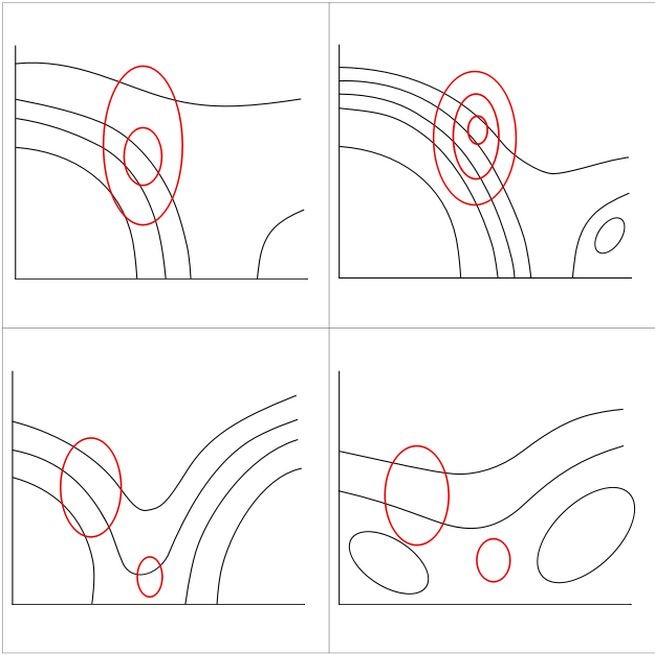
Legend: Schematics of vorticity advection and height at which PV is >=1.5 PVU for the four stages of development.
L.: (humid) isentropes (black); vorticity advection (cyclonic in red, anticyclonic in blue); r.: (humid) isentropes (black); magenta: height at which PV is >=1,5 PV units.
Note: To enlarge the images, click on them.
|
|
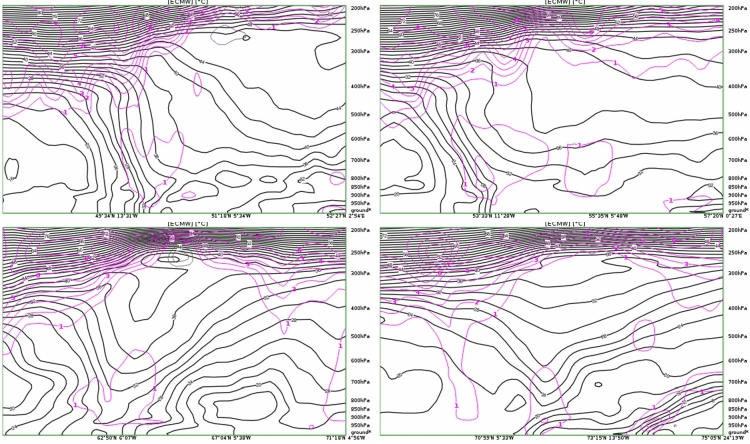
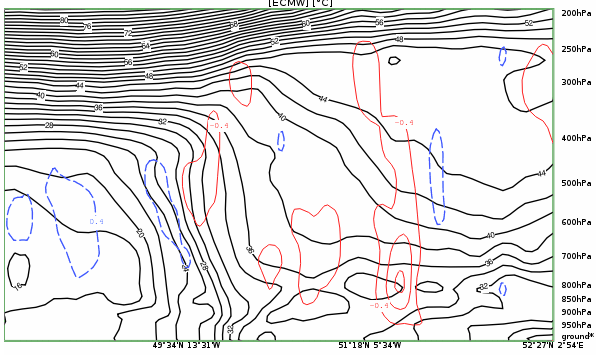
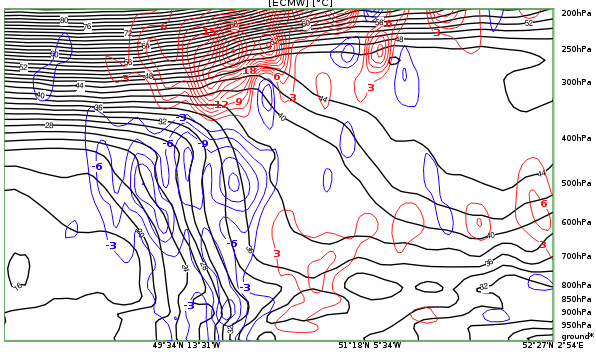
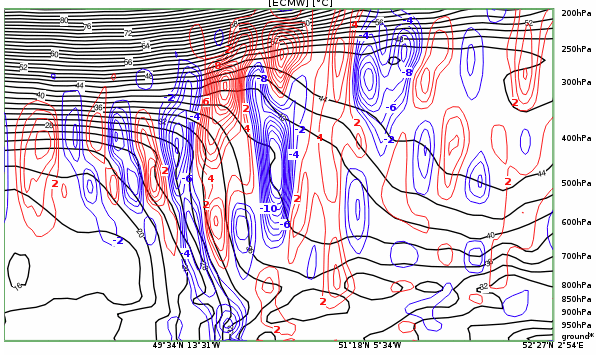
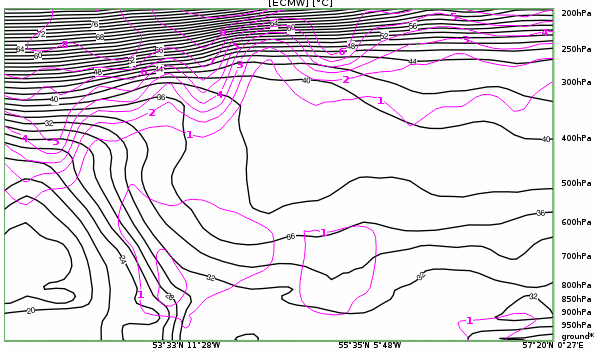
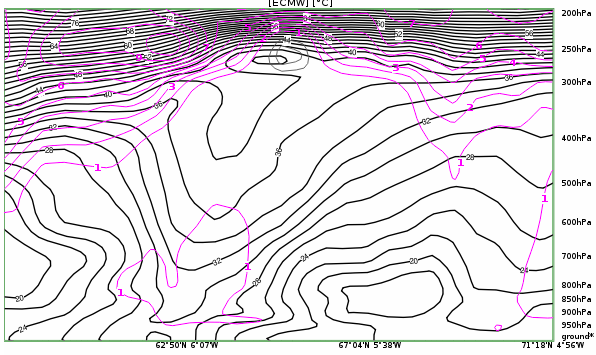
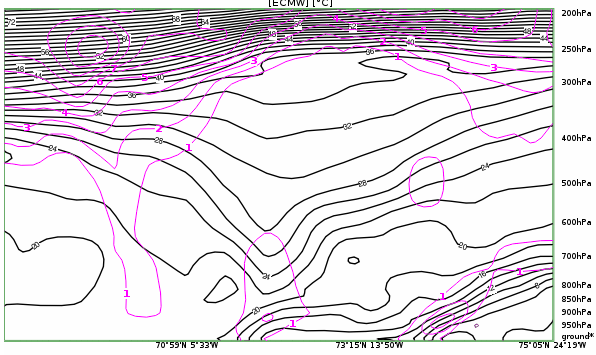
Legend: 20-22 February 2021, IR. Vertical cross sections.
Above: isentropes (black), vorticity advection (cyclonic in red, anticyclonic in blue); Below: Height of PV >= 1.5 PVU (magenta).
U.l.: 9 UTC on 20 February 2021, Wave stage; u.r.: 12 UTC on 20 February 2021, Intensification stage; 00 UTC on 21 February 2021, Mature stage; 00 UTC on 22 February 2021, Dissipation stage.
Note: To access the gallery of individual images click here
As mentioned above, CVA has a complicated distribution with many maxima and minima at all levels. But some characteristic features can be found also in this demonstration case:
- In the Wave and Intensification stages, an initial double structure can be seen in upper levels, immediately behind the frontal zone of high isentropic gradients. This is indicated by arrows.
- In the Mature stage there are two maxima in the upper levels of the huge extended low centre.
- In both the Mature and Dissipation stages, a VA maximum in low layers intensifies and represents the centre of the low at the surface or low layers.
The PV height shows both the downward protrusion of stratospheric air (where PV > = 1.5 PVU) and the development of the cyclonic rotation at low levels.