Key Parameters
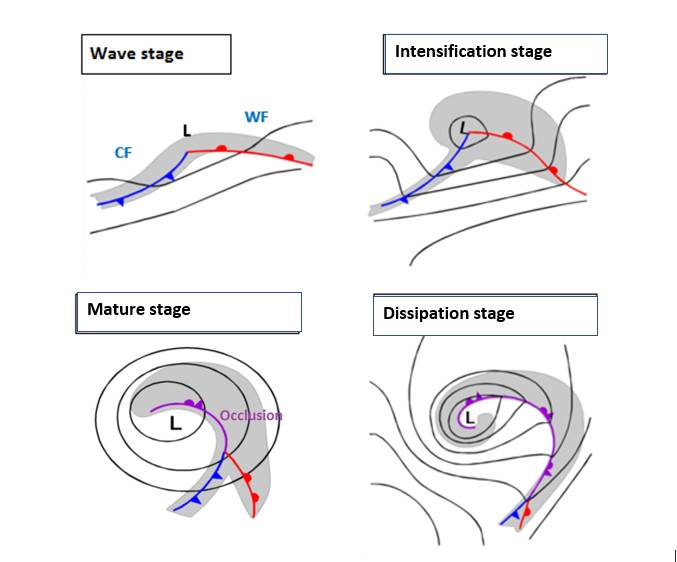
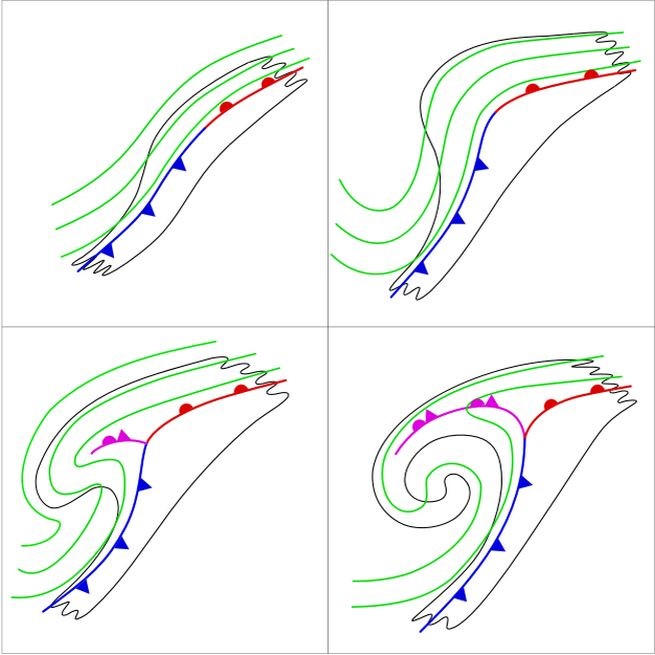
The four cyclogenesis development stages in a Polar Front Theory type are:
- Wave stage
- Intensification stage
- Mature stage
- Dissipation stage
The key parameters of a cyclogenesis process, according to the Polar Front Theory, are:
- Geopotential height at lower and upper levels.
- Thermal parameters (temperature and temperature advection at 850 hPa or 700 hPa, thickness between 1000 and 500 hPa and thermal frontal parameter TFP).
- Upper-level parameters (wind speed, cyclonic vorticity advection and potential vorticity).
The main characteristics and the changes in key parameters during the four development stages are shown and discussed here. For more details look at the relevant individual CMs.
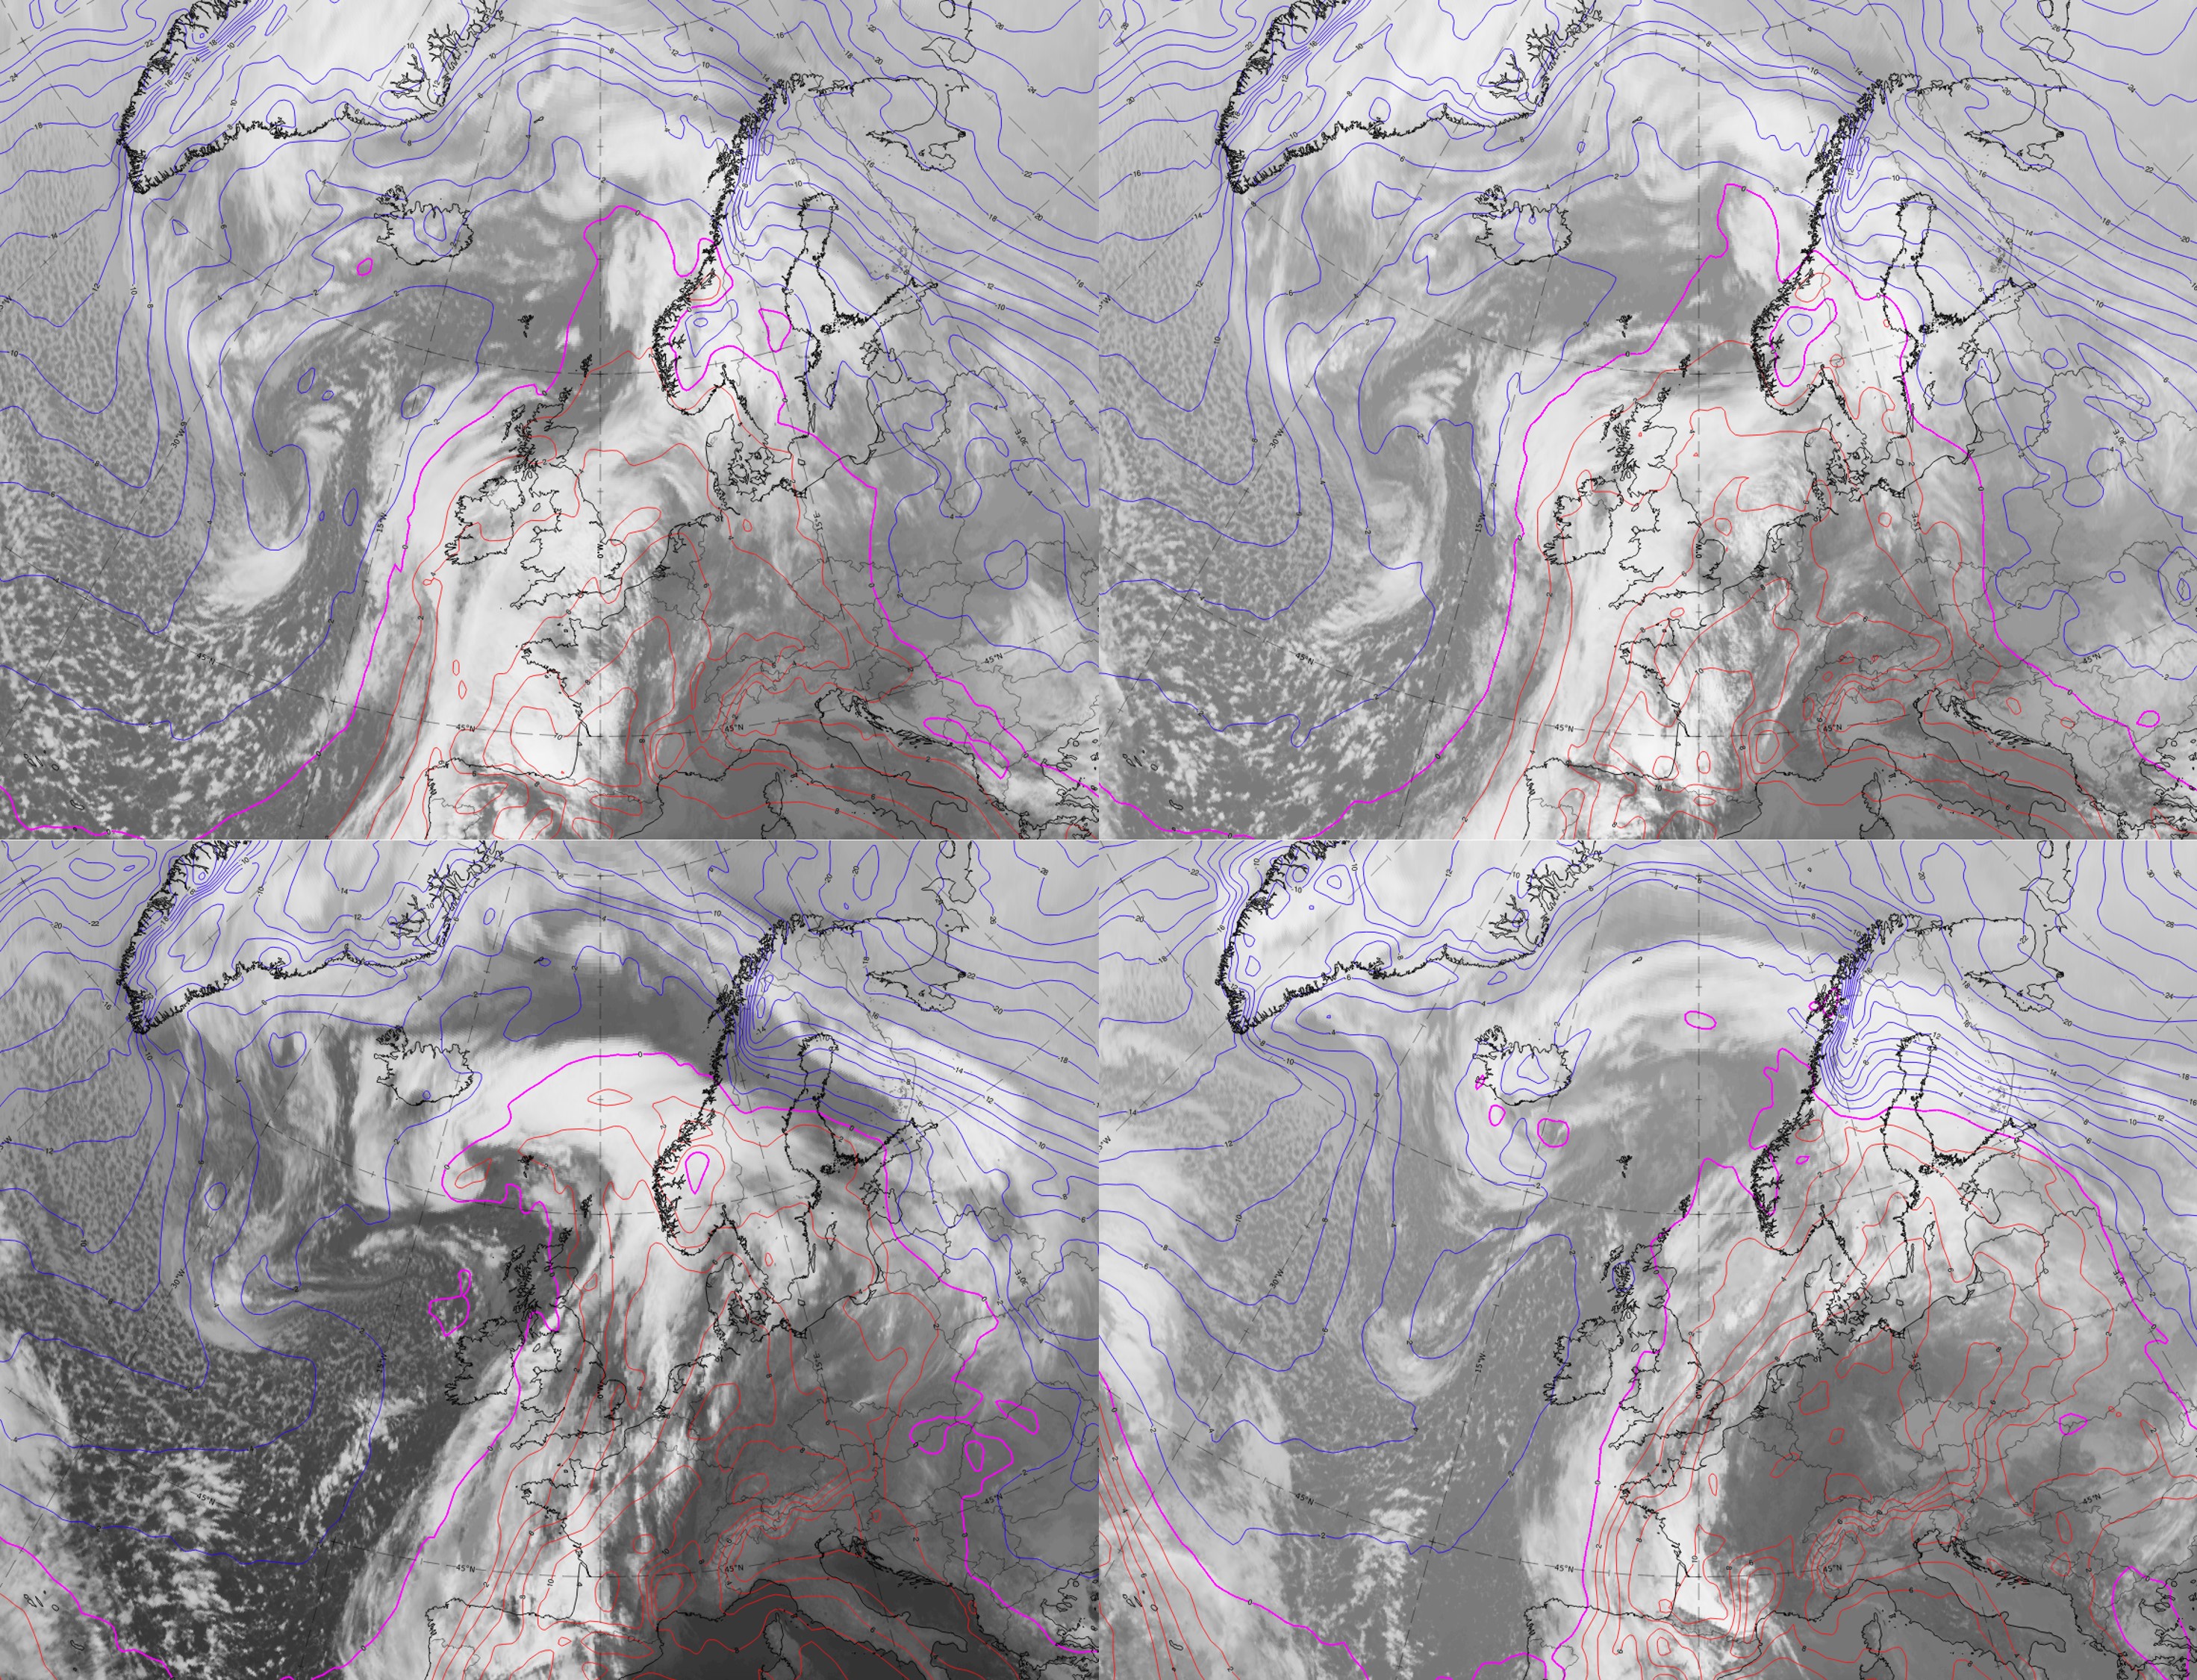
The typical behaviour of the key parameters is demonstrated here for an actual case from 20-21 February 2021.
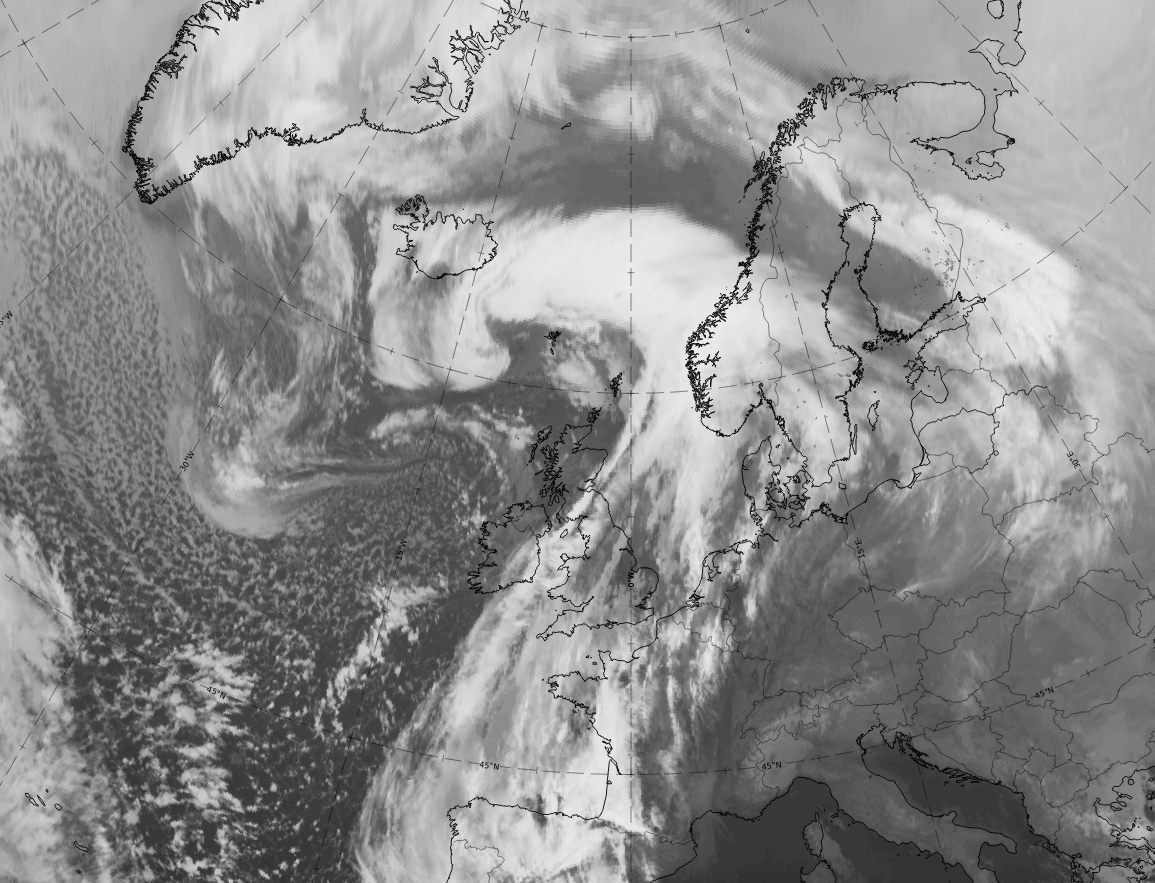
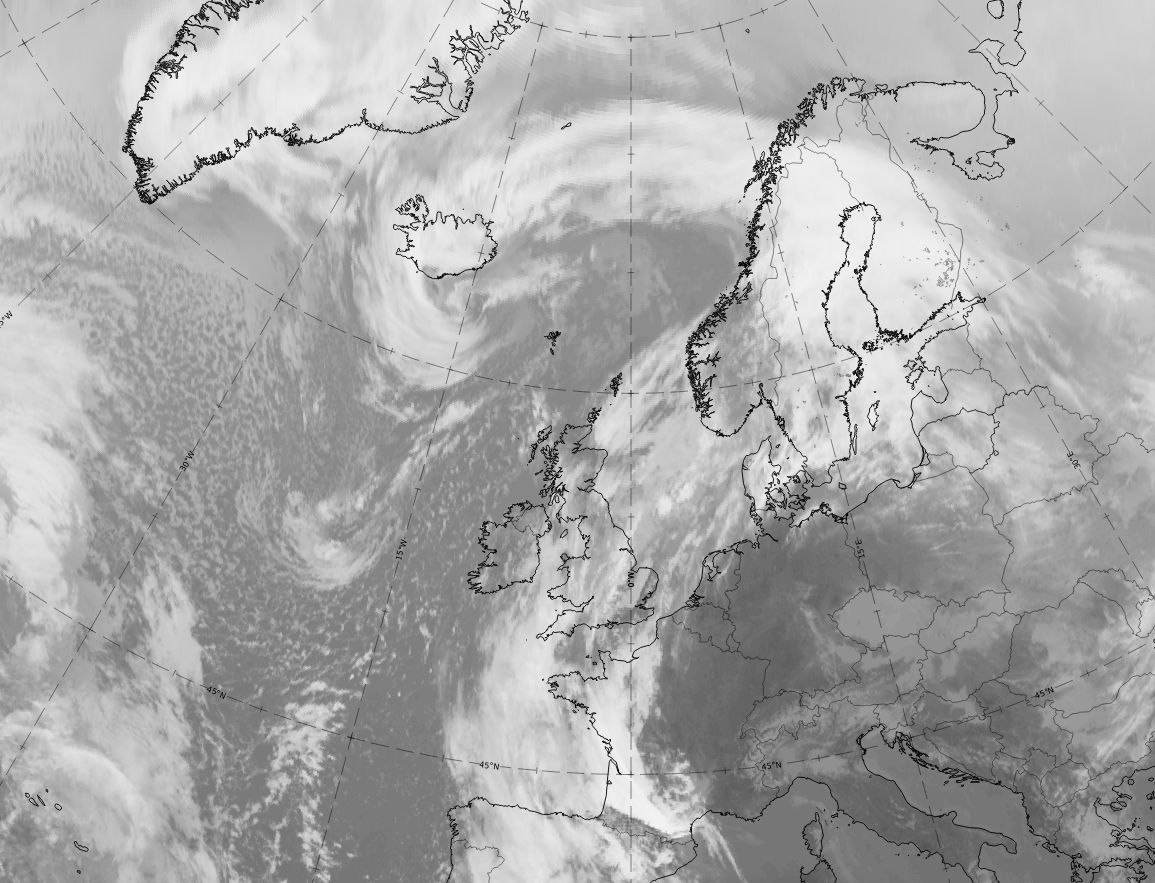
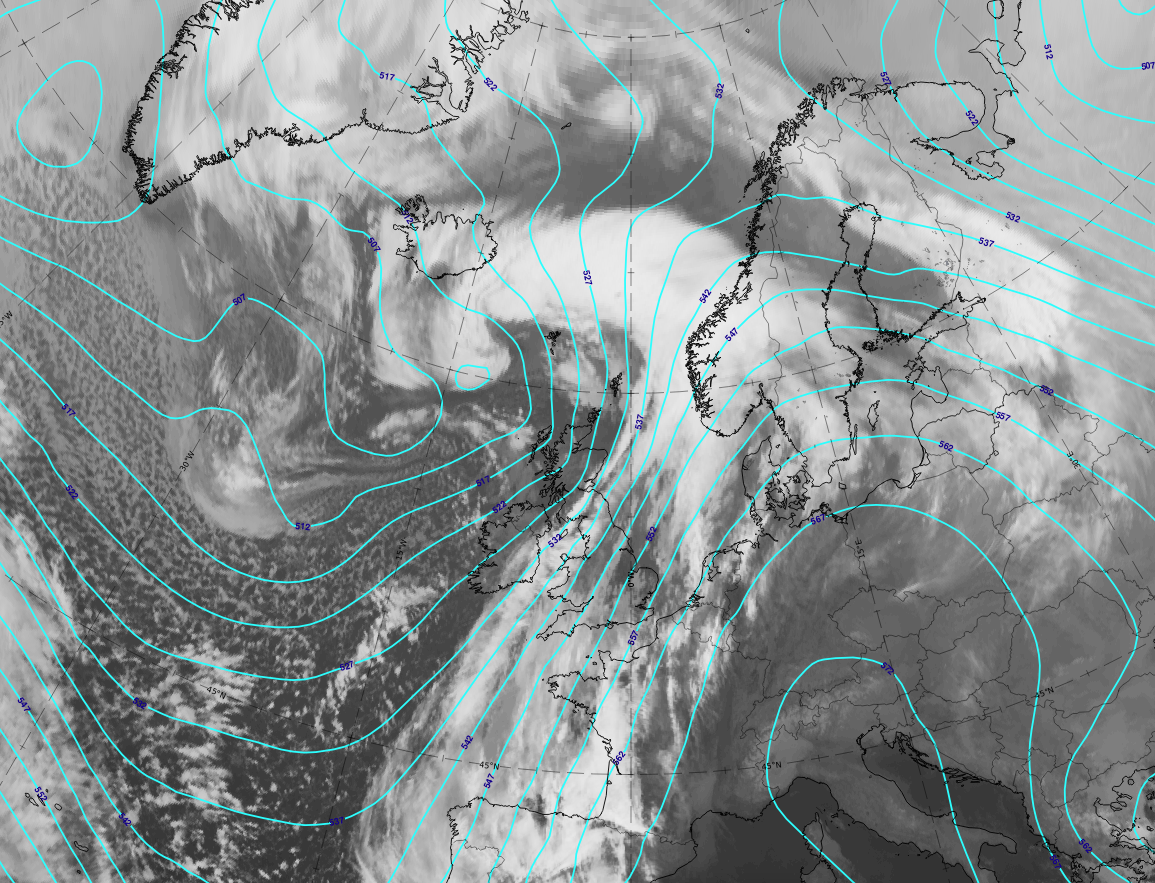
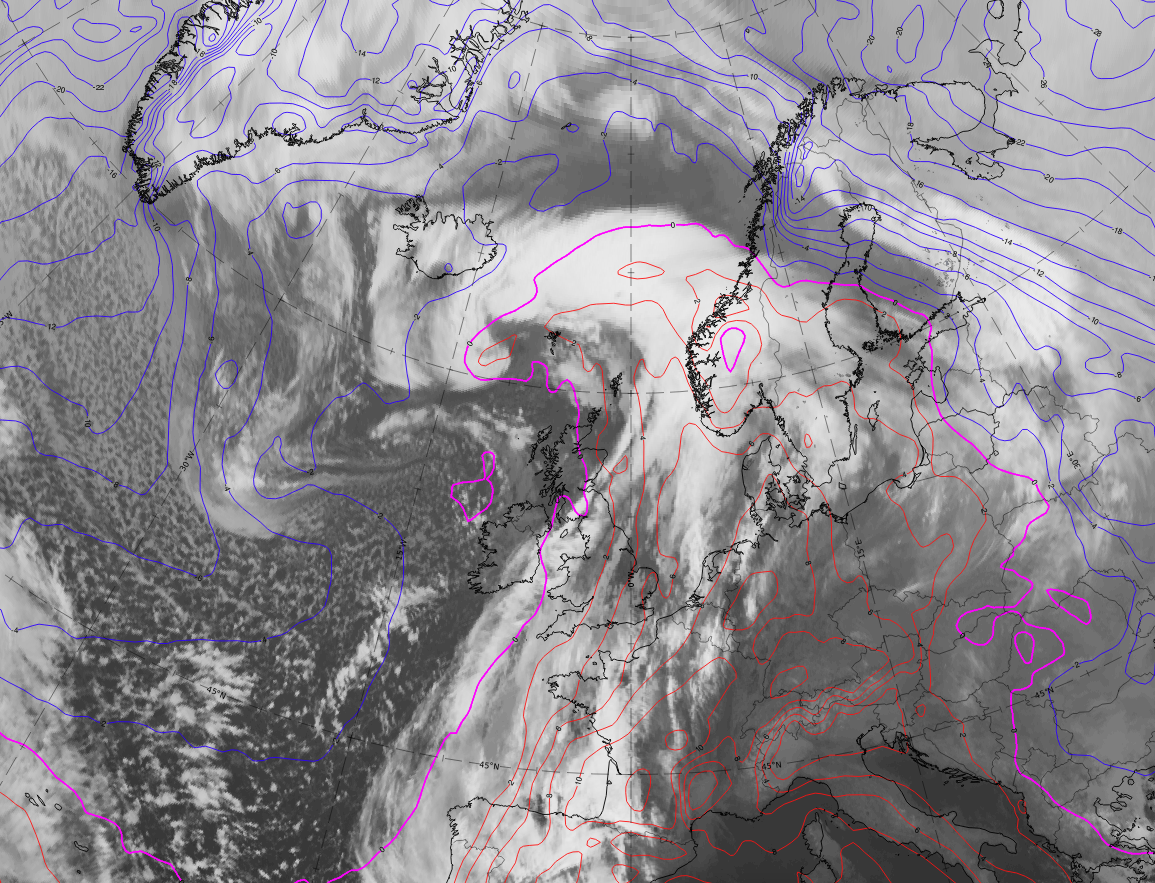
This case shows, in its first phase of the development, a feature not seen in every case and therefore not a typical cyclogenesis feature: a merging of two frontal systems. One is a broad cloud band extending from Spain across the British Isles into the North Sea and the other is a little further west over the Atlantic. The wave develops on the western system and its cloud configuration is fully developed at 09:09 UTC on 20 February 2021, when the mixing process between the two systems is nearly complete.
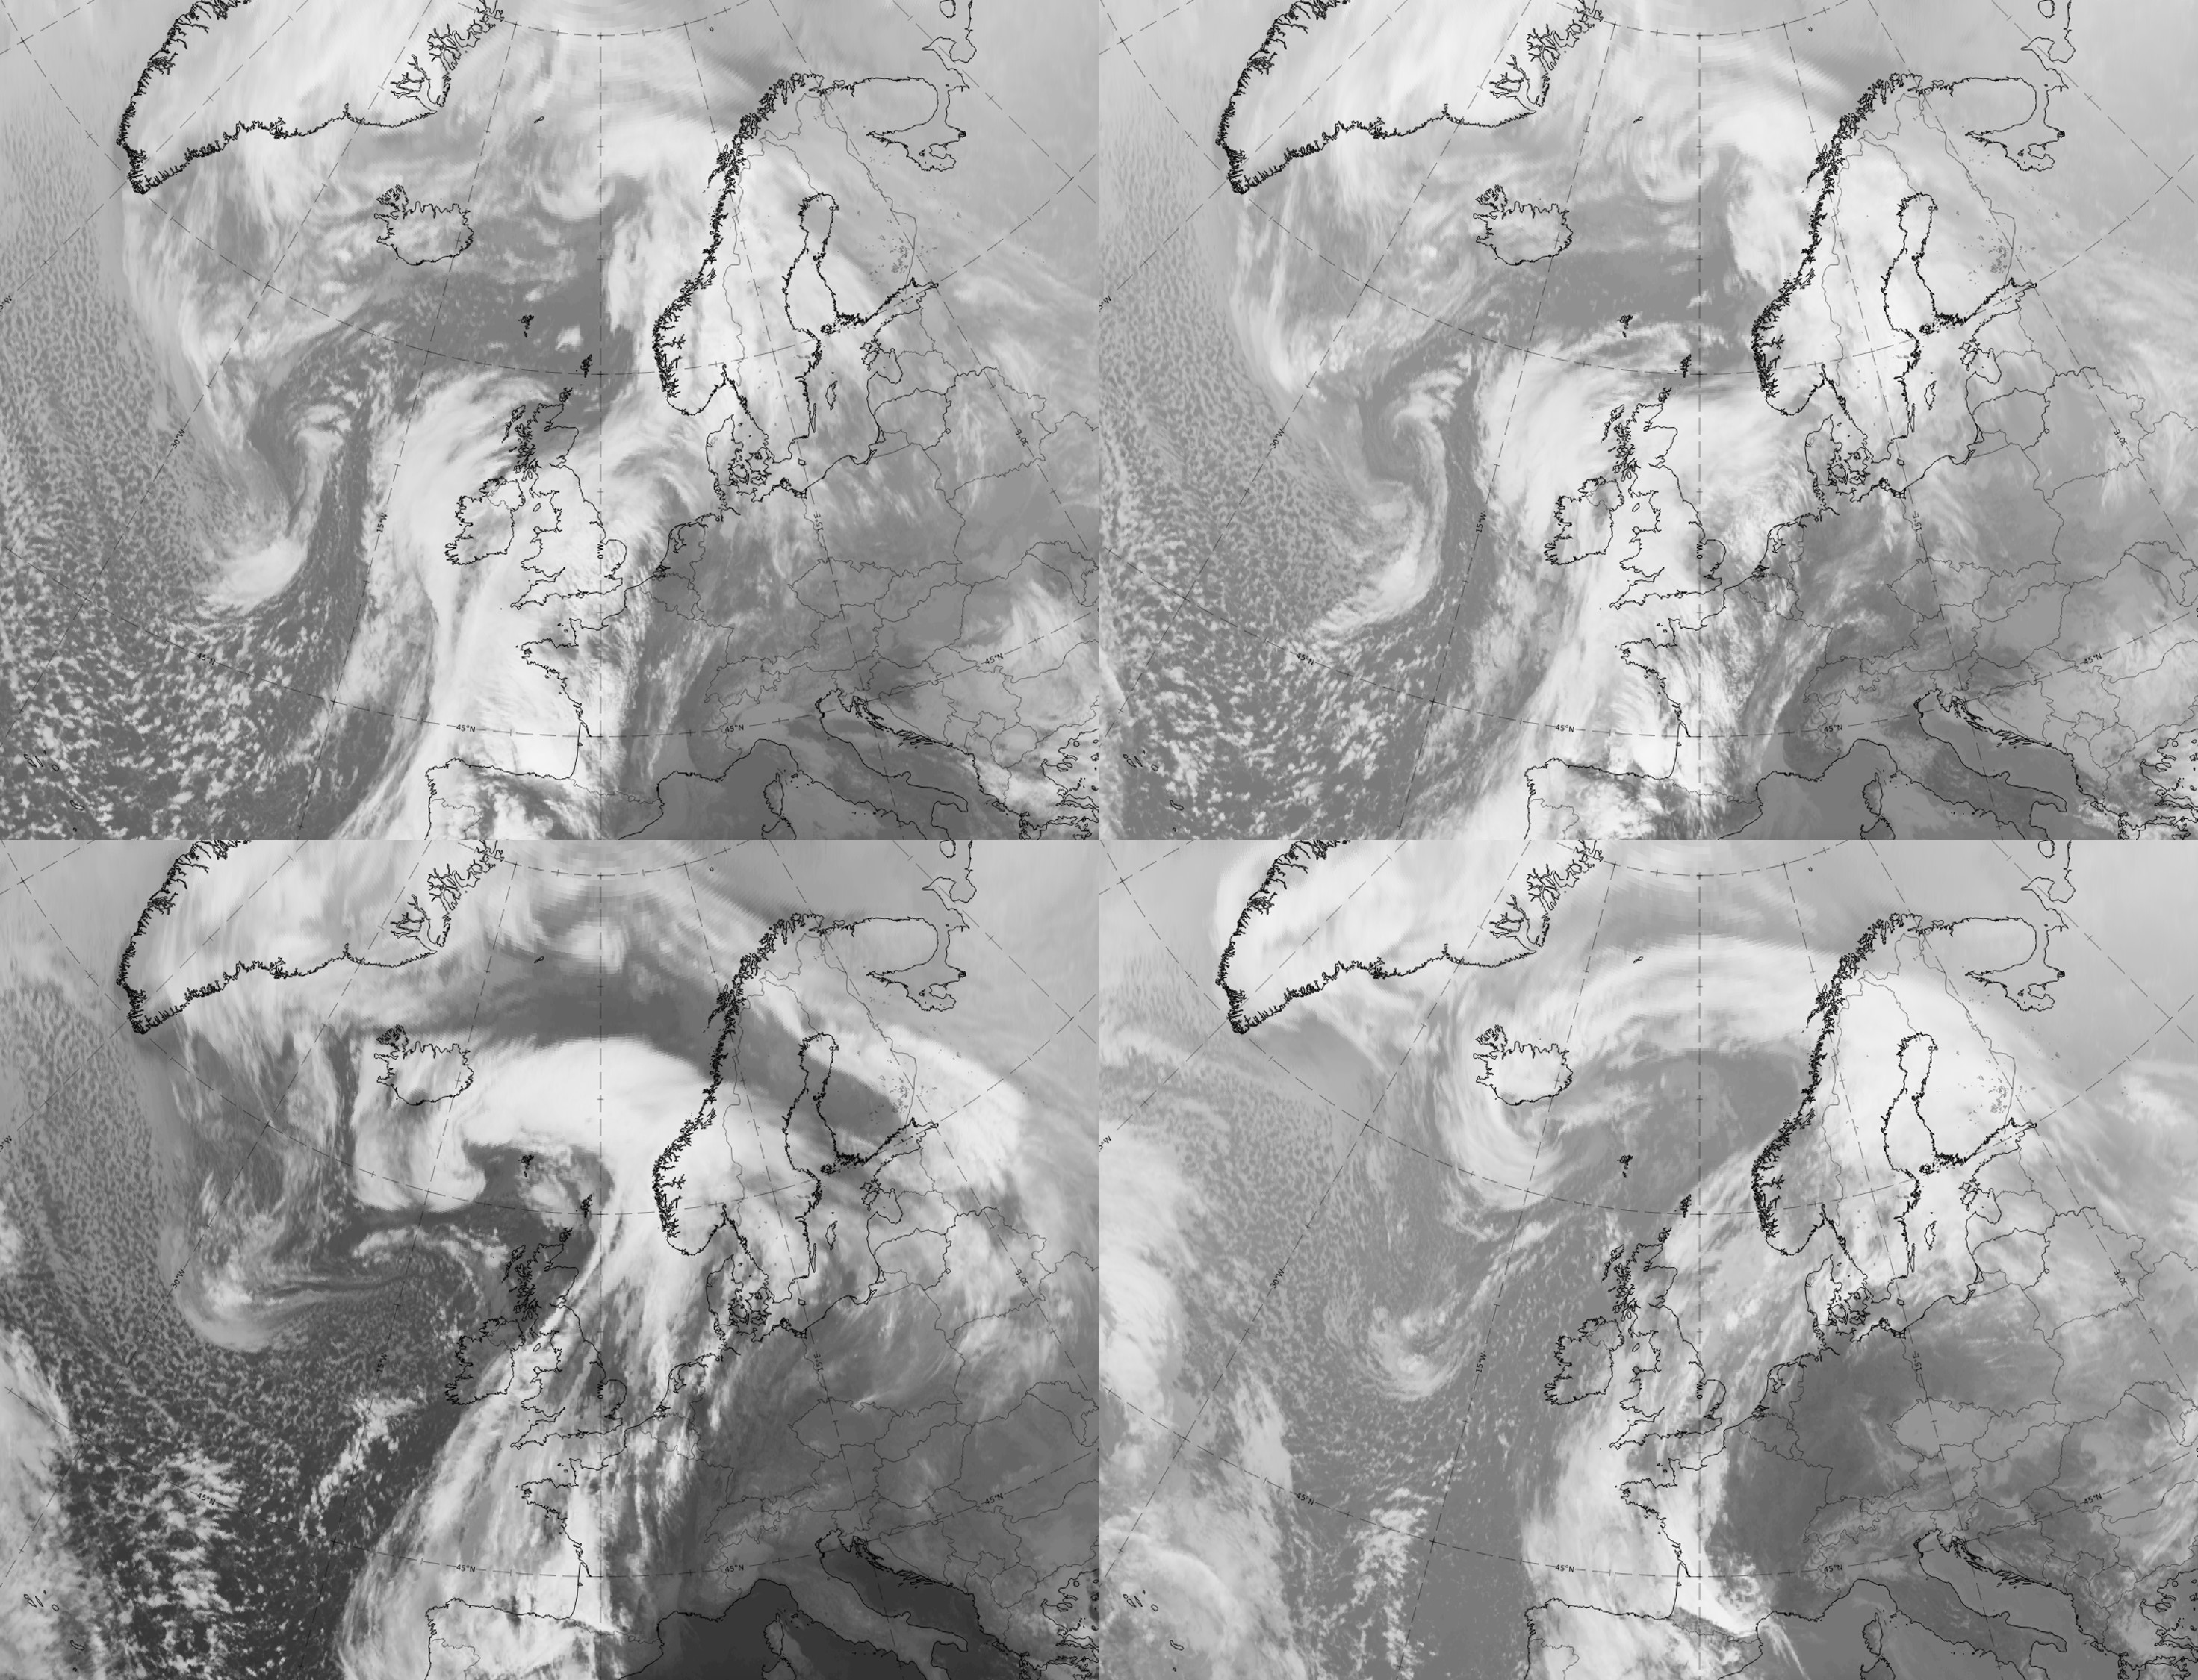
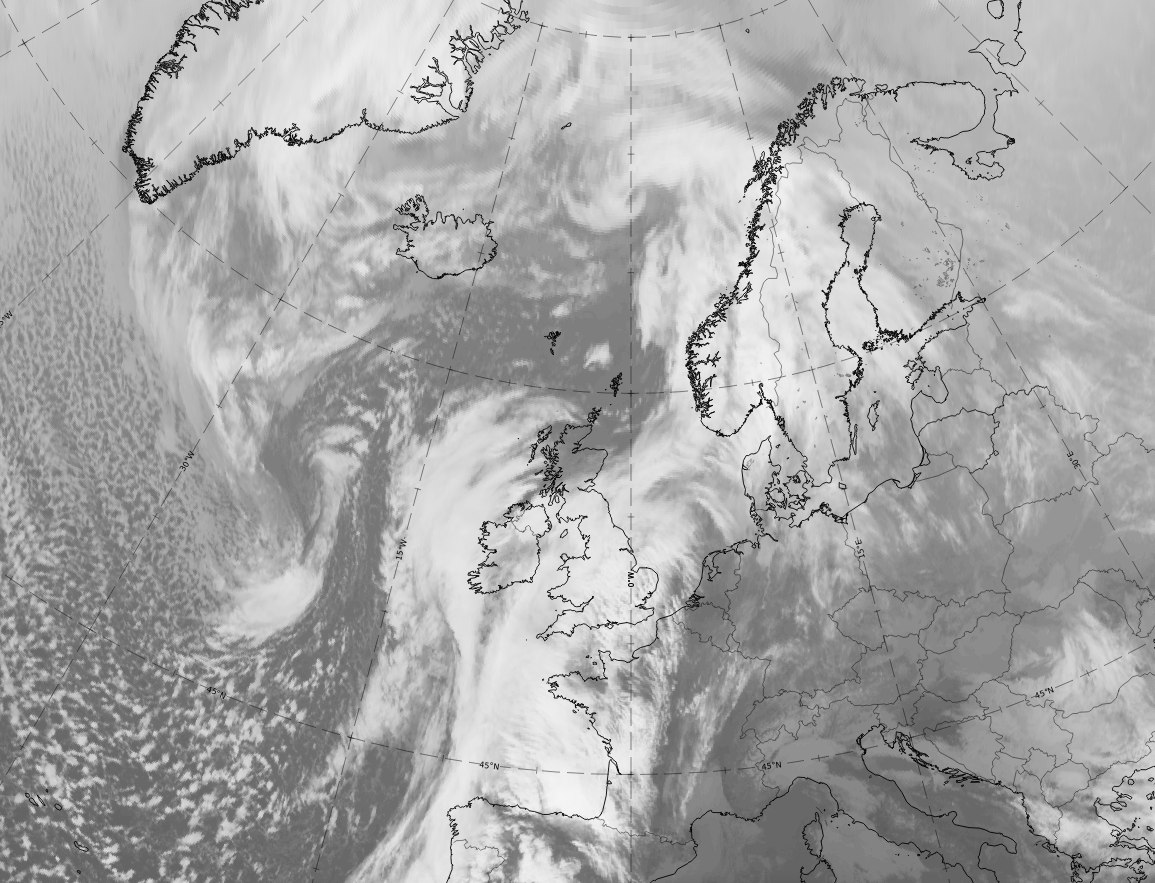
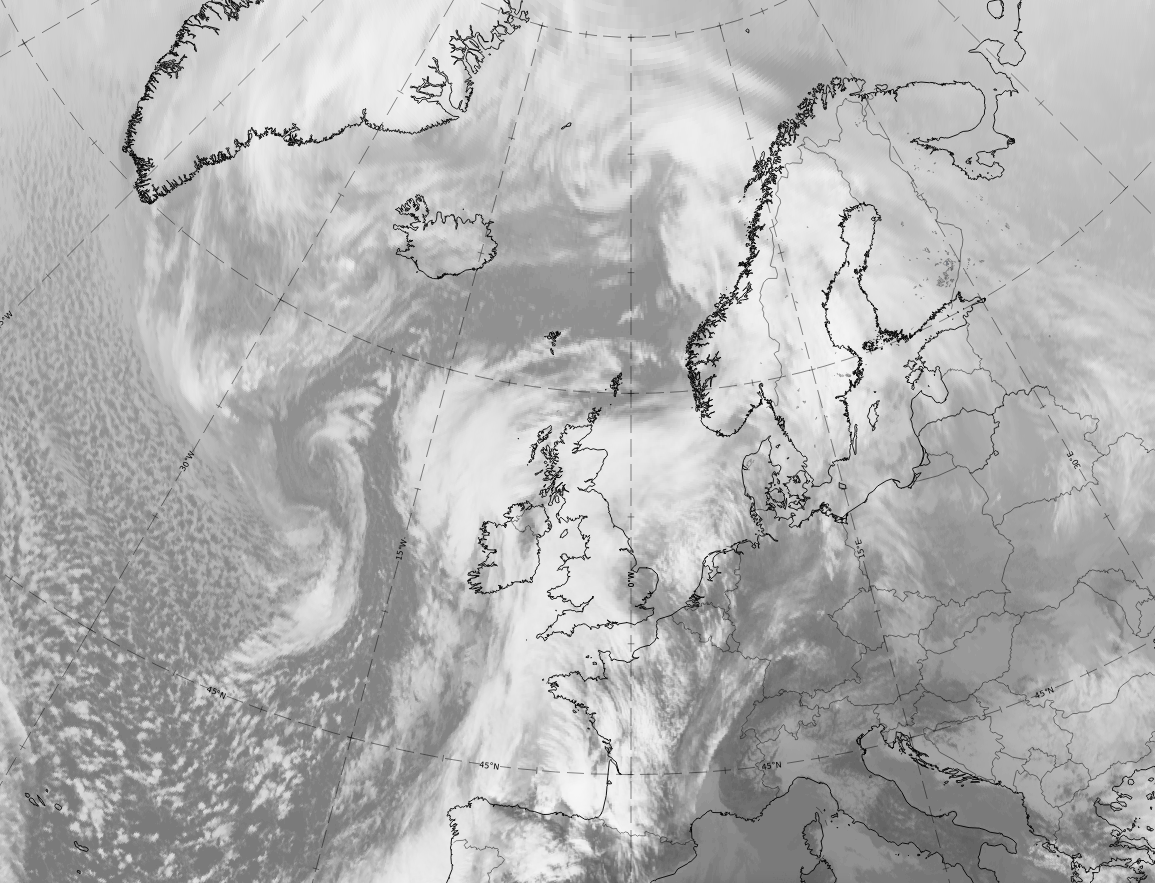
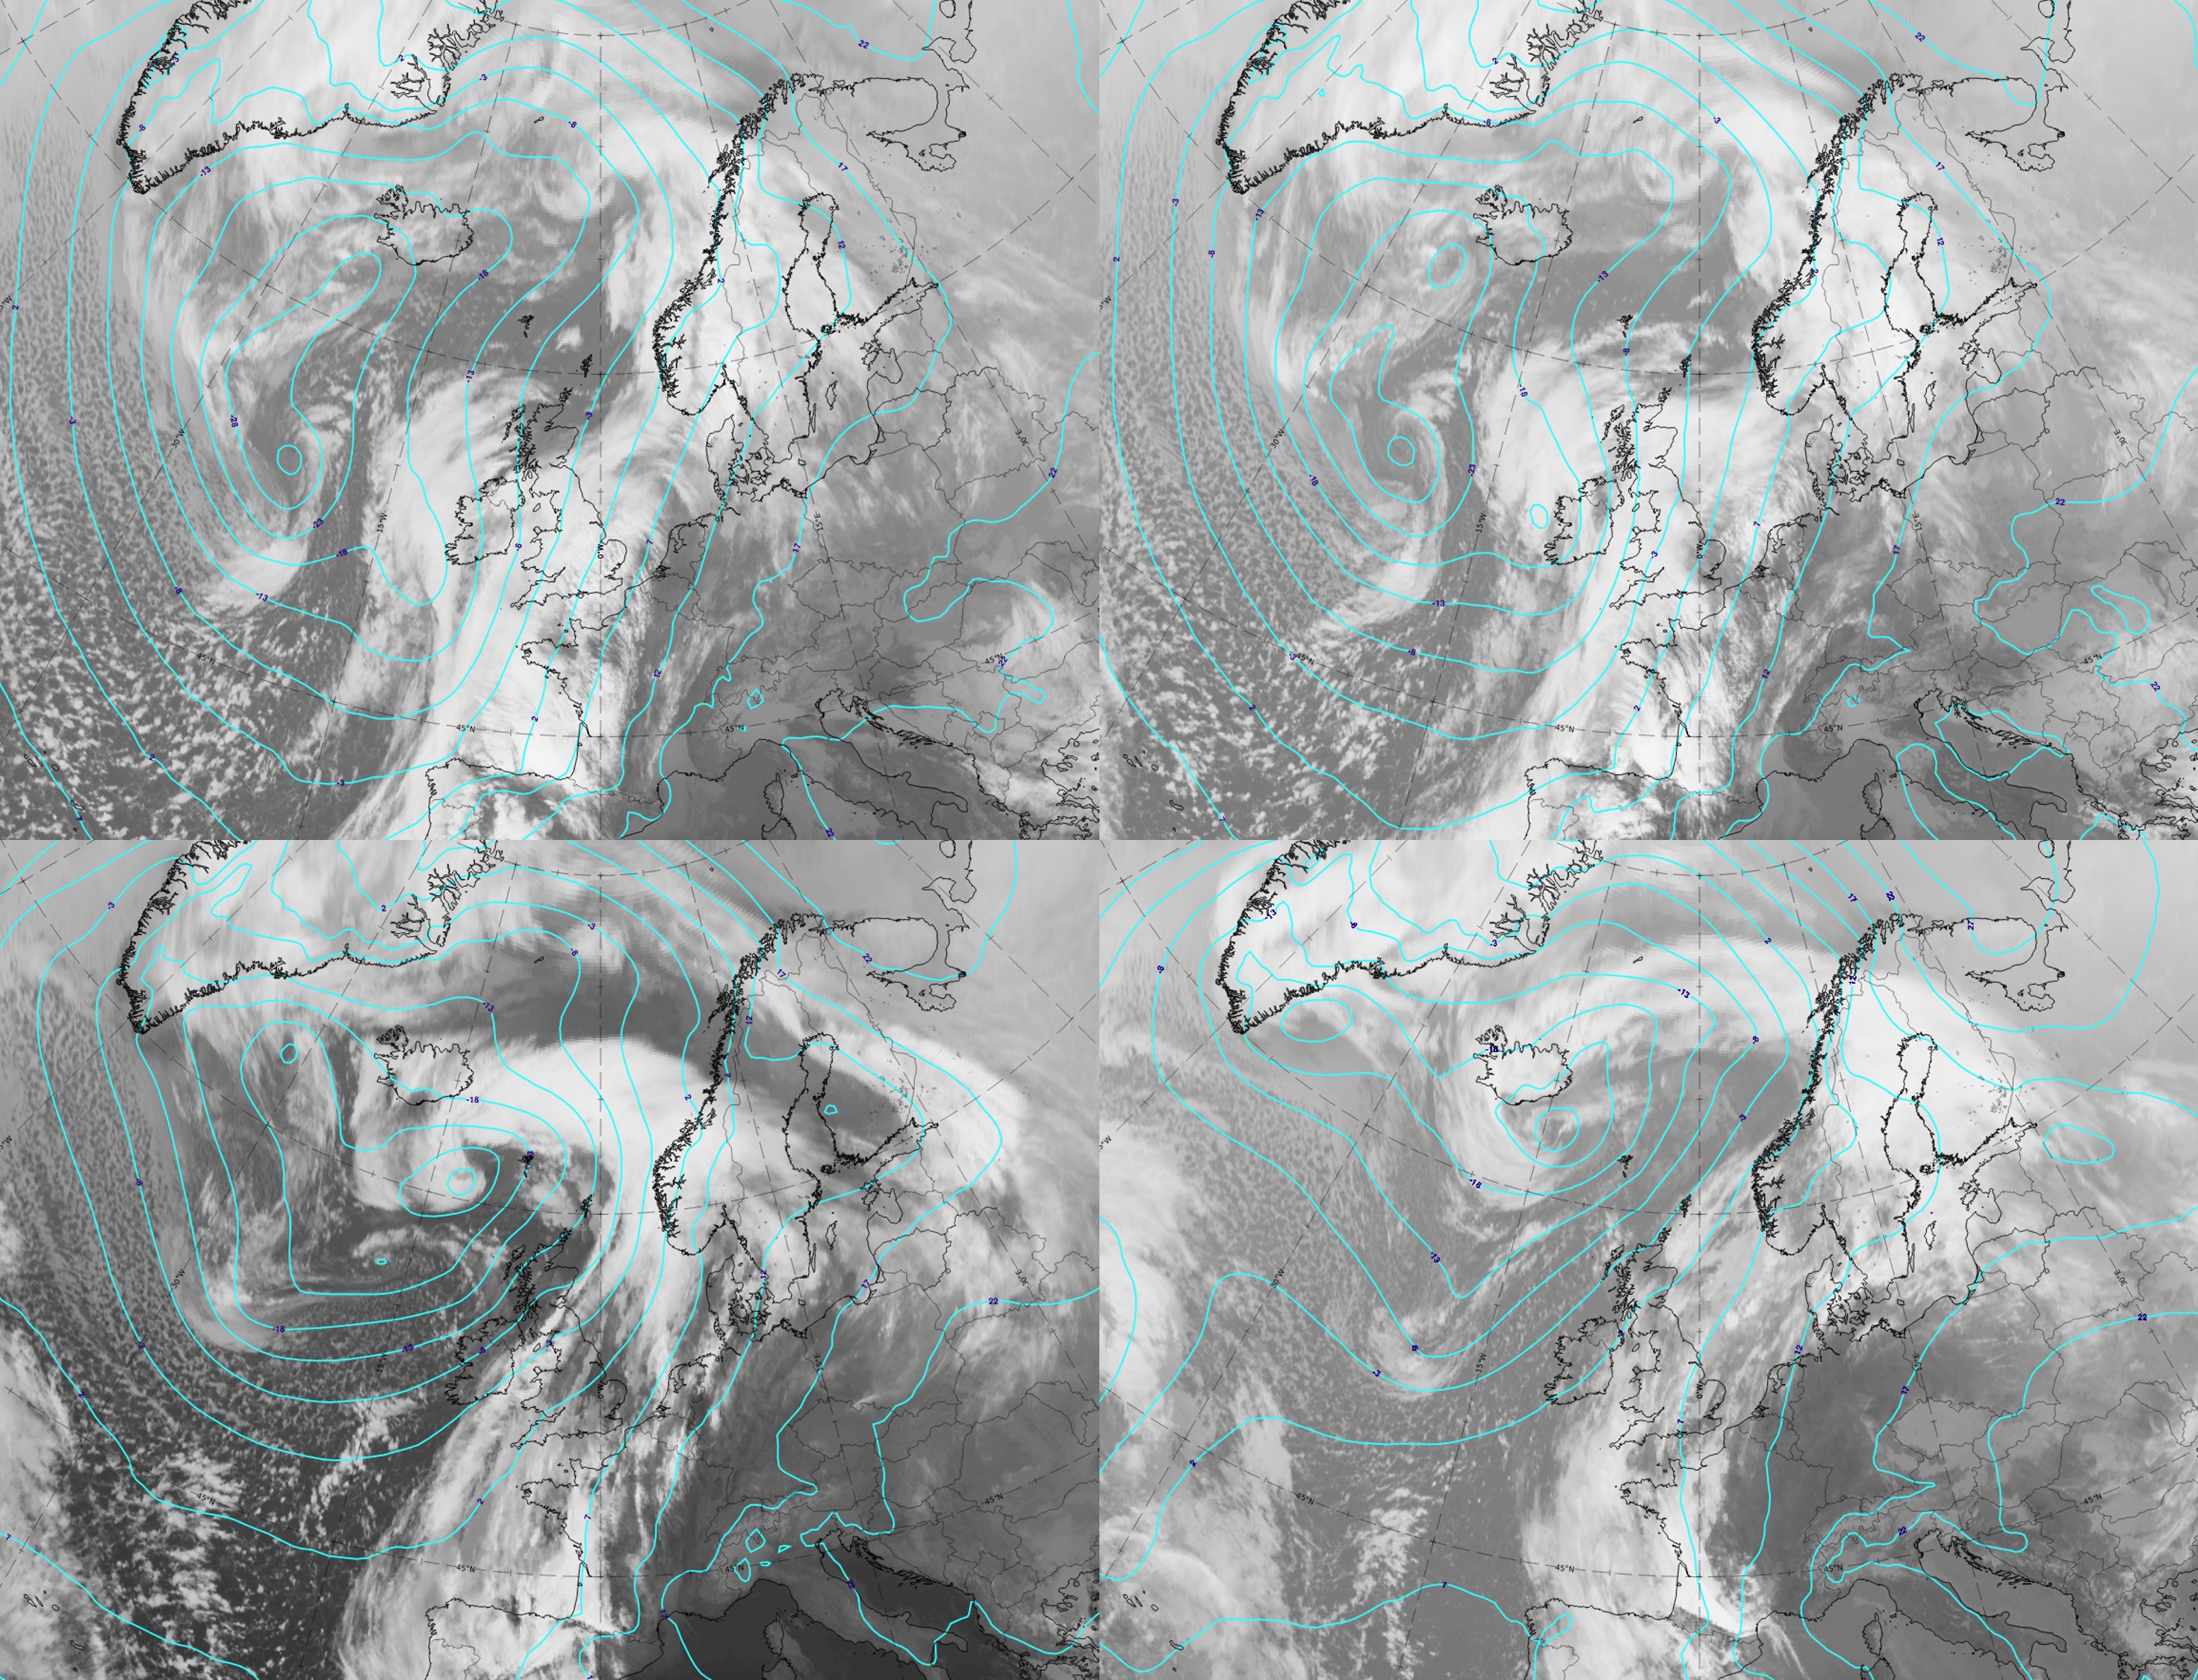
Legend: 20-21 February 2021, IR.
U.l.: 09 UTC on 20 February 2021, Wave stage; u.r.: 12 UTC on 20 February 2021, Intensification stage; 00 UTC on 21 February 2021, Mature stage; 12 U&TC on 21 February 2021, Dissipation stage.
Note: To enlarge the image, click on it.
Note: To access the gallery of individual images click here
Typical key parameter features for a cyclogenesis process of the Polar Front type
Geopotential Height
- 1000-hpa height (or close to the surface):
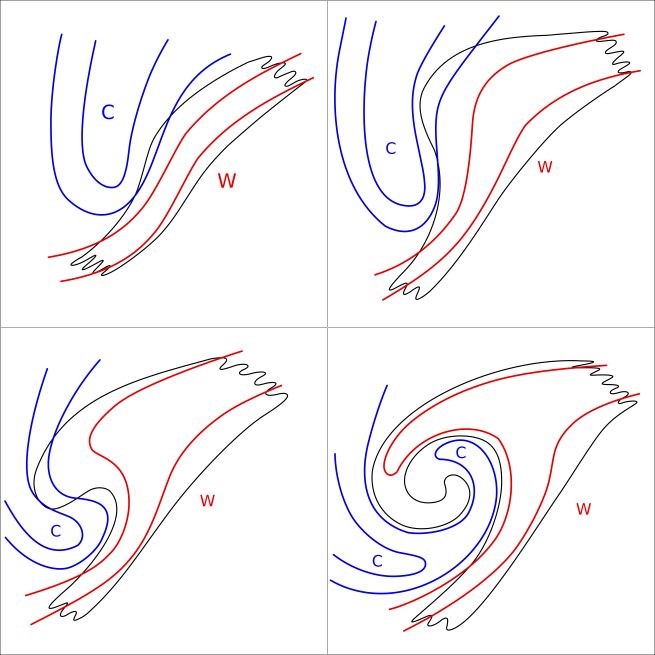
- In the Wave stage, a distinct trough can be seen in the low-level geopotential isolines in the wave area, which is characterised by the cloud bulge near the connection point between the cold and warm fronts. This trough sharpens between Wave and Intensification stages, finally forming a closed low centre.
- In the Mature and Dissipation stages, the isolines indicate that the low deepens in the centre of the occlusion spirals, so that at the end there is a pronounced low at the surface.
- 500-hpa height (or any upper level):
- In the Wave stage, an upper-level trough exists to the west of the cold front and wave cloud. This trough deepens and moves closer to the frontal system. In the Mature and the Dissipation stages, a pronounced closed low centre usually exists, which catches up with the low centre at low levels, leading to a low centre with a vertical axis throughout the whole troposphere.
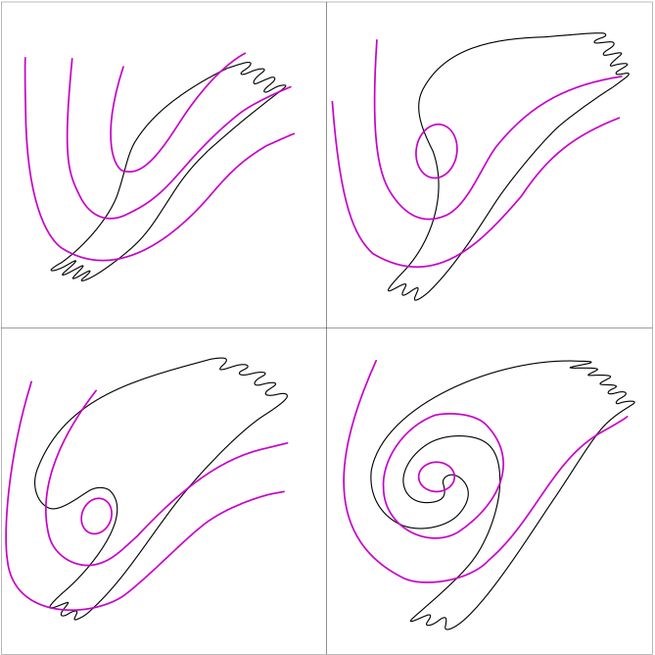
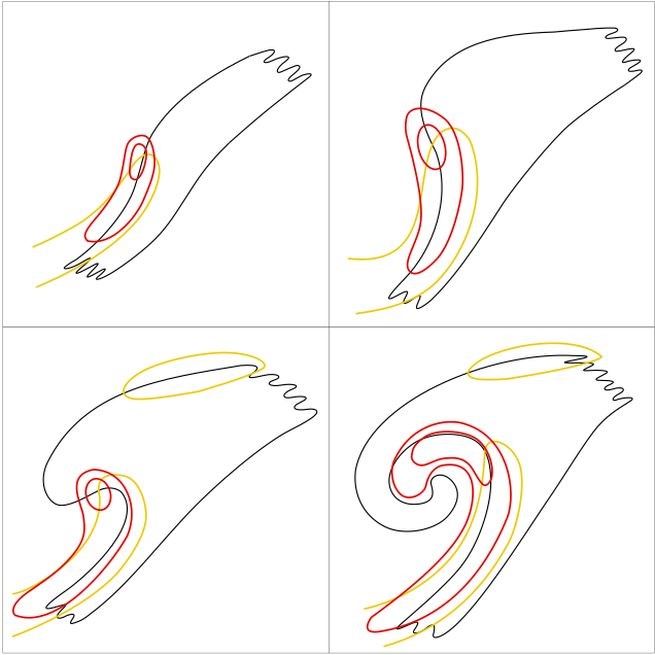
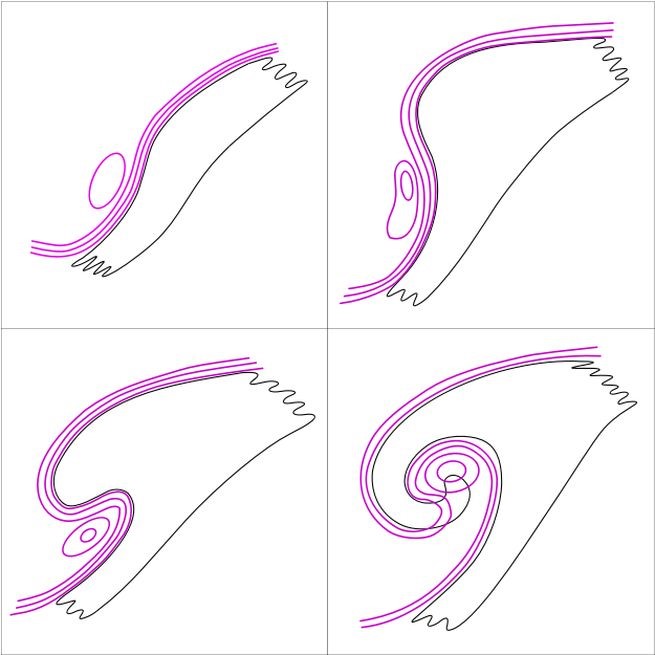
Legend:
Schematics of geopotential Height at 1000 hPa (magenta) and 500 hPa (cyan).
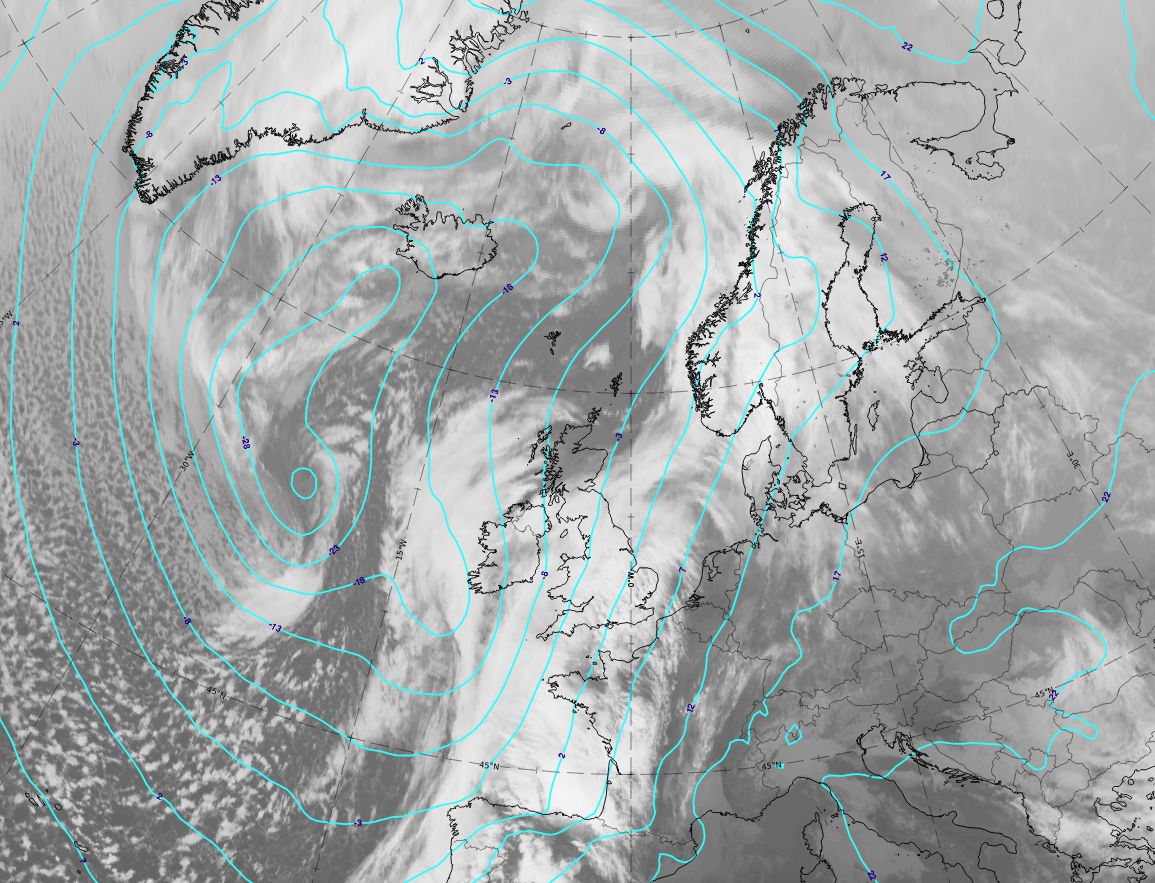
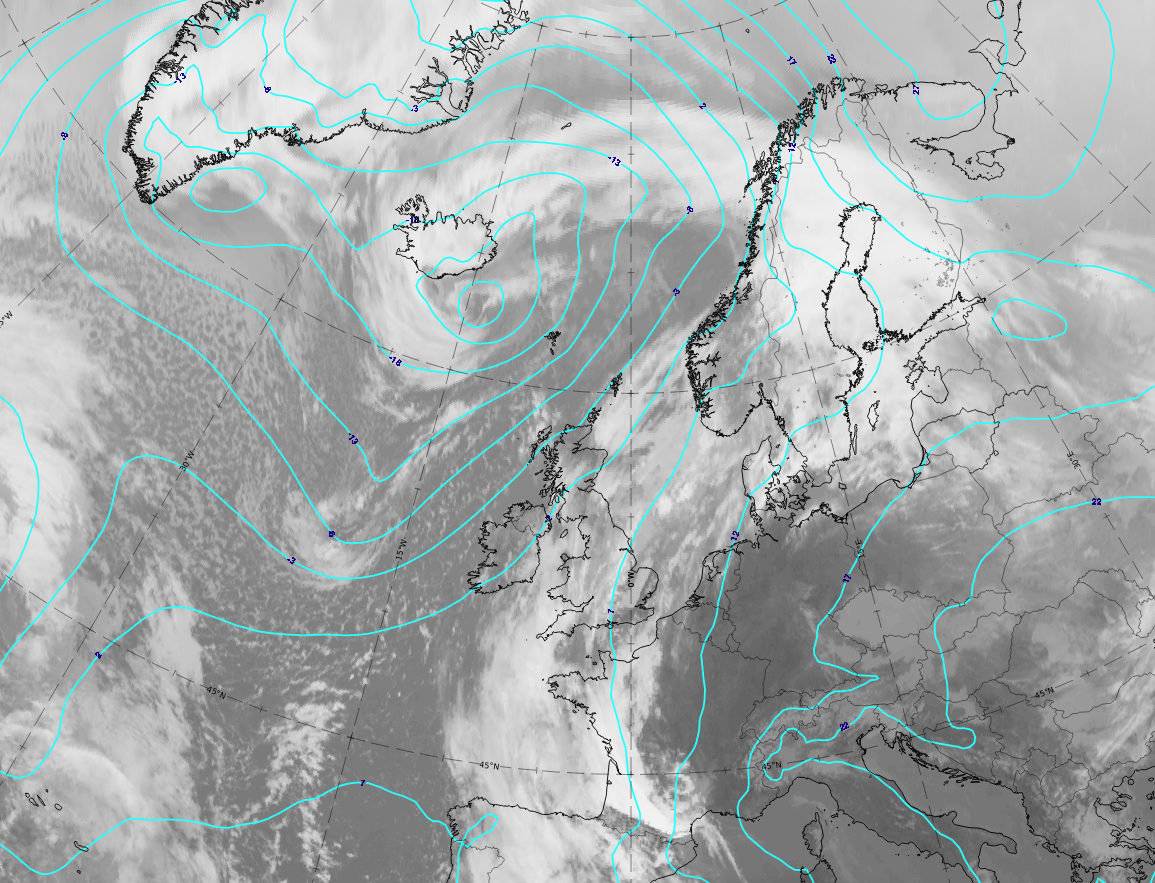
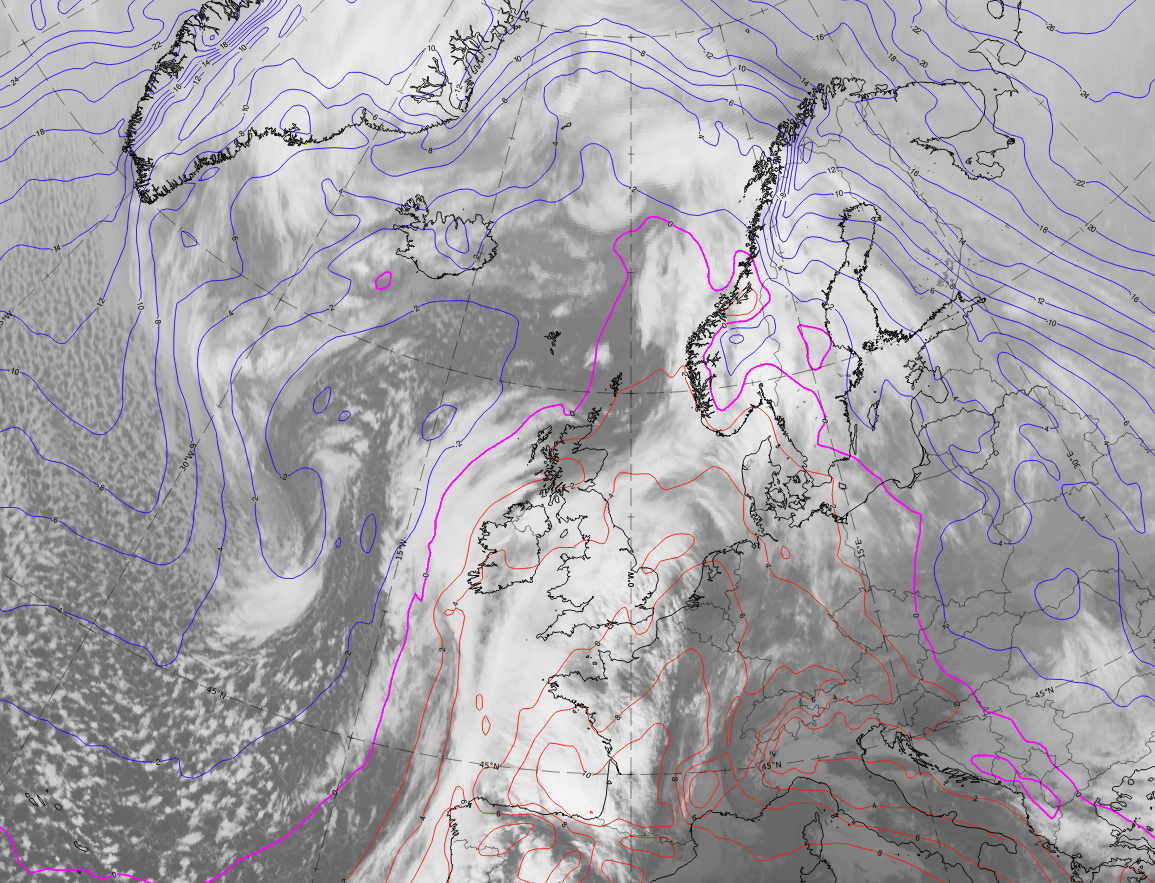
Legend: 20-21 February 2021. IR; geopotential height at 1000 hPa (cyan).
U.l.: 09 UTC on 20 February 2021 Wave stage; u.r.: 12 UTC on 20 February 2021, Intensification stage; 00 UTC on 21 February 2021, mature stage; 12 UTC on 21 February 2021, Dissipation stage.
Note: To enlarge the image, click on it.
Note: To access the gallery of individual images click here
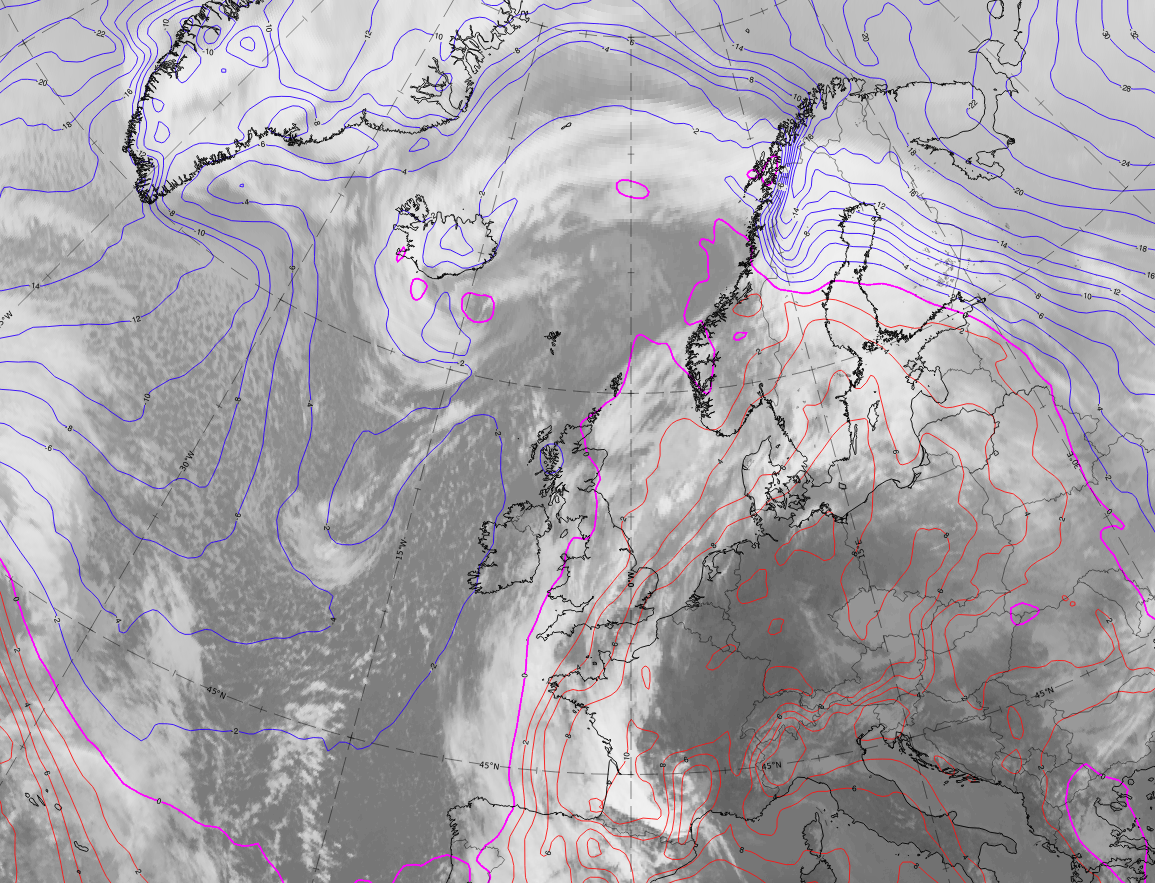
The low at 1000 hPa develops from a trough feature to the west of Ireland in the Wave stage west to a closed circulation in the Intensification stage and deepens in the Mature stage as well as the Dissipation stage.
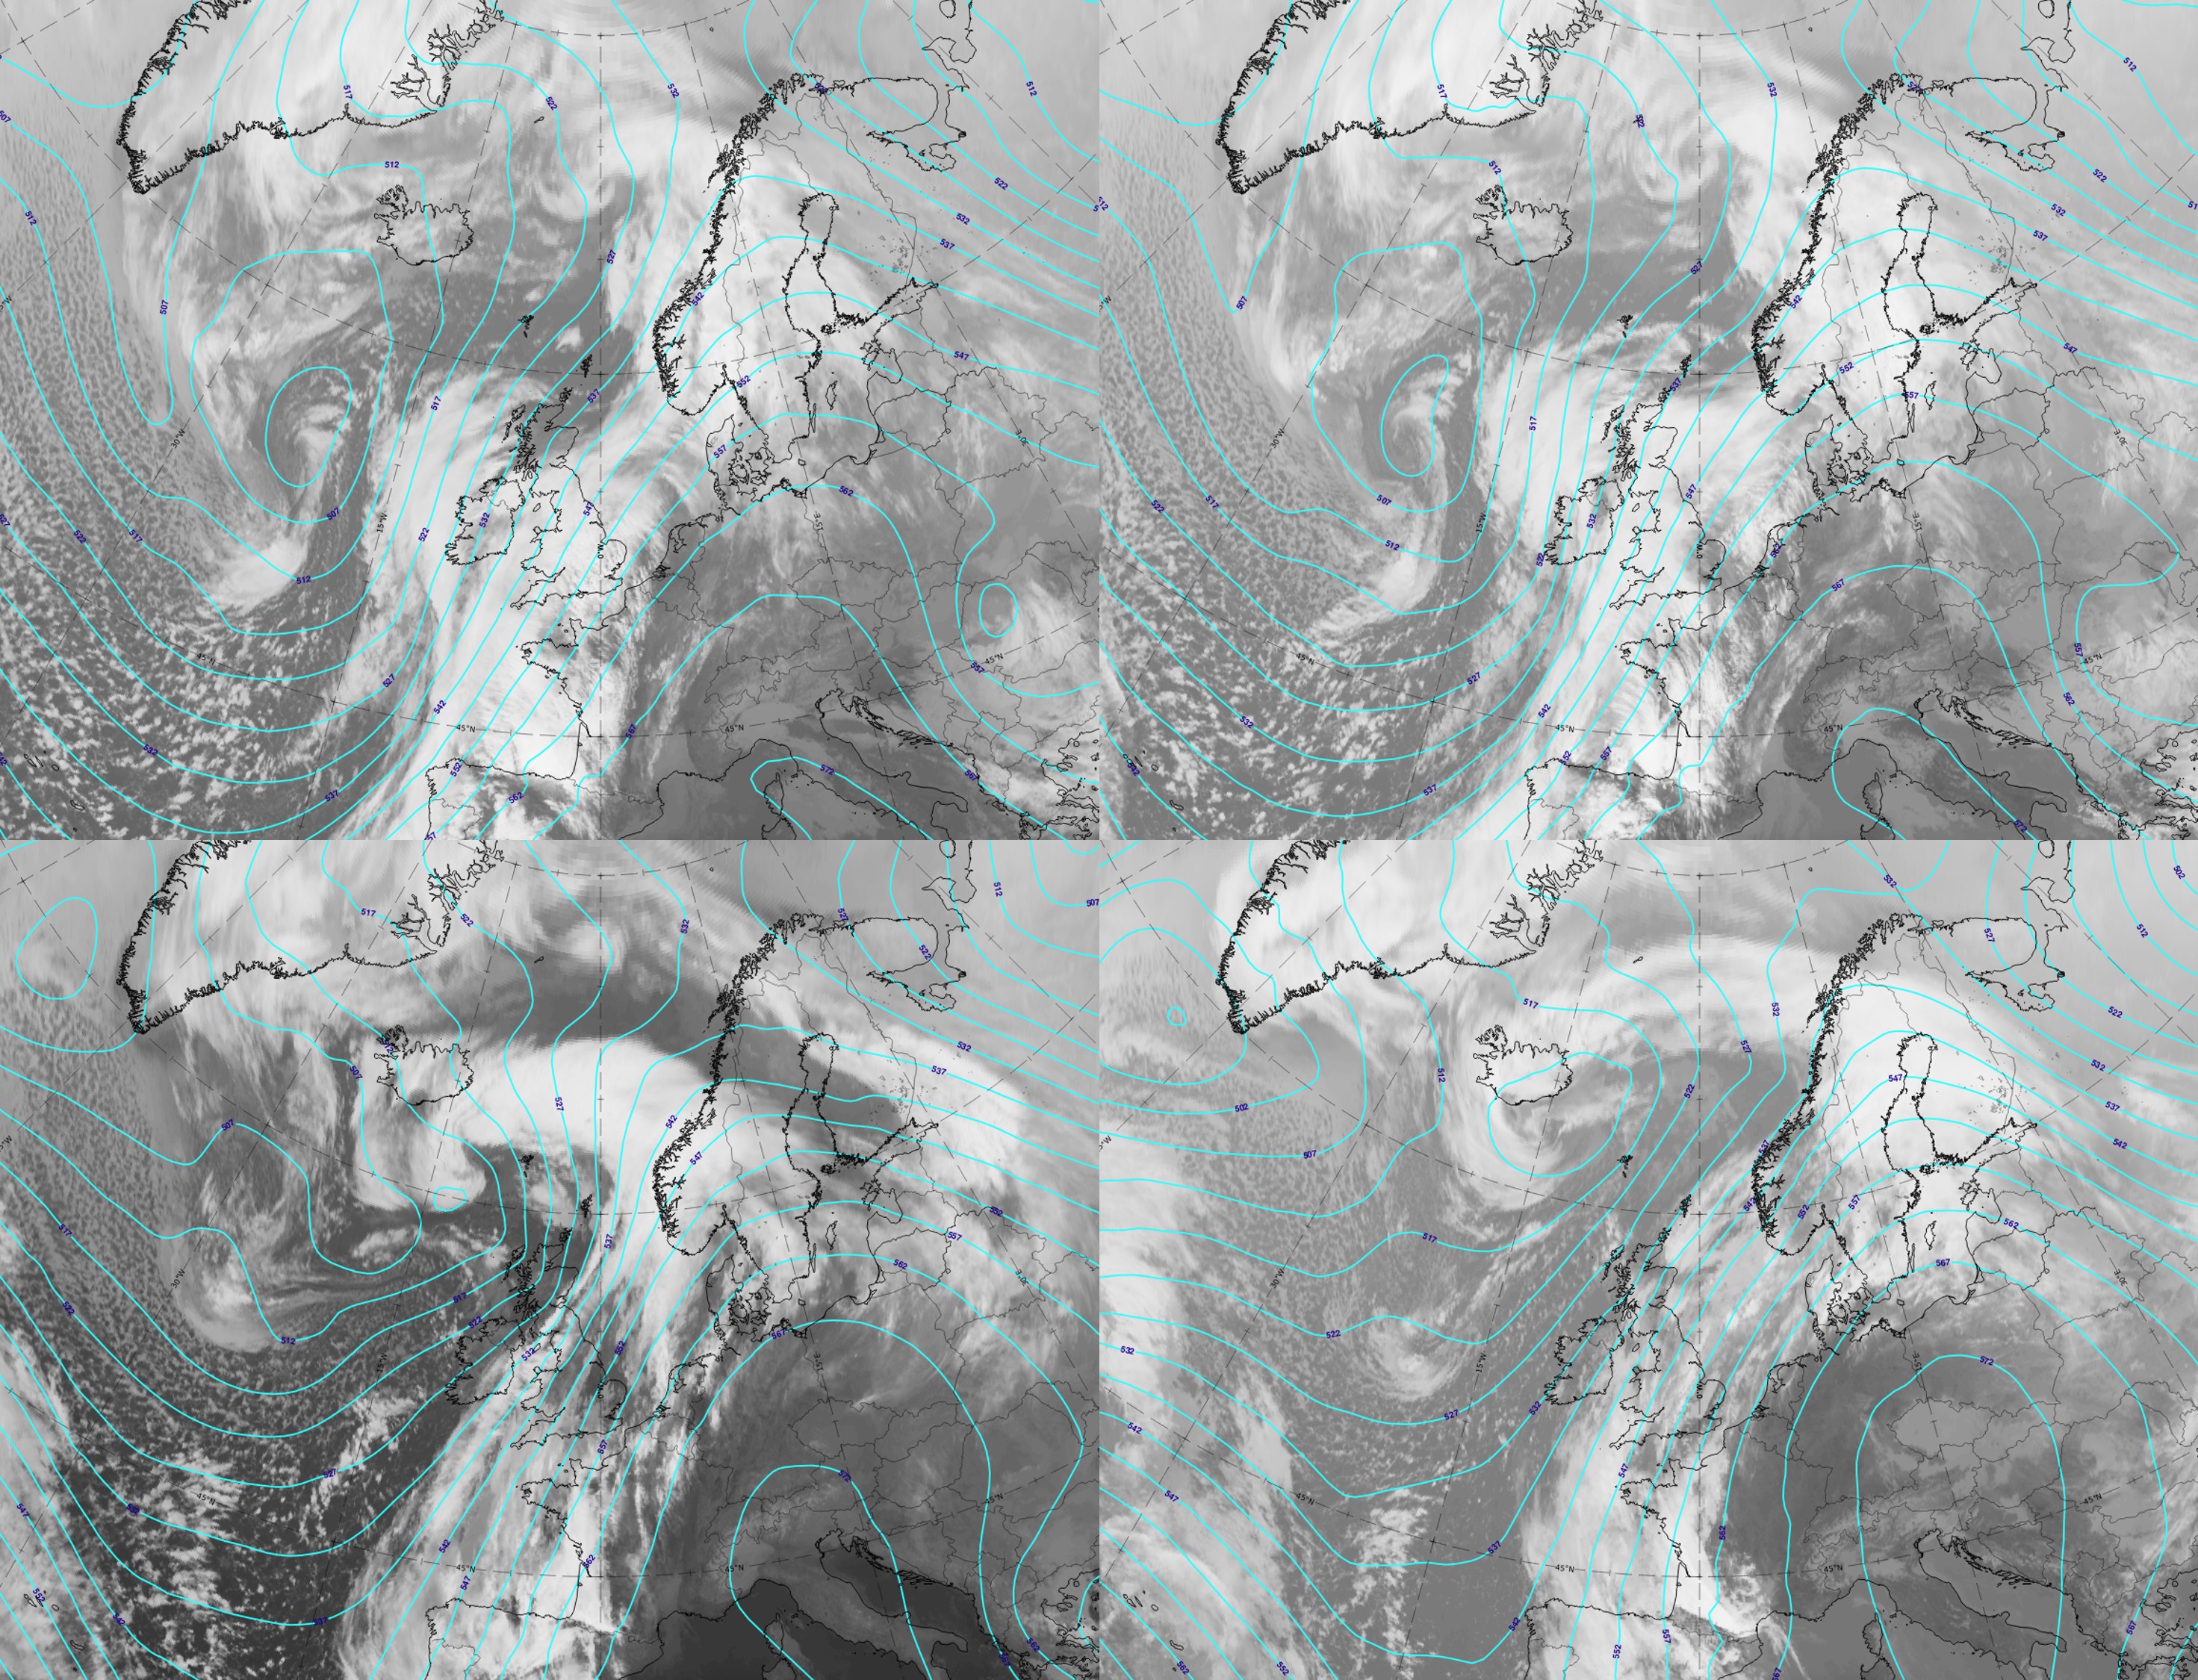
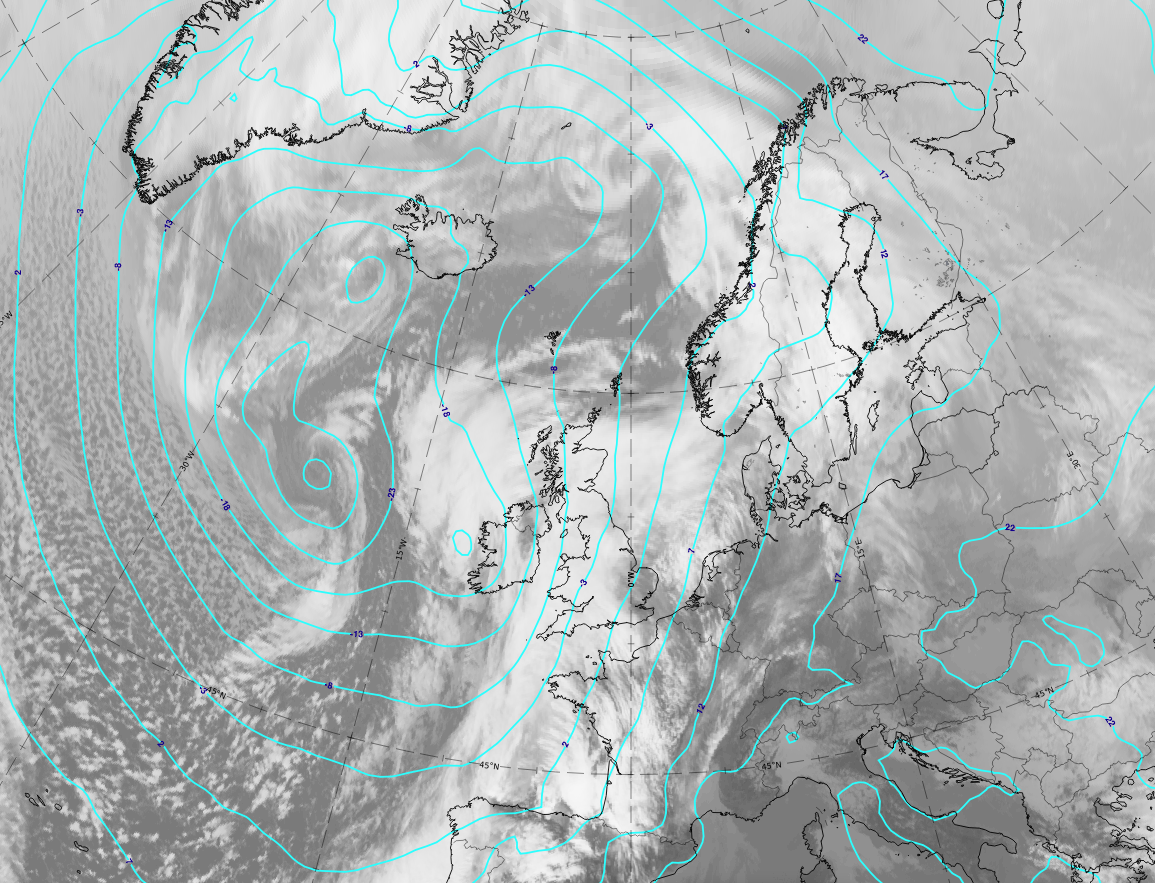
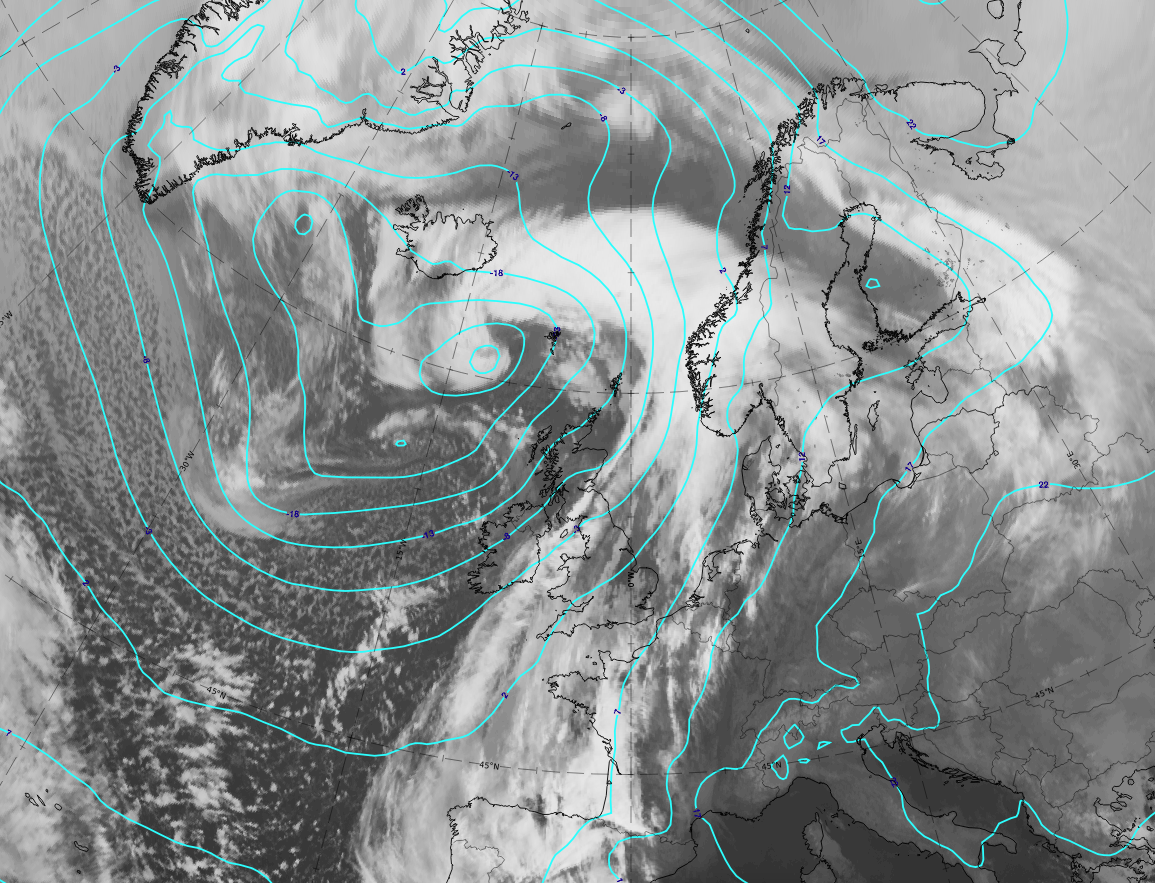
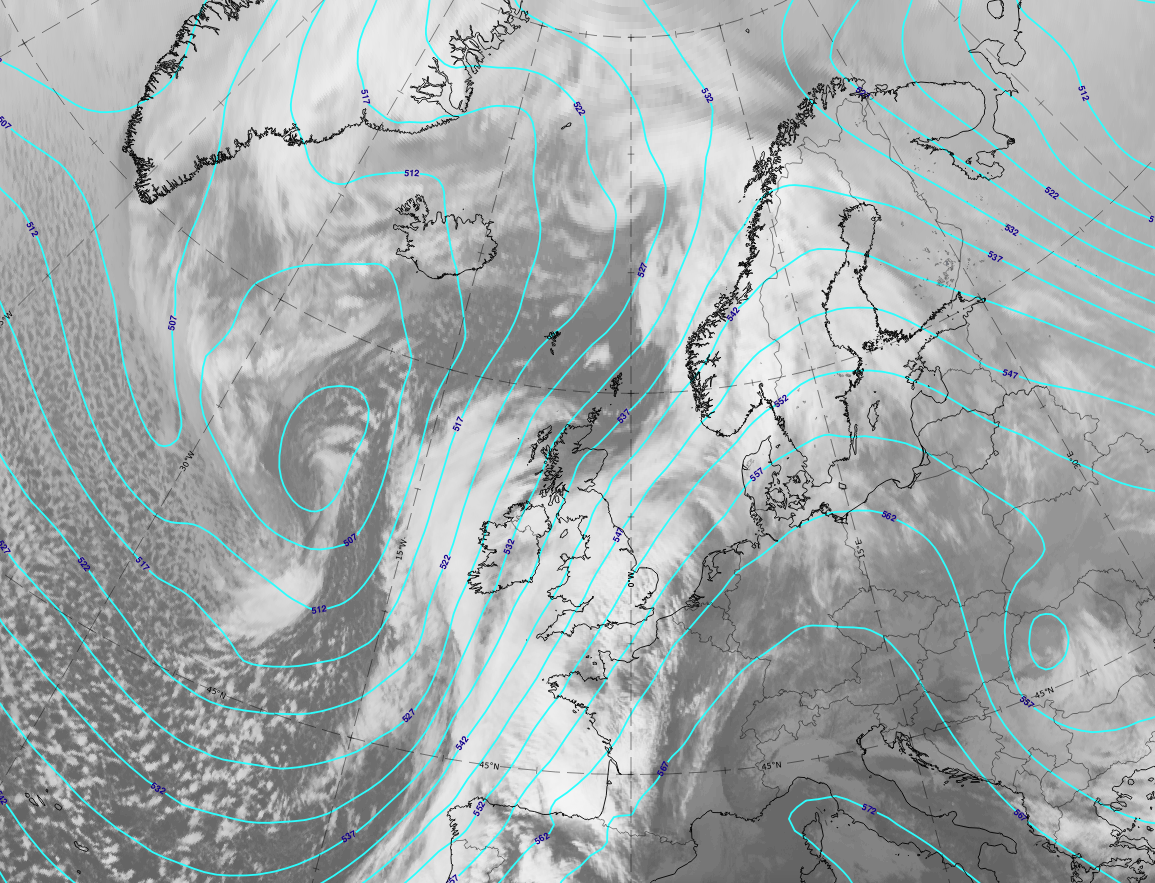
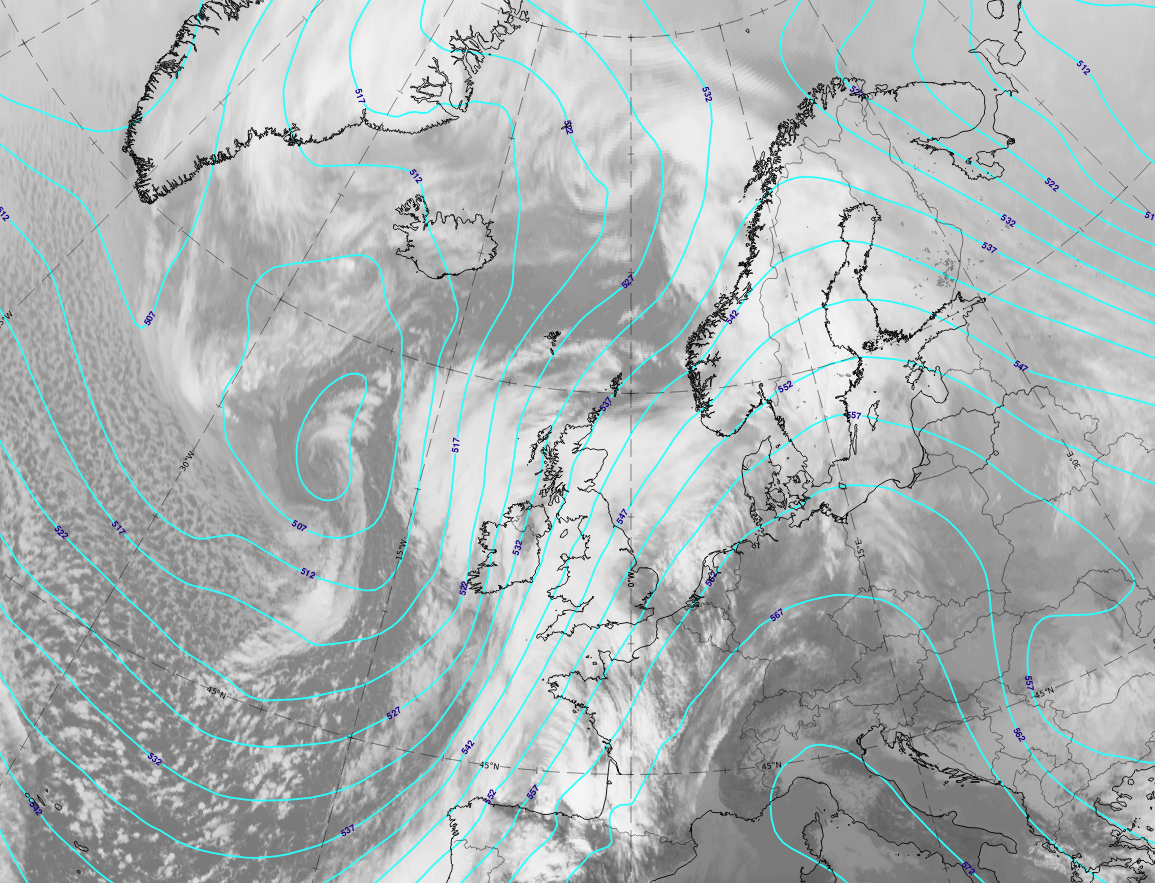
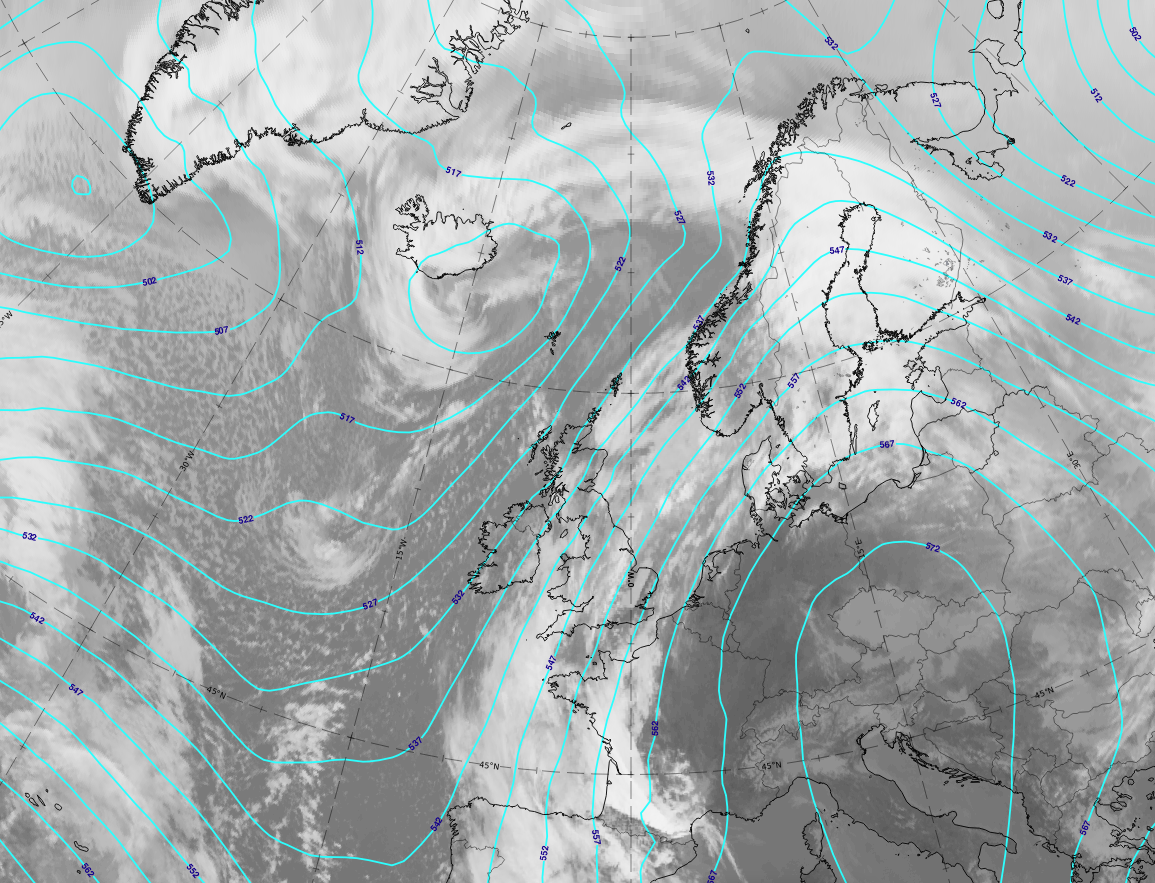
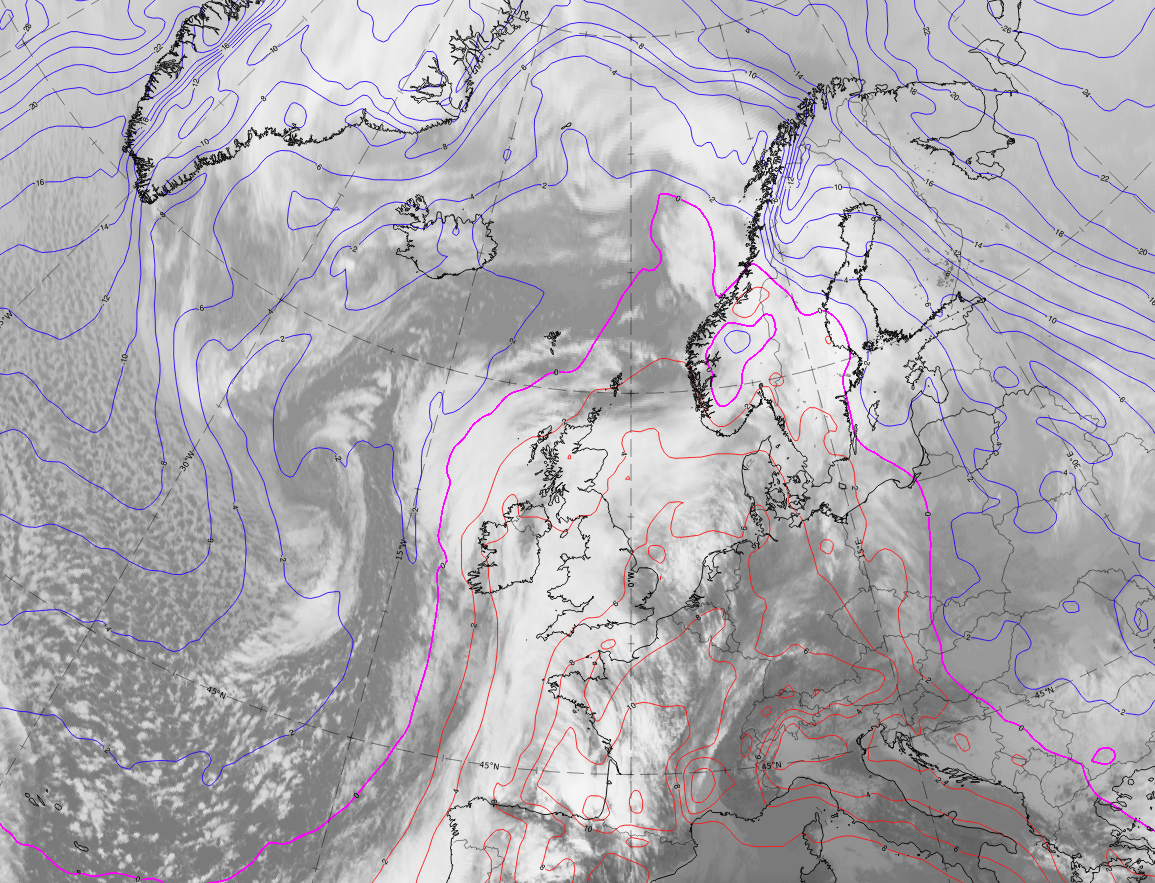
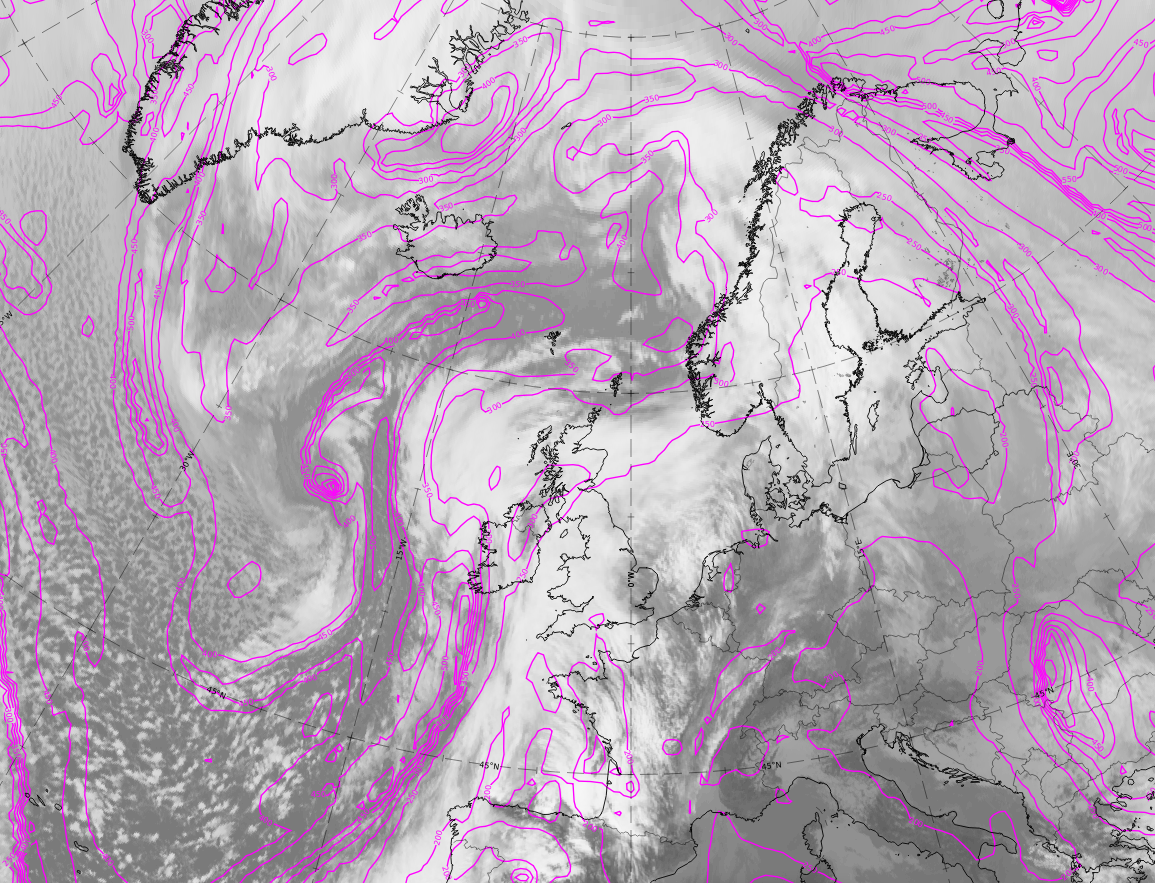
Legend: 20-21 February 2021. IR; geopotential height at 500 hPa (cyan).
U.l.: 09 UTC on 20 February 2021, Wave stage; u.r.: 12 UTC on 20 February 2021, Intensification stage; 00 UTC on 21 February 2021, Mature stage; 12 UTC on 21 February 2021, Dissipation stage.
Note: To enlarge the image, click on it.
Note: To access the gallery of individual images click here
The geopotential height at 500 hPa shows, in the "Wave stage", a pronounced trough to the rear of the cloud bulge. The trough lines approach the intensified cloud bulge in the Intensification stage and finally show a closed rotation centre with an eastward-oriented trough line in the Mature and Dissipation stages.
Thermal parameters
- Temperature at 850 hPa or 700 hPa
- In the Wave stage and the Intensification stage there are parallel temperature isolines within the cold front cloud band and the wave area, while to the rear a temperature minimum exists; this indicates the transition from warm air in front to cold air behind the frontal cloud system.
- Starting during the Intensification stage, the isolines form a ridge in the cloud bulge, which becomes more and more pronounced in the Mature stage and the Dissipation stage, when it accompanies the occlusion cloud spirals.
- The trough indicating the cold air at the rear, becomes involved in the cyclonic circulation of the low and protrudes into the low centre.
- Temperature Advection at 850 or 700 hPa
- The Wave stage is characterised by a juxtaposition of warm advection maxima within its associated cloud bulge and cold advection in the cold air immediately to the rear of the cloud bulge. This is a consequence of the cyclonic rotation in the low centre and increases in intensity and area during the Intensification stage.
- During the Mature stage, the warm and cold advection maxima intensify further. In the Dissipation stage, the occlusion cloud spiral is co-located with the warm advection maximum, while the cold advection maximum is located in the cloud free centre of the occlusion spiral.
- Thickness between 1000 and 500 hPa and Thermal Front Parameter
- For the Wave stage and Intensification stages, the thickness isolines show a distinct gradient of parallel lines at the rear of the cloud band, the wave bulge and further within the cloud of the warm front. This represents the transition from warm to cold air at the front. Further west, a thickness trough indicates the coldest air at the rear of the frontal system.
- During the stages with occlusion spirals, thickness lines form a ridge within the cloud spiral, indicating the lifted warn air; this is a typical cyclogenesis process according to the Polar Front Theory.
- The thermal front parameter (TFP) is defined as the maximum of the change of the temperature gradient or thickness gradient. This is located at the warm side of the zone of high temperature/thickness gradients, as well as in the centre of the thickness ridge in the occlusion spiral.(Basics - TFP)
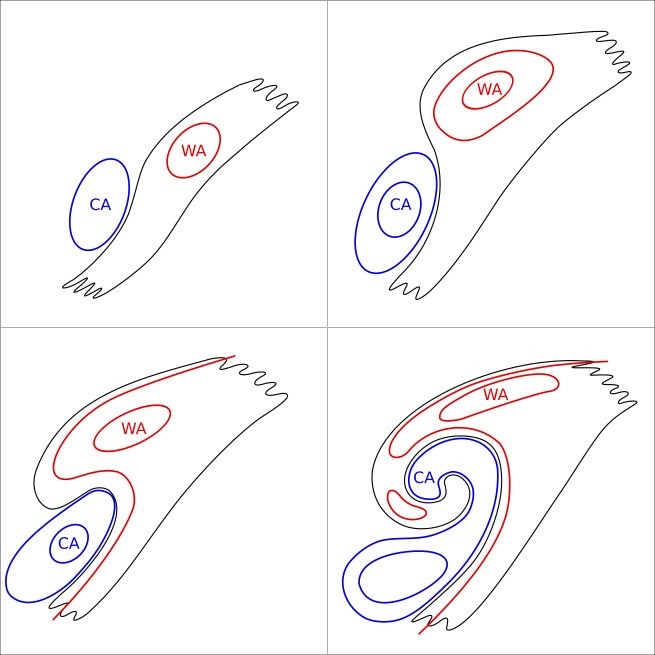
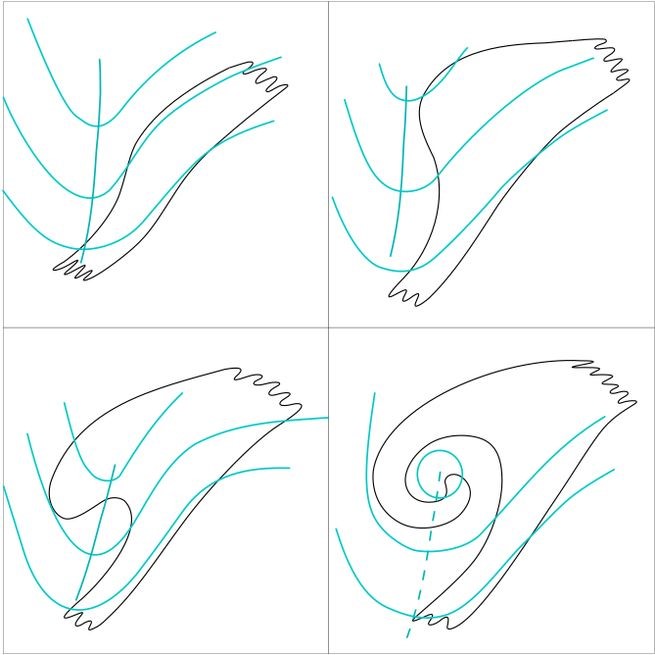
Legend: Schematics of thermal parameters.
U.l.: temperature at 850 hPa; u.r.: temperature advection at 850 hPa; l.l: thickness between 500 and 1000 hPa (green) and TFP (blue).
Note: To enlarge the images, click on them.
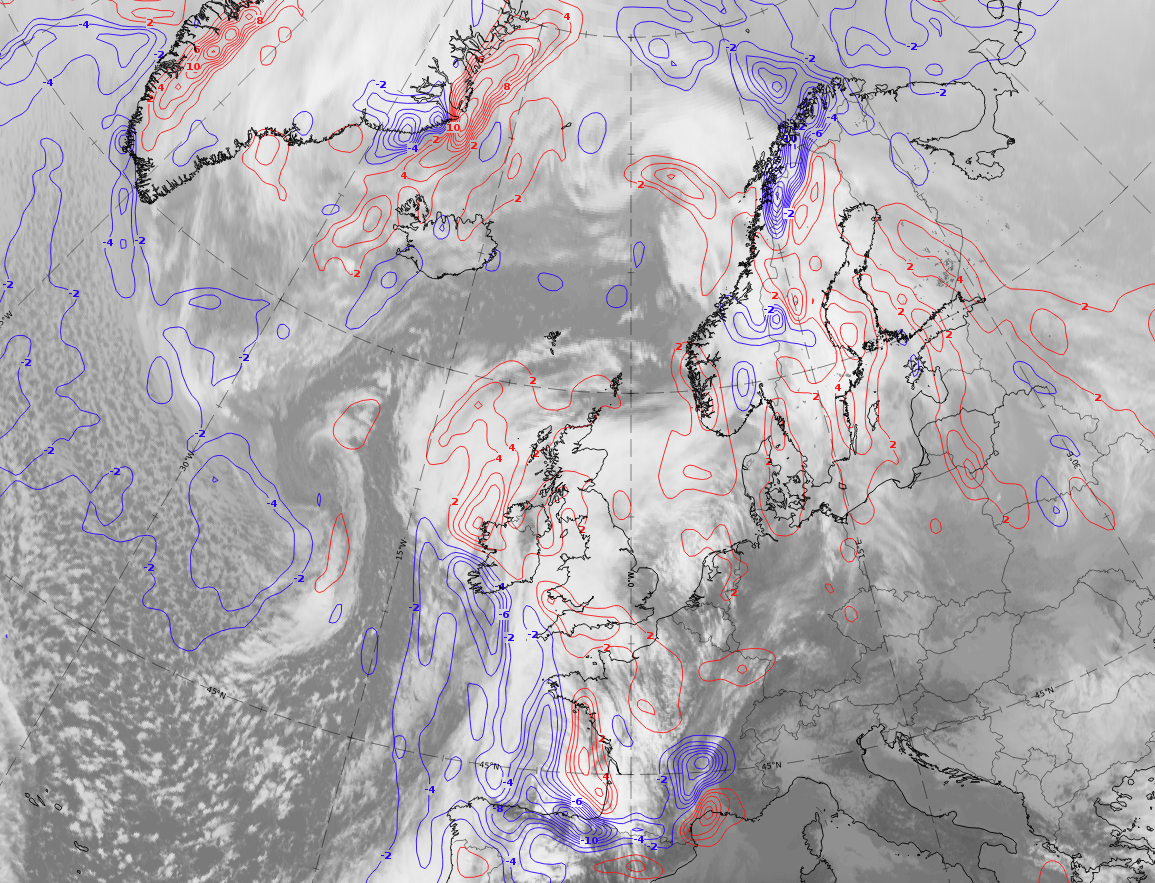
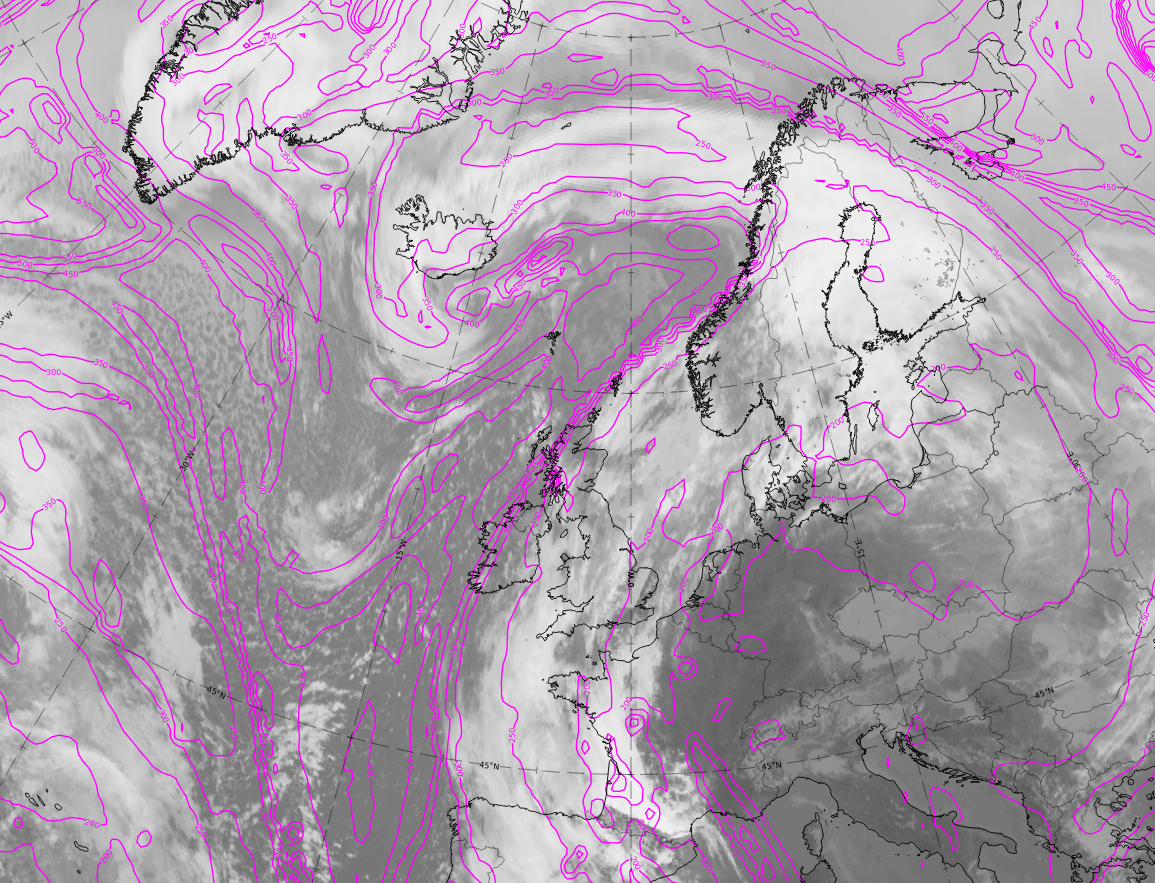
Legend: 20-21 February 2021, IR; temperature at 850 hPa.
U.l.: 9 UTC on 20 February 2021, Wave stage; u.r.: 12 UTC on 21 February 2021, Intensification stage; 00 UTC on 21 February 2021, Mature stage; 12 UTC on 21 February 2021, Dissipation stage.
Note: To enlarge the image, click on it.
Note: To access the gallery of individual images click here
The main characteristics of the 850-hPa temperature fields in this demonstration case are:
- The distinct separation between warm air within the frontal cloud bands (red and magenta colours) and cold air (blue colour) as well as the frontal zone with high gradients.
- The growing bulge of warm air accompanying all stages from the Wave stage to the Mature stage.
- The loss of distinct structures in the Dissipation stage.
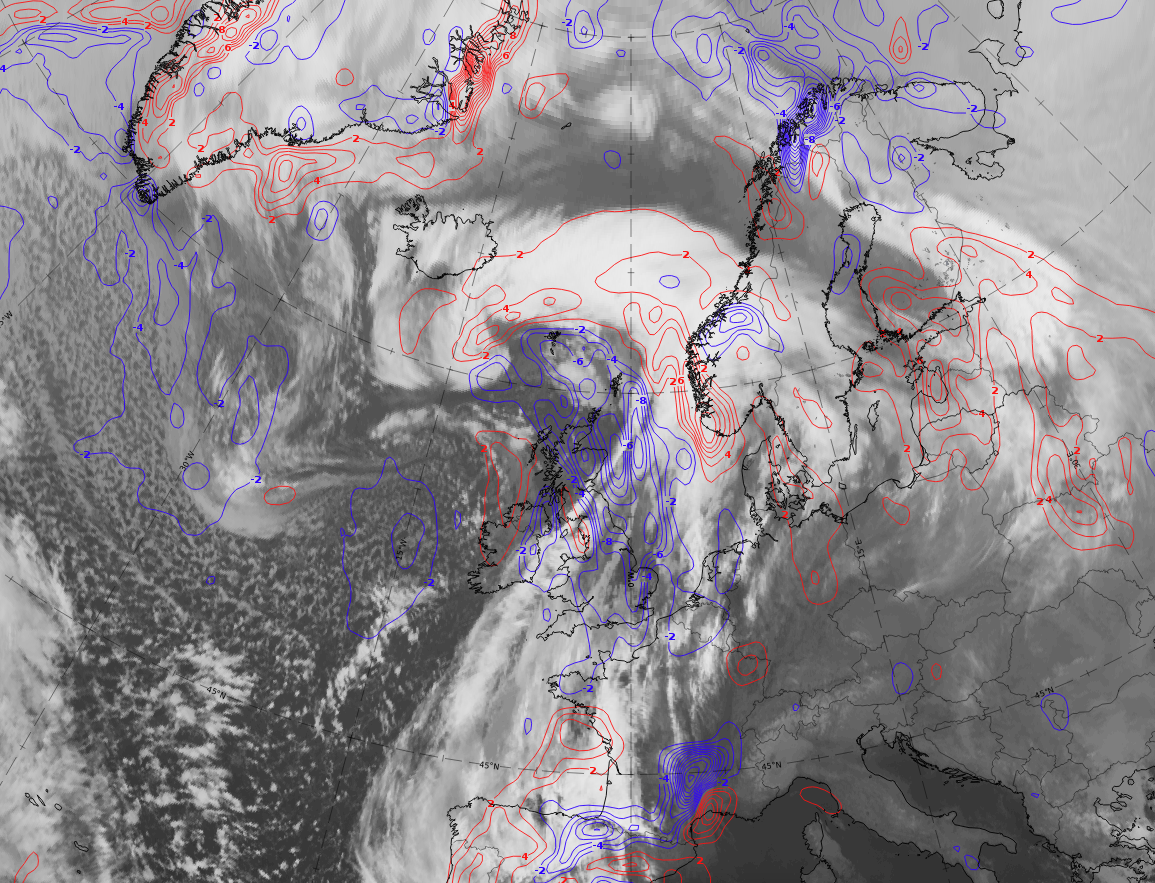
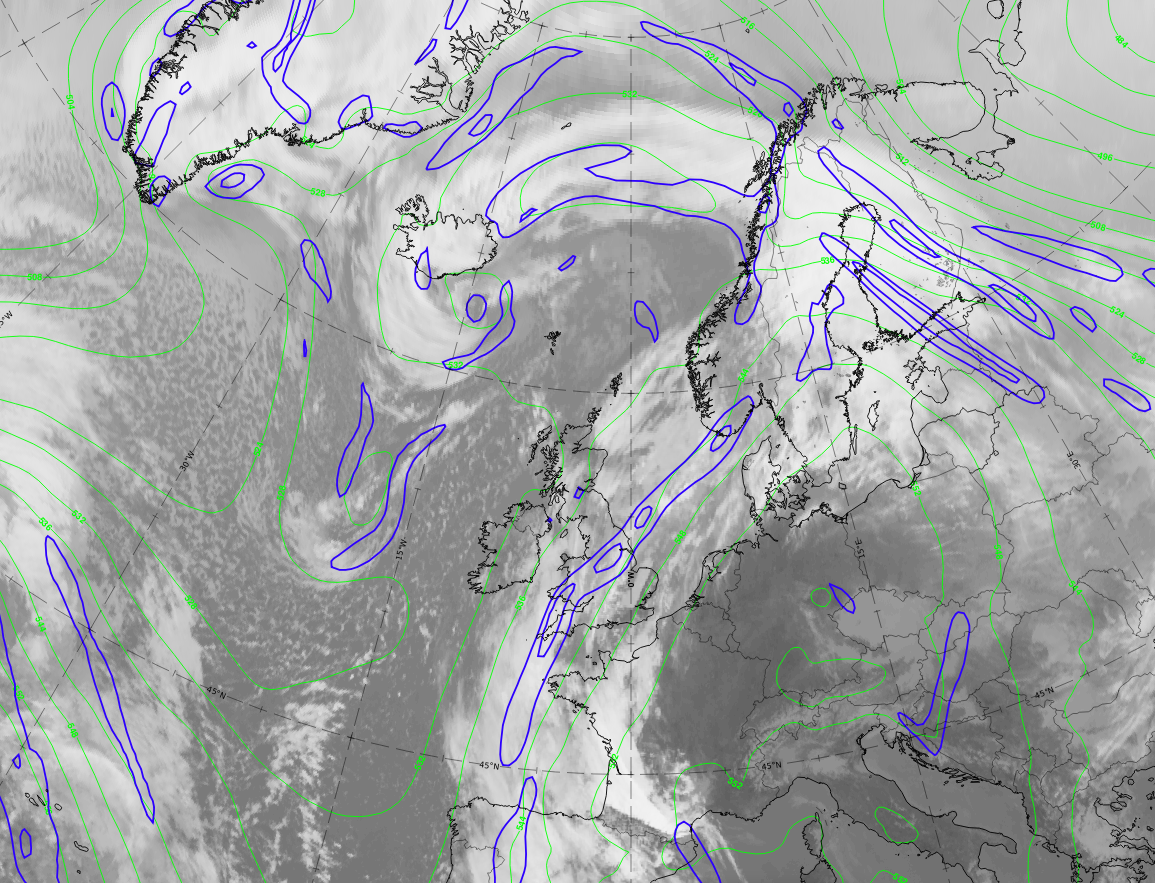
Legend: 20-21 February 2021, IR; temperature advection at 850 hPa.
U.l.: 9 UTC on 20 February 2021, Wave stage; u.r.: 12 UTC on 21 February 2021, Intensification stage; 00 UTC on 21 February 2021, Mature stage; 12 UTC on 21 February 2021, Dissipation stage.
Note: To enlarge the image, click on it.
Note: To access the gallery of individual images click here
The main characteristics of the parameter temperature advection in this demonstration case are:
- The growing bulge of warm advection accompanying the occlusion spiral, which can be seen in this case from the Wave stage to the Mature stage.
- A cold advection maximum in the centre of the cloud spiral.
- In the Dissipation stage, the temperature advection maxima become weaker and less distinct.
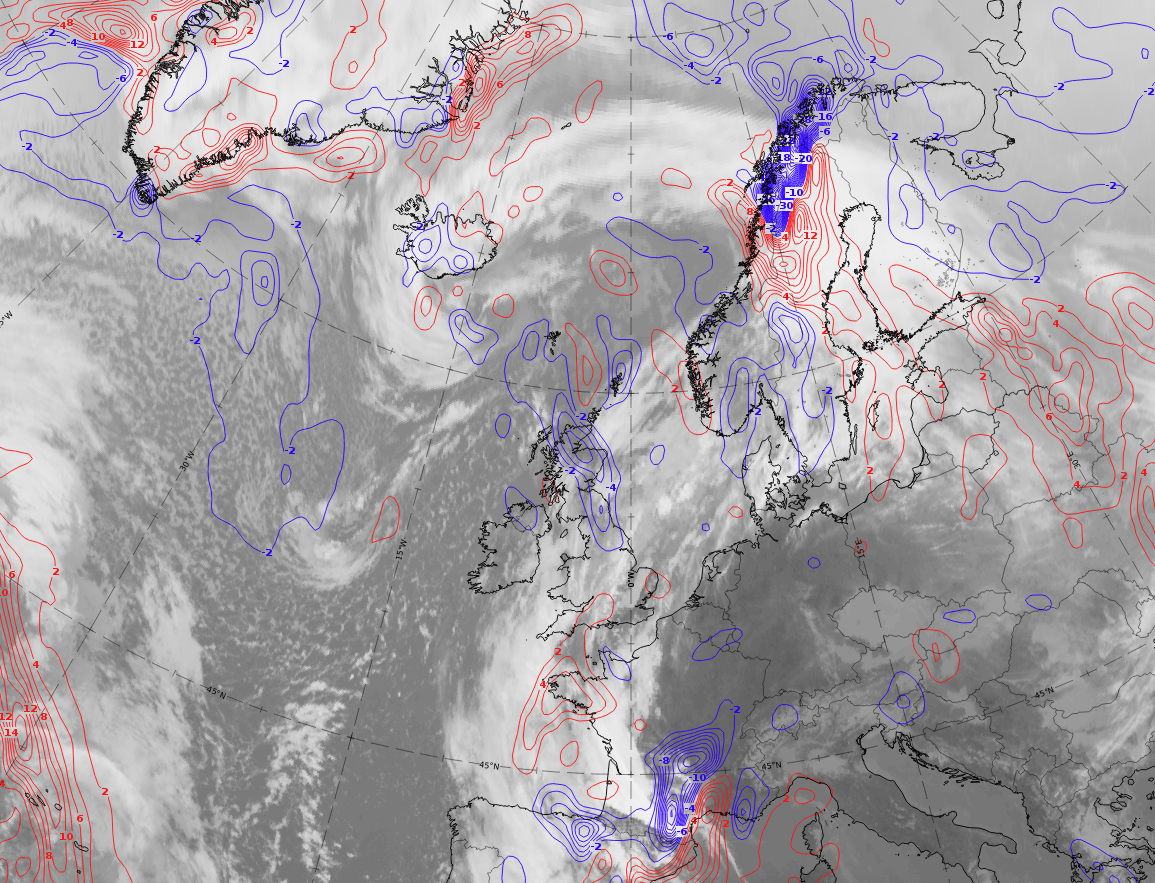
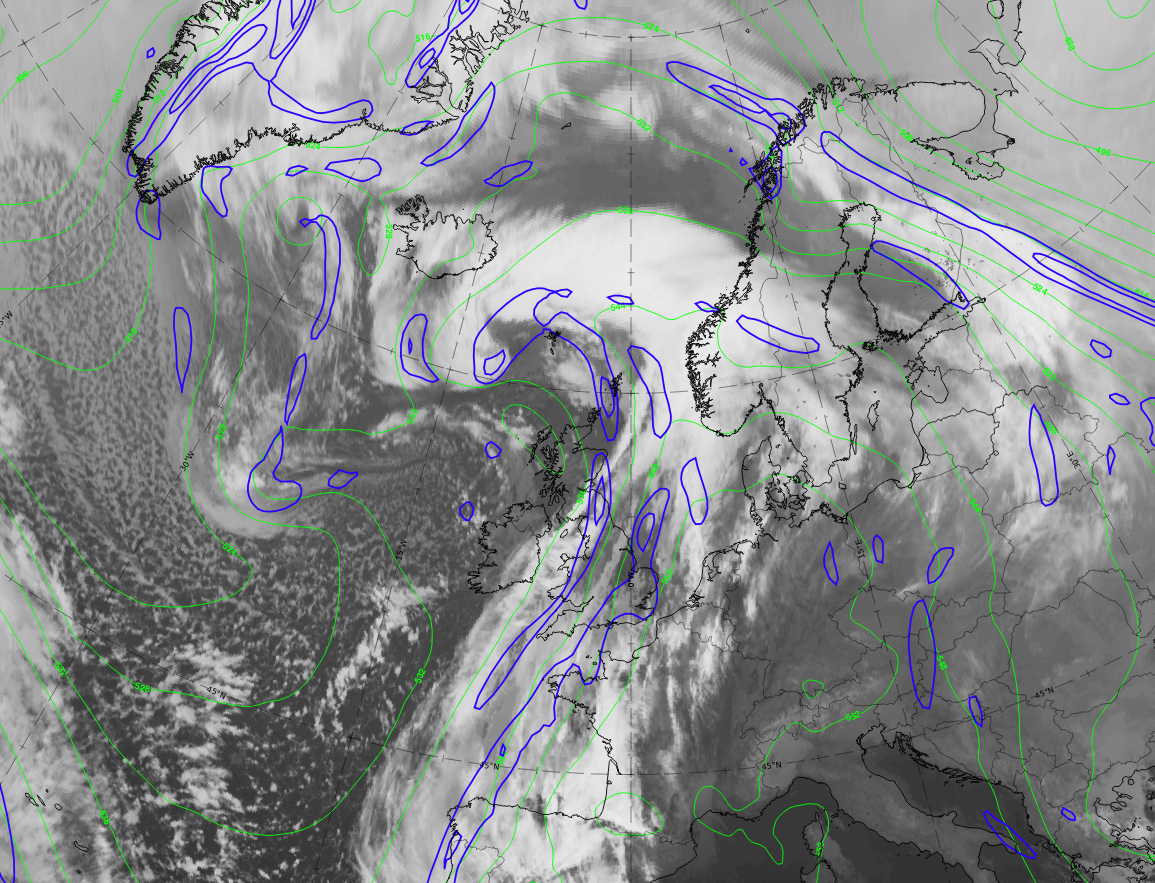
Legend: 20-21 February 2021, IR; 500-1000 hPa thickness (green); TFP (blue).
U.l.: 9 UTC on 20 February 2021, Wave stage; u.r.: 12 UTC on 21 February 2021, Intensification stage; 00 UTC on 21 February 2021, Mature stage; 12 UTC on 21 February 2021, Dissipation stage.
Note: To enlarge the image, click on it.
Note: To access the gallery of individual images click here
The main characteristics of the parameters thickness and TFP in this demonstration case are:
- The growth of the thickness bulge in the area of the cloud bulge and the occlusion spiral from the Wave stage to the Mature stage. This corresponds to the 850-hPa temperature, which shows the same behaviour at lower levels only.
- The formation of a distinct frontal pattern, of a cold front, a warm front and an occlusion front, in the TFP.
Upper-Level Parameters
- Wind speed (isotachs) - Jet streak
- There is usually a jet streak along the rear side of the cold front cloud, bending from north-west to south-west and further to north-east where it ends usually close to the wave bulge.
- In the Mature stage and the Dissipation stage, the exit region of the jet streak can be found along the inner boundary of the occlusion spiral in the centre of the low.
- In the Mature stage and the Dissipation stage, very often a second jet streak develops at the north-eastern boundary of the occlusion spiral, at the leading edge of the warm front cloud.
- Cyclonic Vorticity Advection (CVA)
- Maxima of CVA accompany the jet streak on the cyclonic side; they are the result of both, curvature and shear vorticity. In the Mature stage and the Dissipation stage, usually the CVA maximum widens and intensifies in the left exit region of the jet streak, which is mostly in the cloud-free centre of the low; but it can also extend a bit into the cloud band.
- Potential Vorticity (PV): Height at which PV >= 1.5 units (PVU).
- As frontogenesis is connected with a tropopause folding, stratospheric air protrudes downward below the cold front. This is reflected in a high gradient of PV >= 1.5 PVU height along the cold front and a developing wave bulge separating high values (high tropopause) within the cloud systems from low values (stratospheric air) behind. These areas of stratospheric air can be found close to and at the rear of the wave bulge. The 1.5 PVU heights can be as low as approximately 500 hPa.
- During the Mature stage and the Dissipation stage, a centre of closed isolines can be found in the centre of the cloud spiral, representing sharply increasing values, which means that a tunnel of PV from the tropopause to very low altitudes has developed. This is a consequence of the mutual intensification of vorticity rotation as the stratospheric air protrudes downward. (Meteorological-physical background).
Legend:
Schematics of upper-level parameters.
U.l.: isotachs at 500 hPa (yellow), maxima cyclonic vorticity at 500 hPa (red); r.: contours of 1.5 PVU heights (magenta).
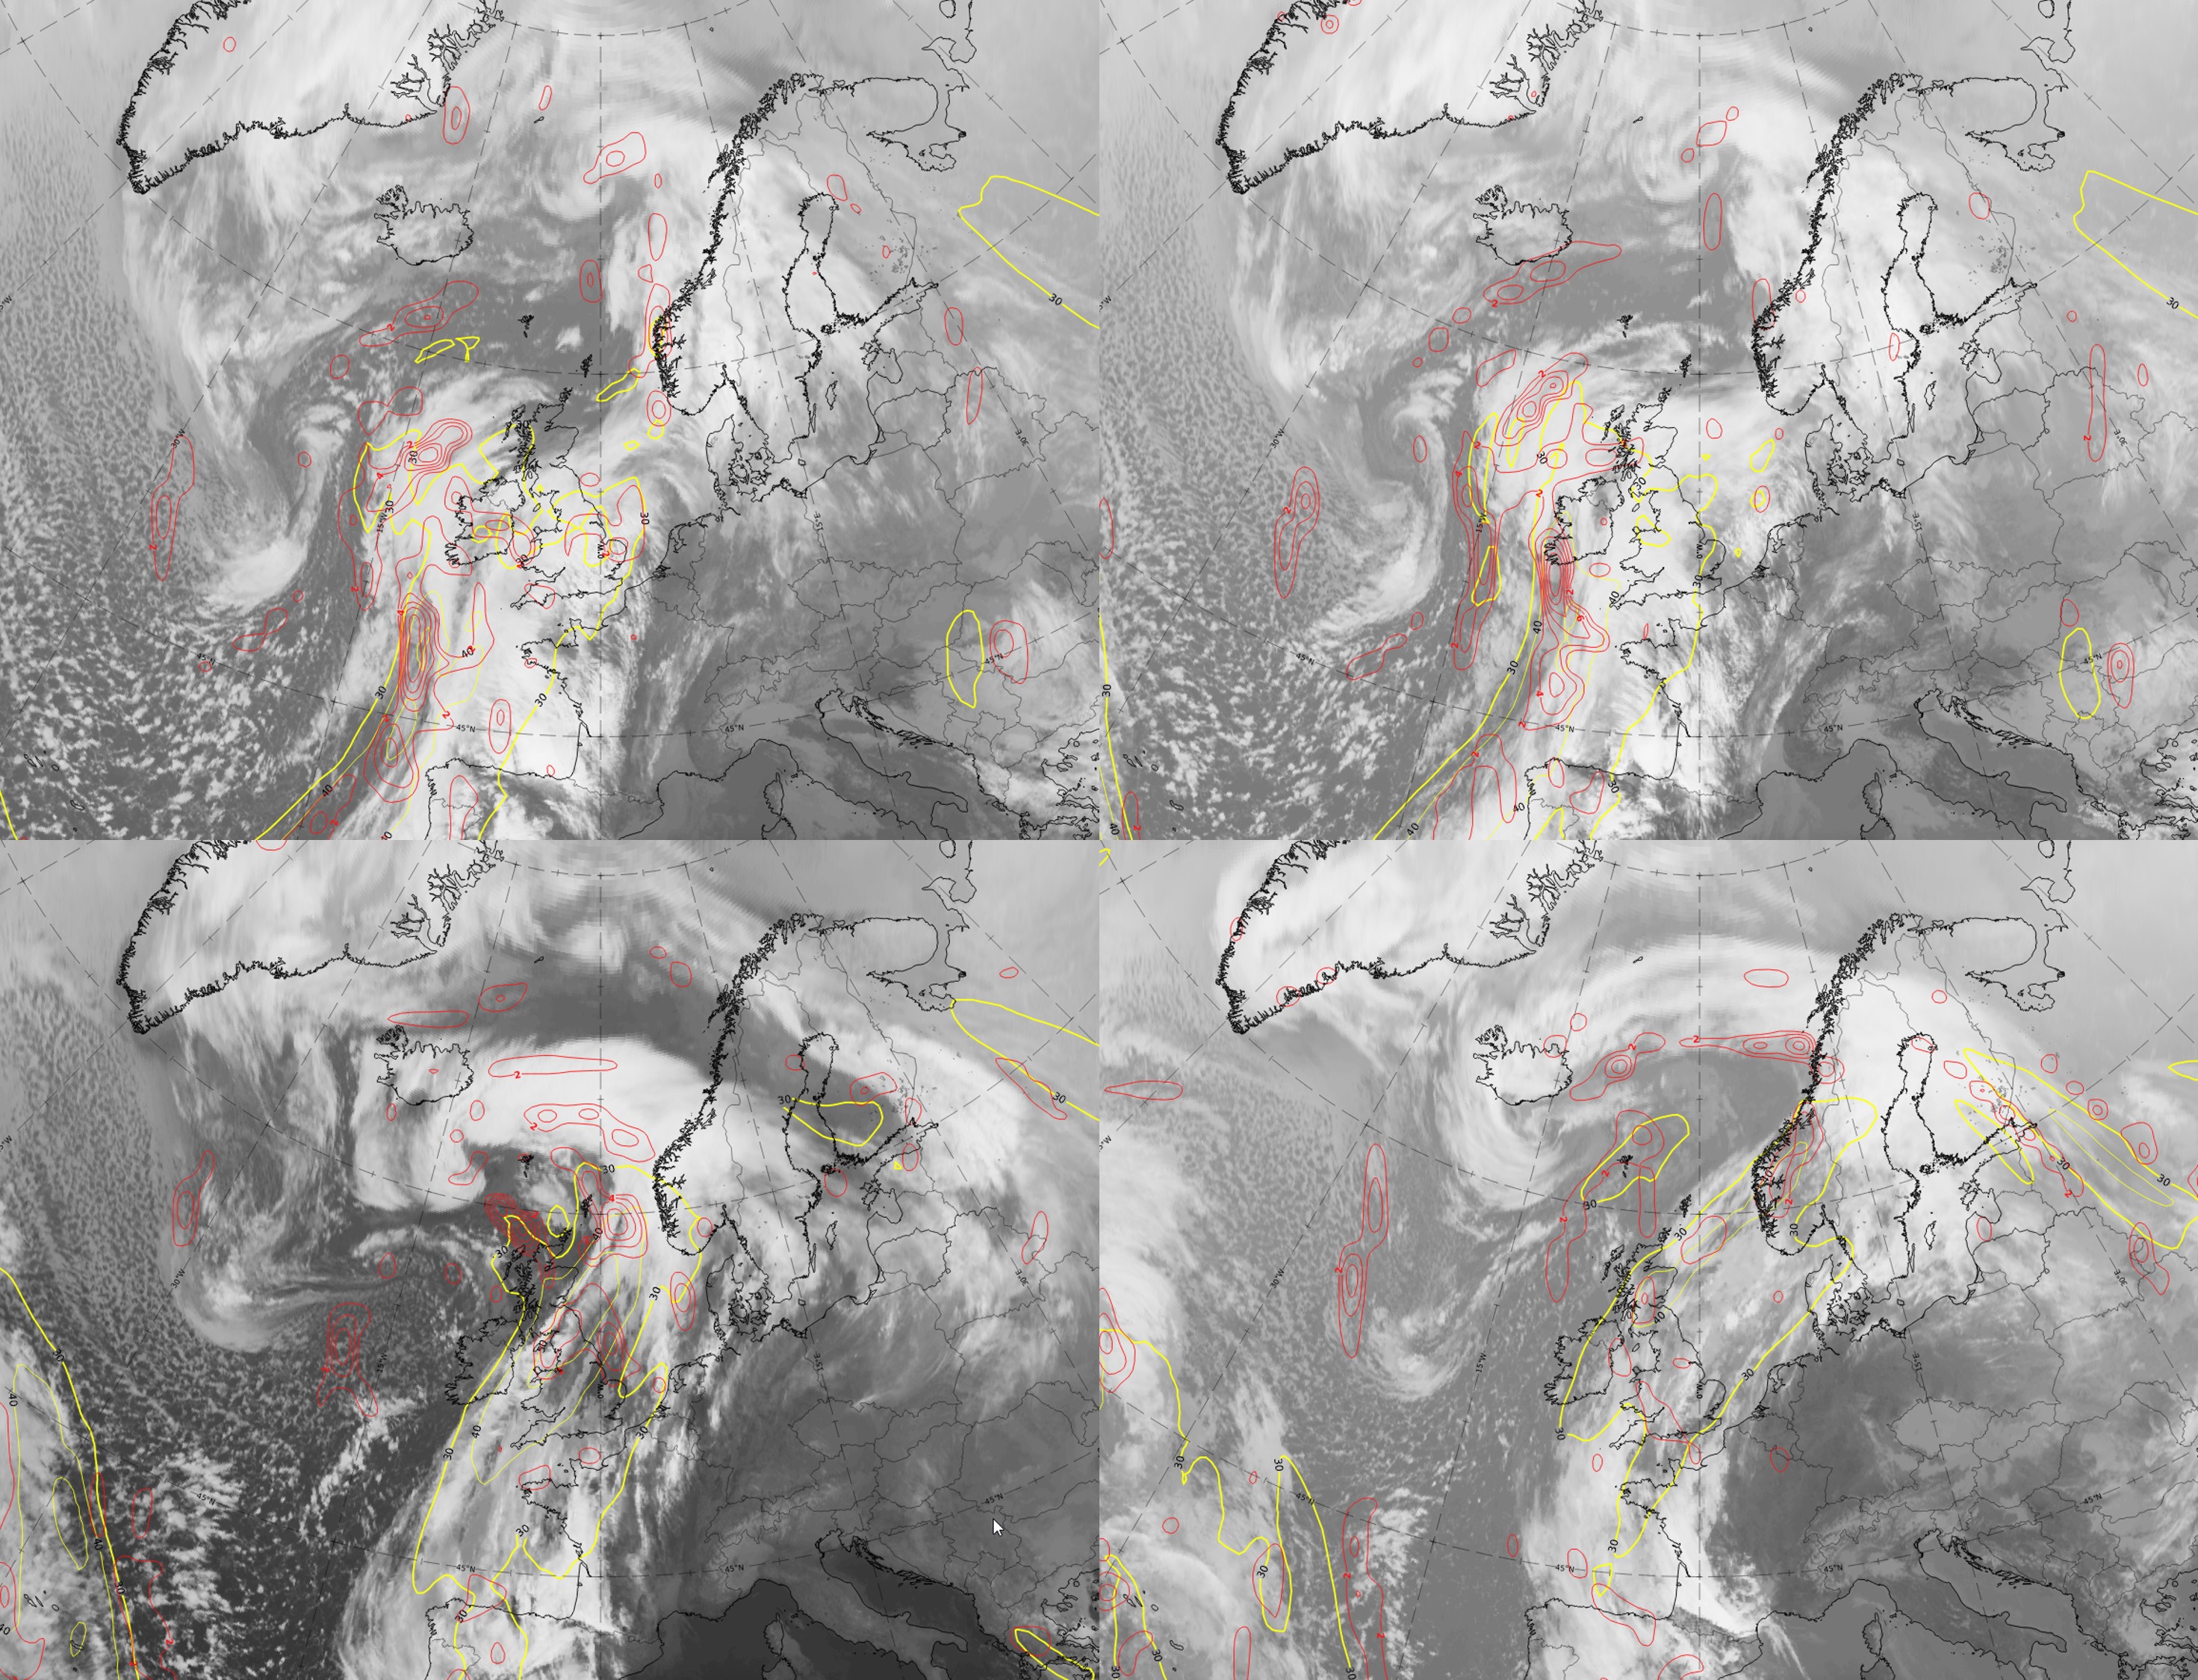
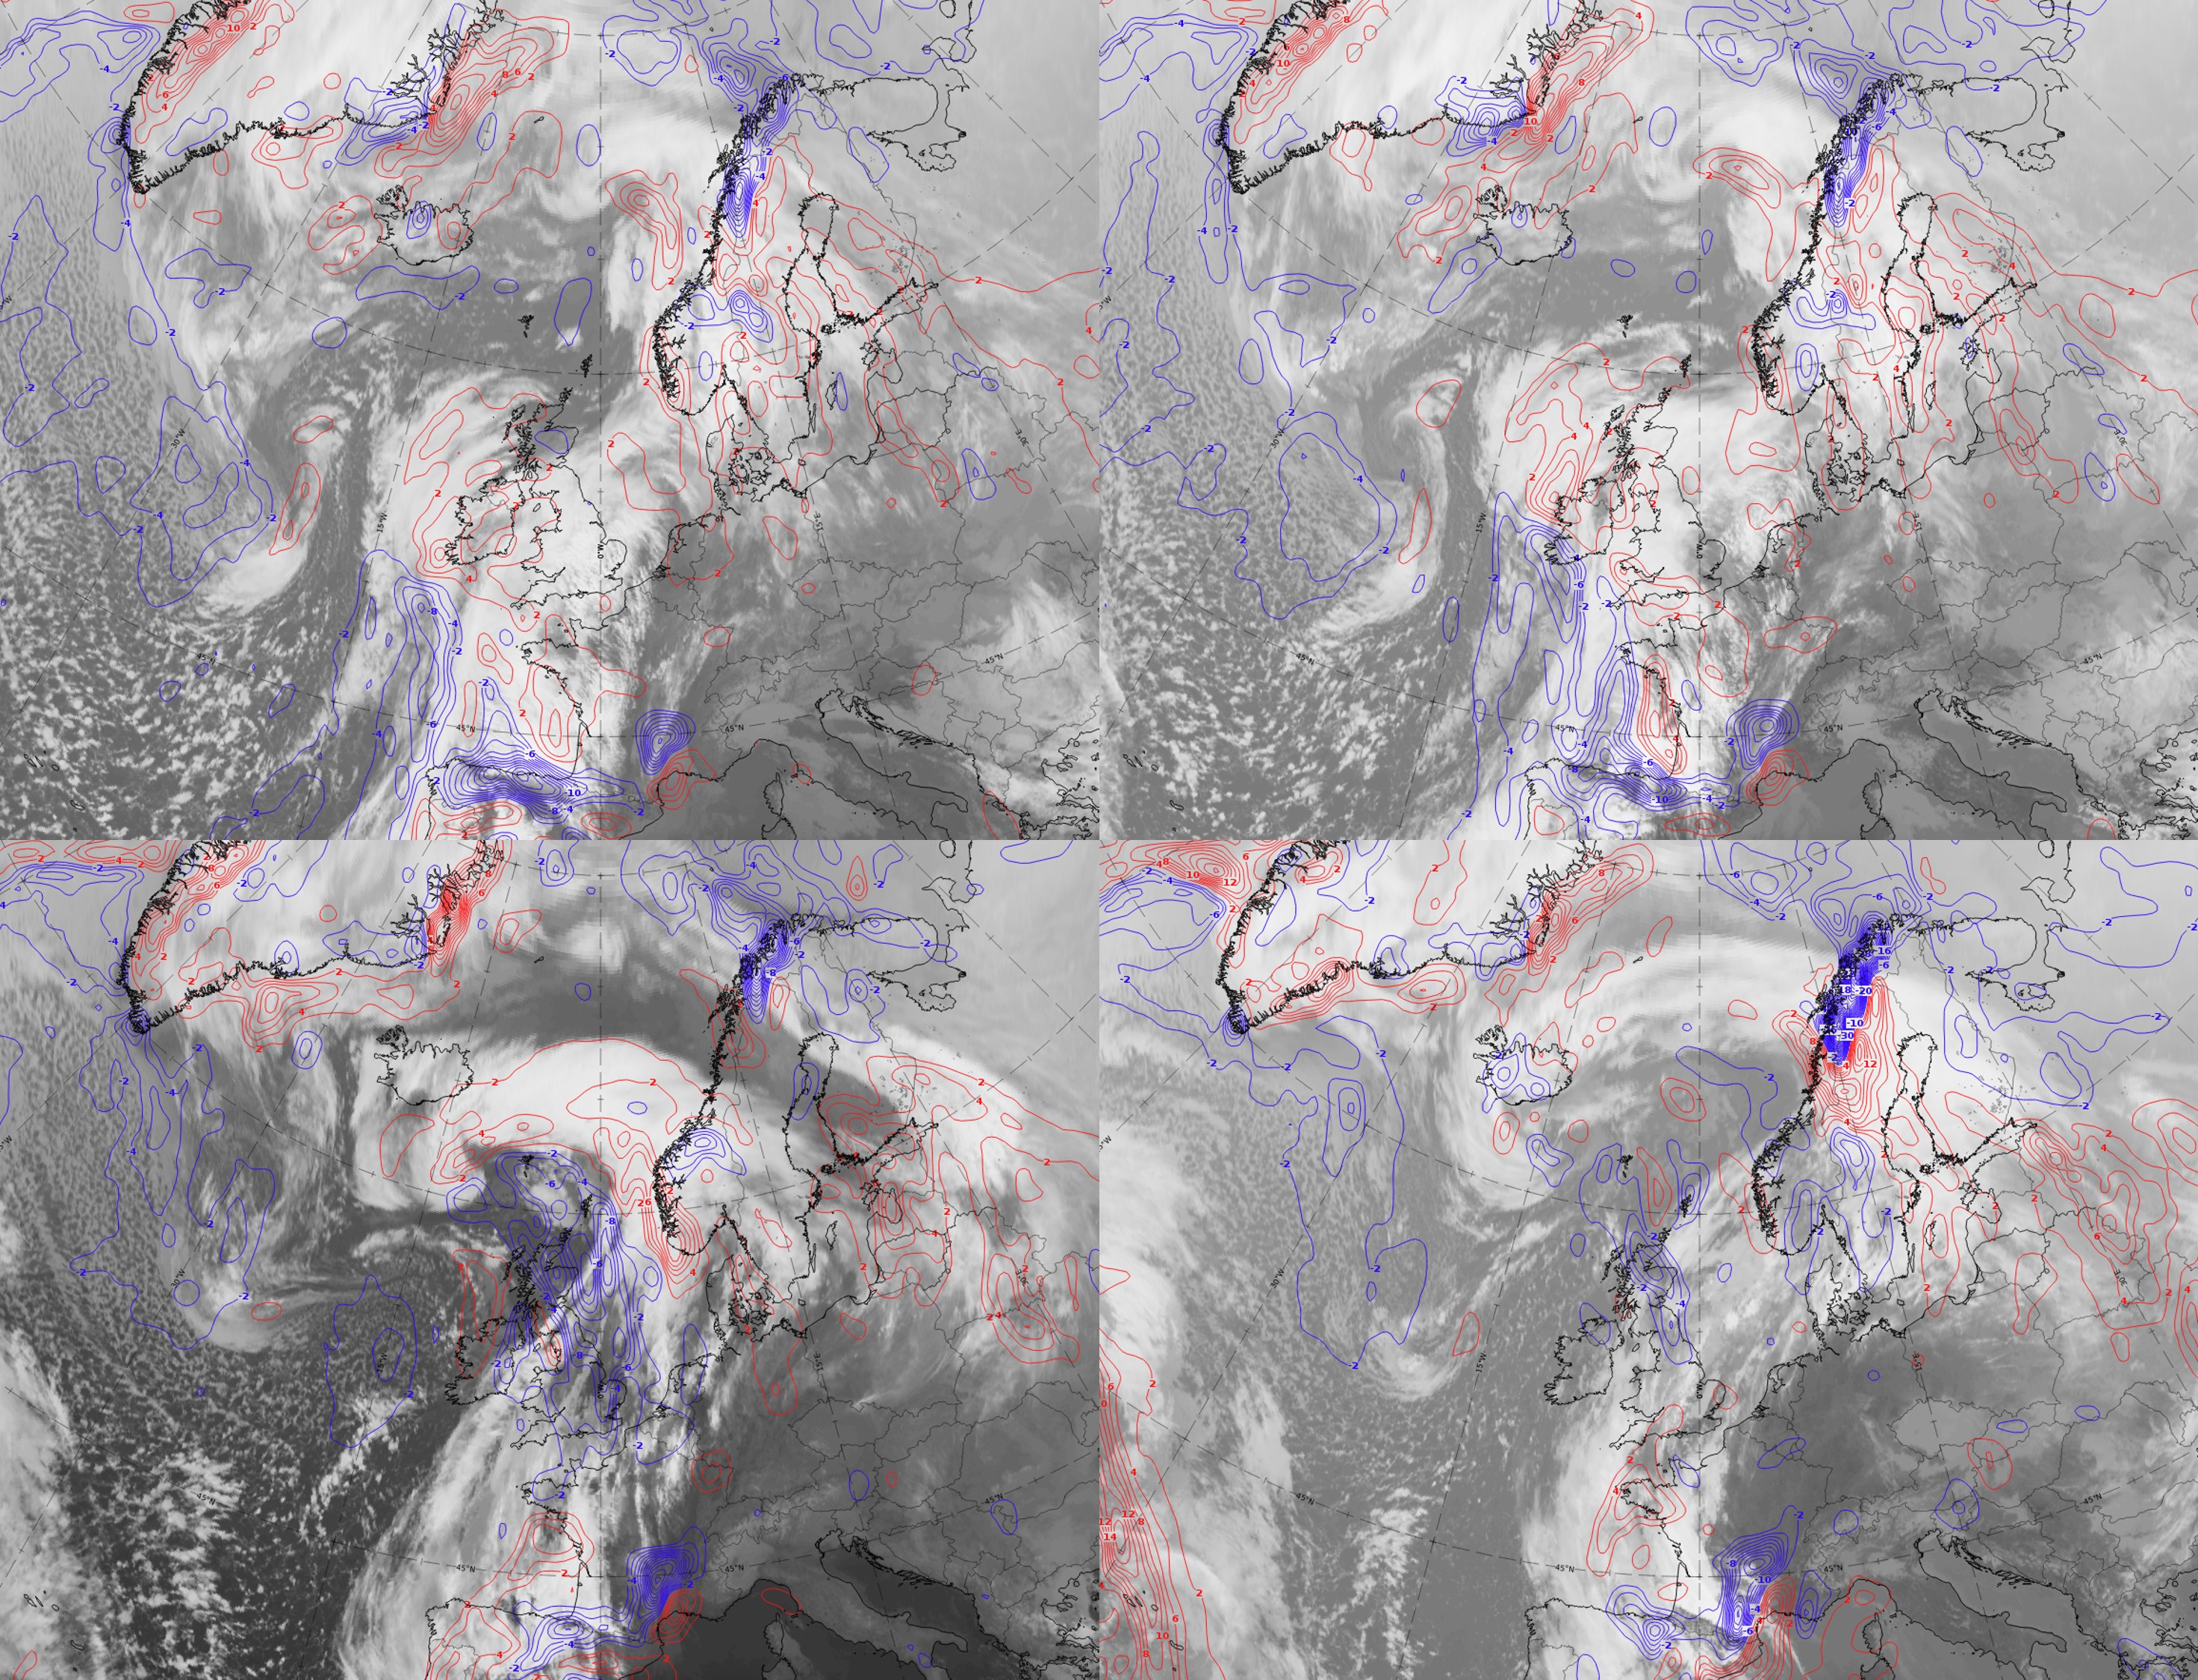
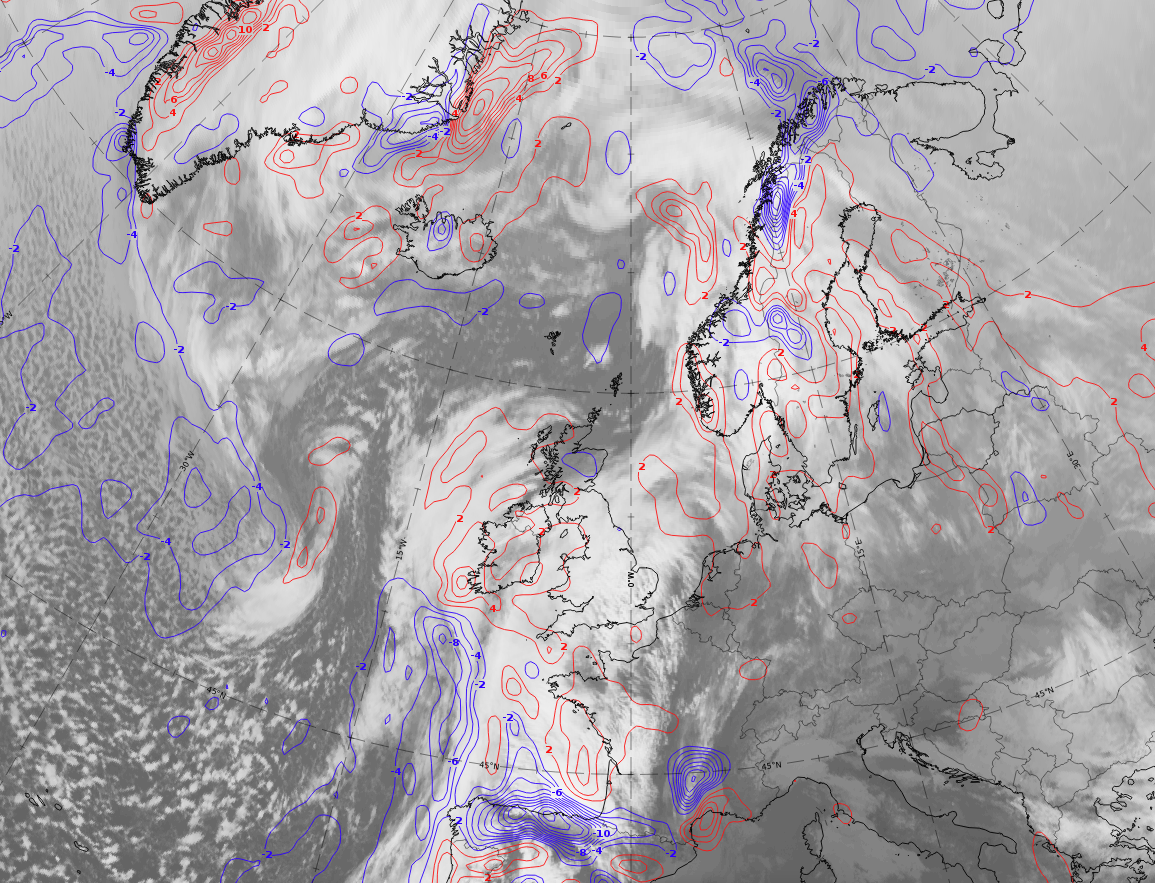
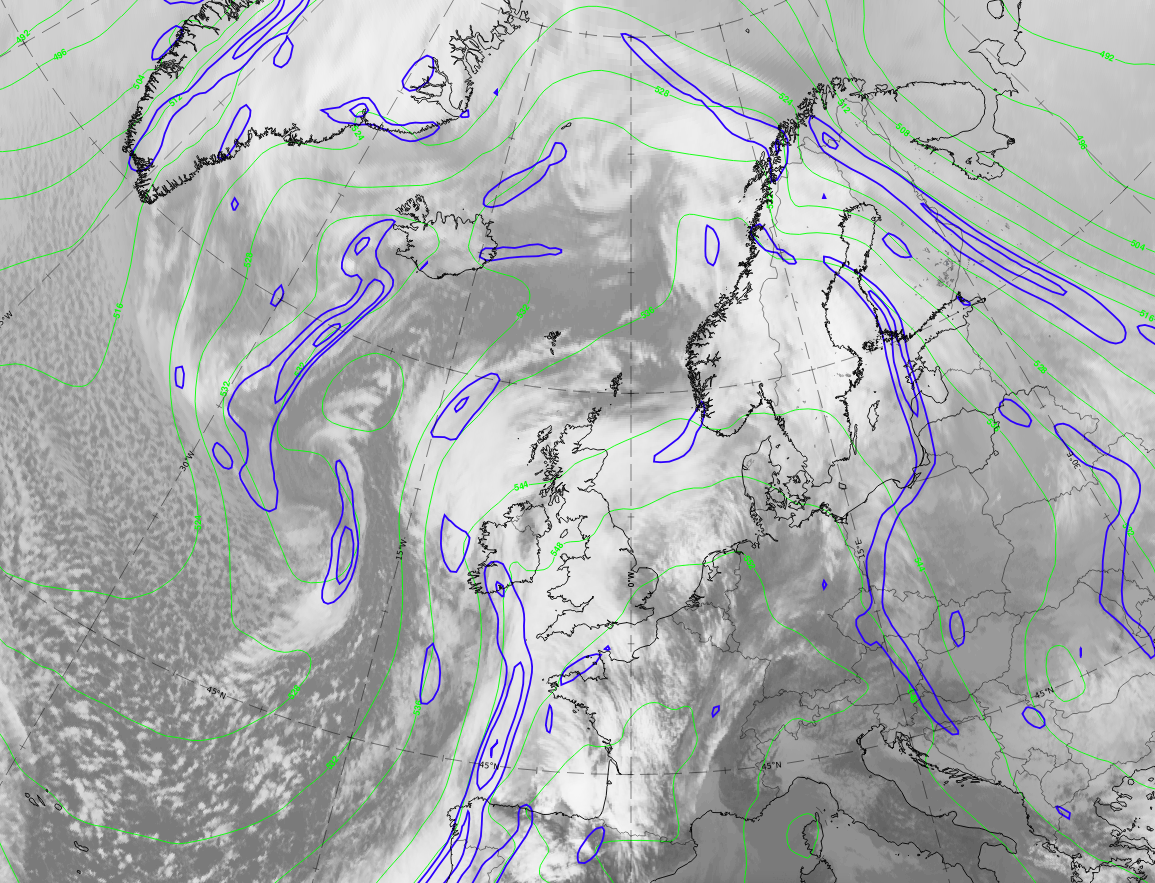
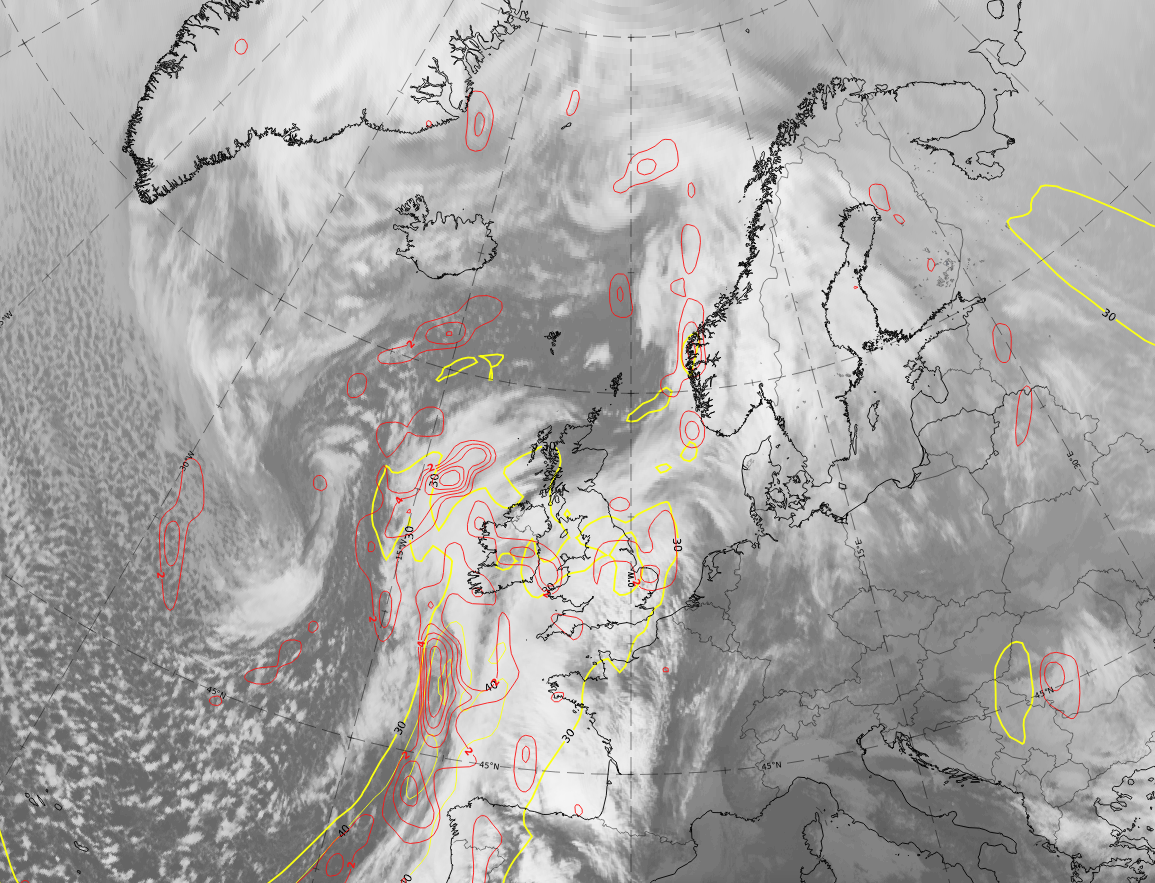
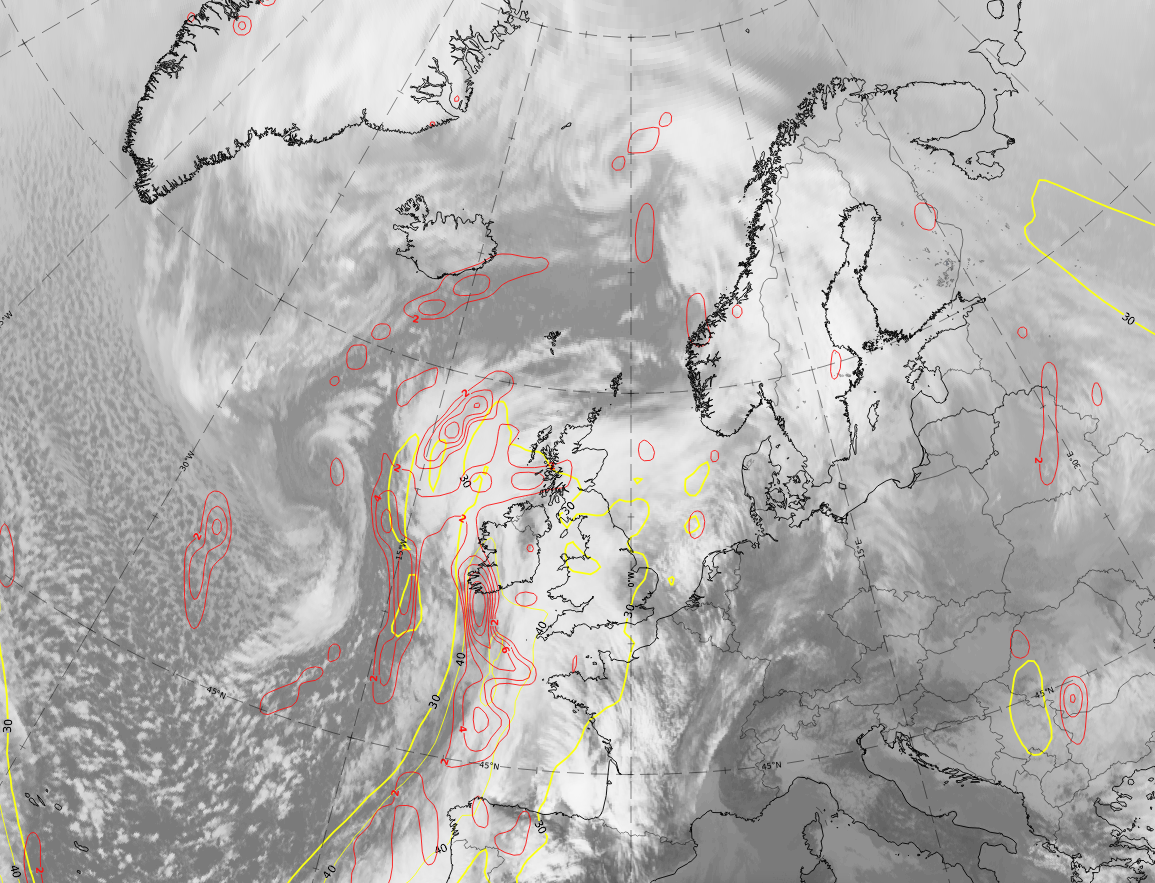
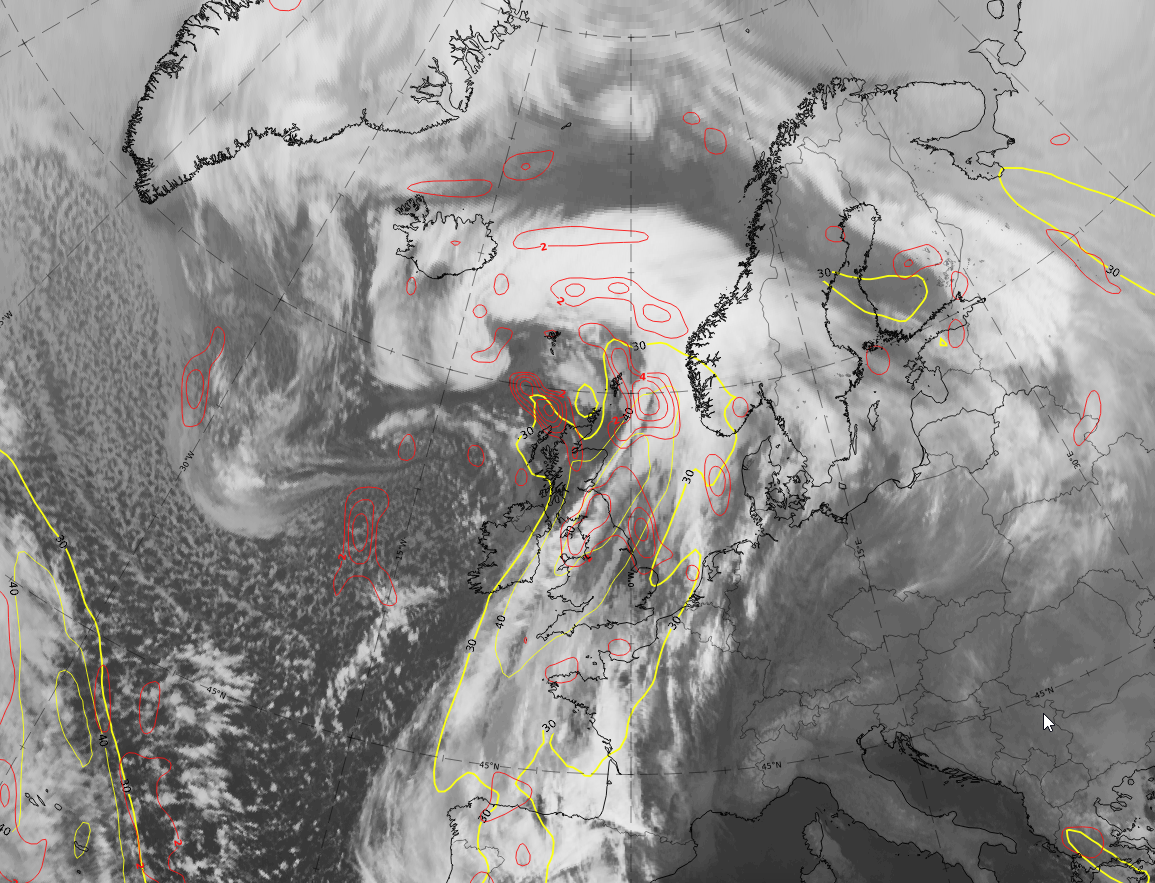
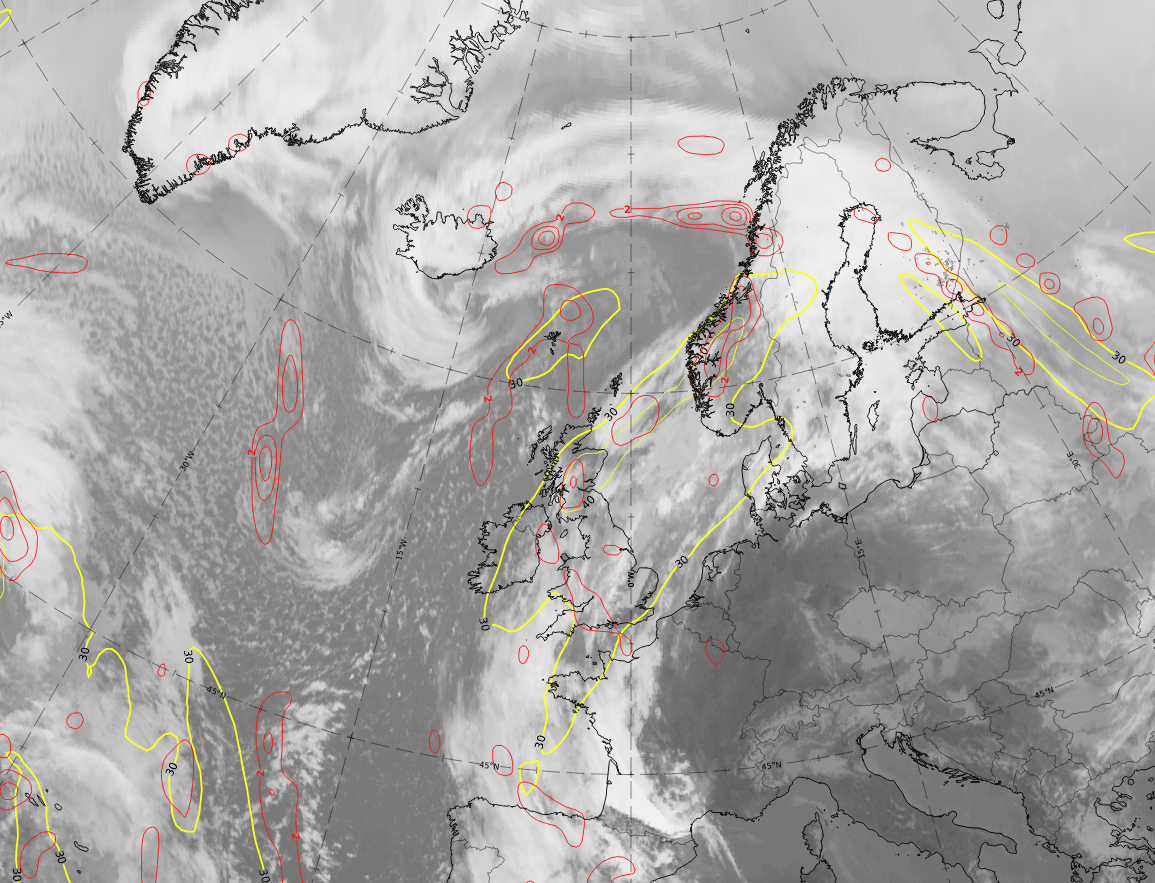
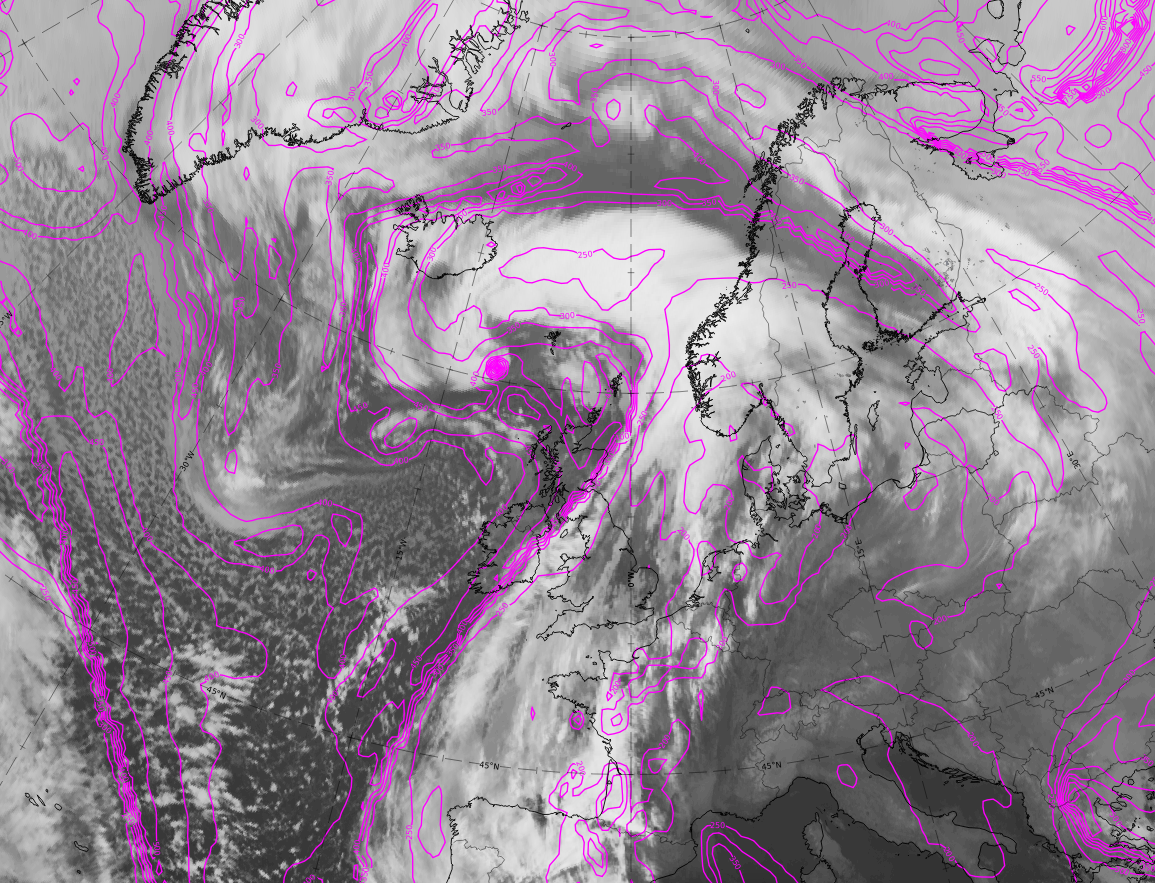
Legend: 20-21 February 2021, IR; isotachs at 500 hPa (yellow); CVA maxima at 500 hPa (red).
U.l.: 9 UTC on 20 February 2021, Wave stage; u.r.: 12 UTC on 21 February 2021, Intensification stage; 00 UTC on 21 February 2021, Mature stage; 12 UTC on 21 February 2021, Dissipation stage.
Note: To enlarge the image, click on it.
Note: To access the gallery of individual images click here
The isotachs in yellow show the typical jet streak along the rearward edge of the cold front cloud band, in this case with a double structure, which is a consequence of the history of the case: the merging of two frontal systems. Less well pronounced in this case, is the jet streak at the leading edge of the warm front.
The cyclonic vorticity isoline field is in most real cases much more structured, as presented in the schematic. This is because also small structures within the height fields appear much more clearly in the derived field of vorticity (curvature- and shear vorticity) and its related vorticity advection. In this demonstration case, a band of strong cyclonic vorticity advection accompanies the jet streak centre. This can be seen very clearly in the Wave stage and the Intensification stages along the rear edge of the cold front cloud. The maximum in the left exit region is the most significant meteorological feature in the CVA field, and is the result of curvature and shear in the jet streak exit region. Such an intense CVA maximum occurs in this case in the exit region moving from south-west of Ireland across Ireland and Scotland into the Norwegian Sea and over southern Norway.
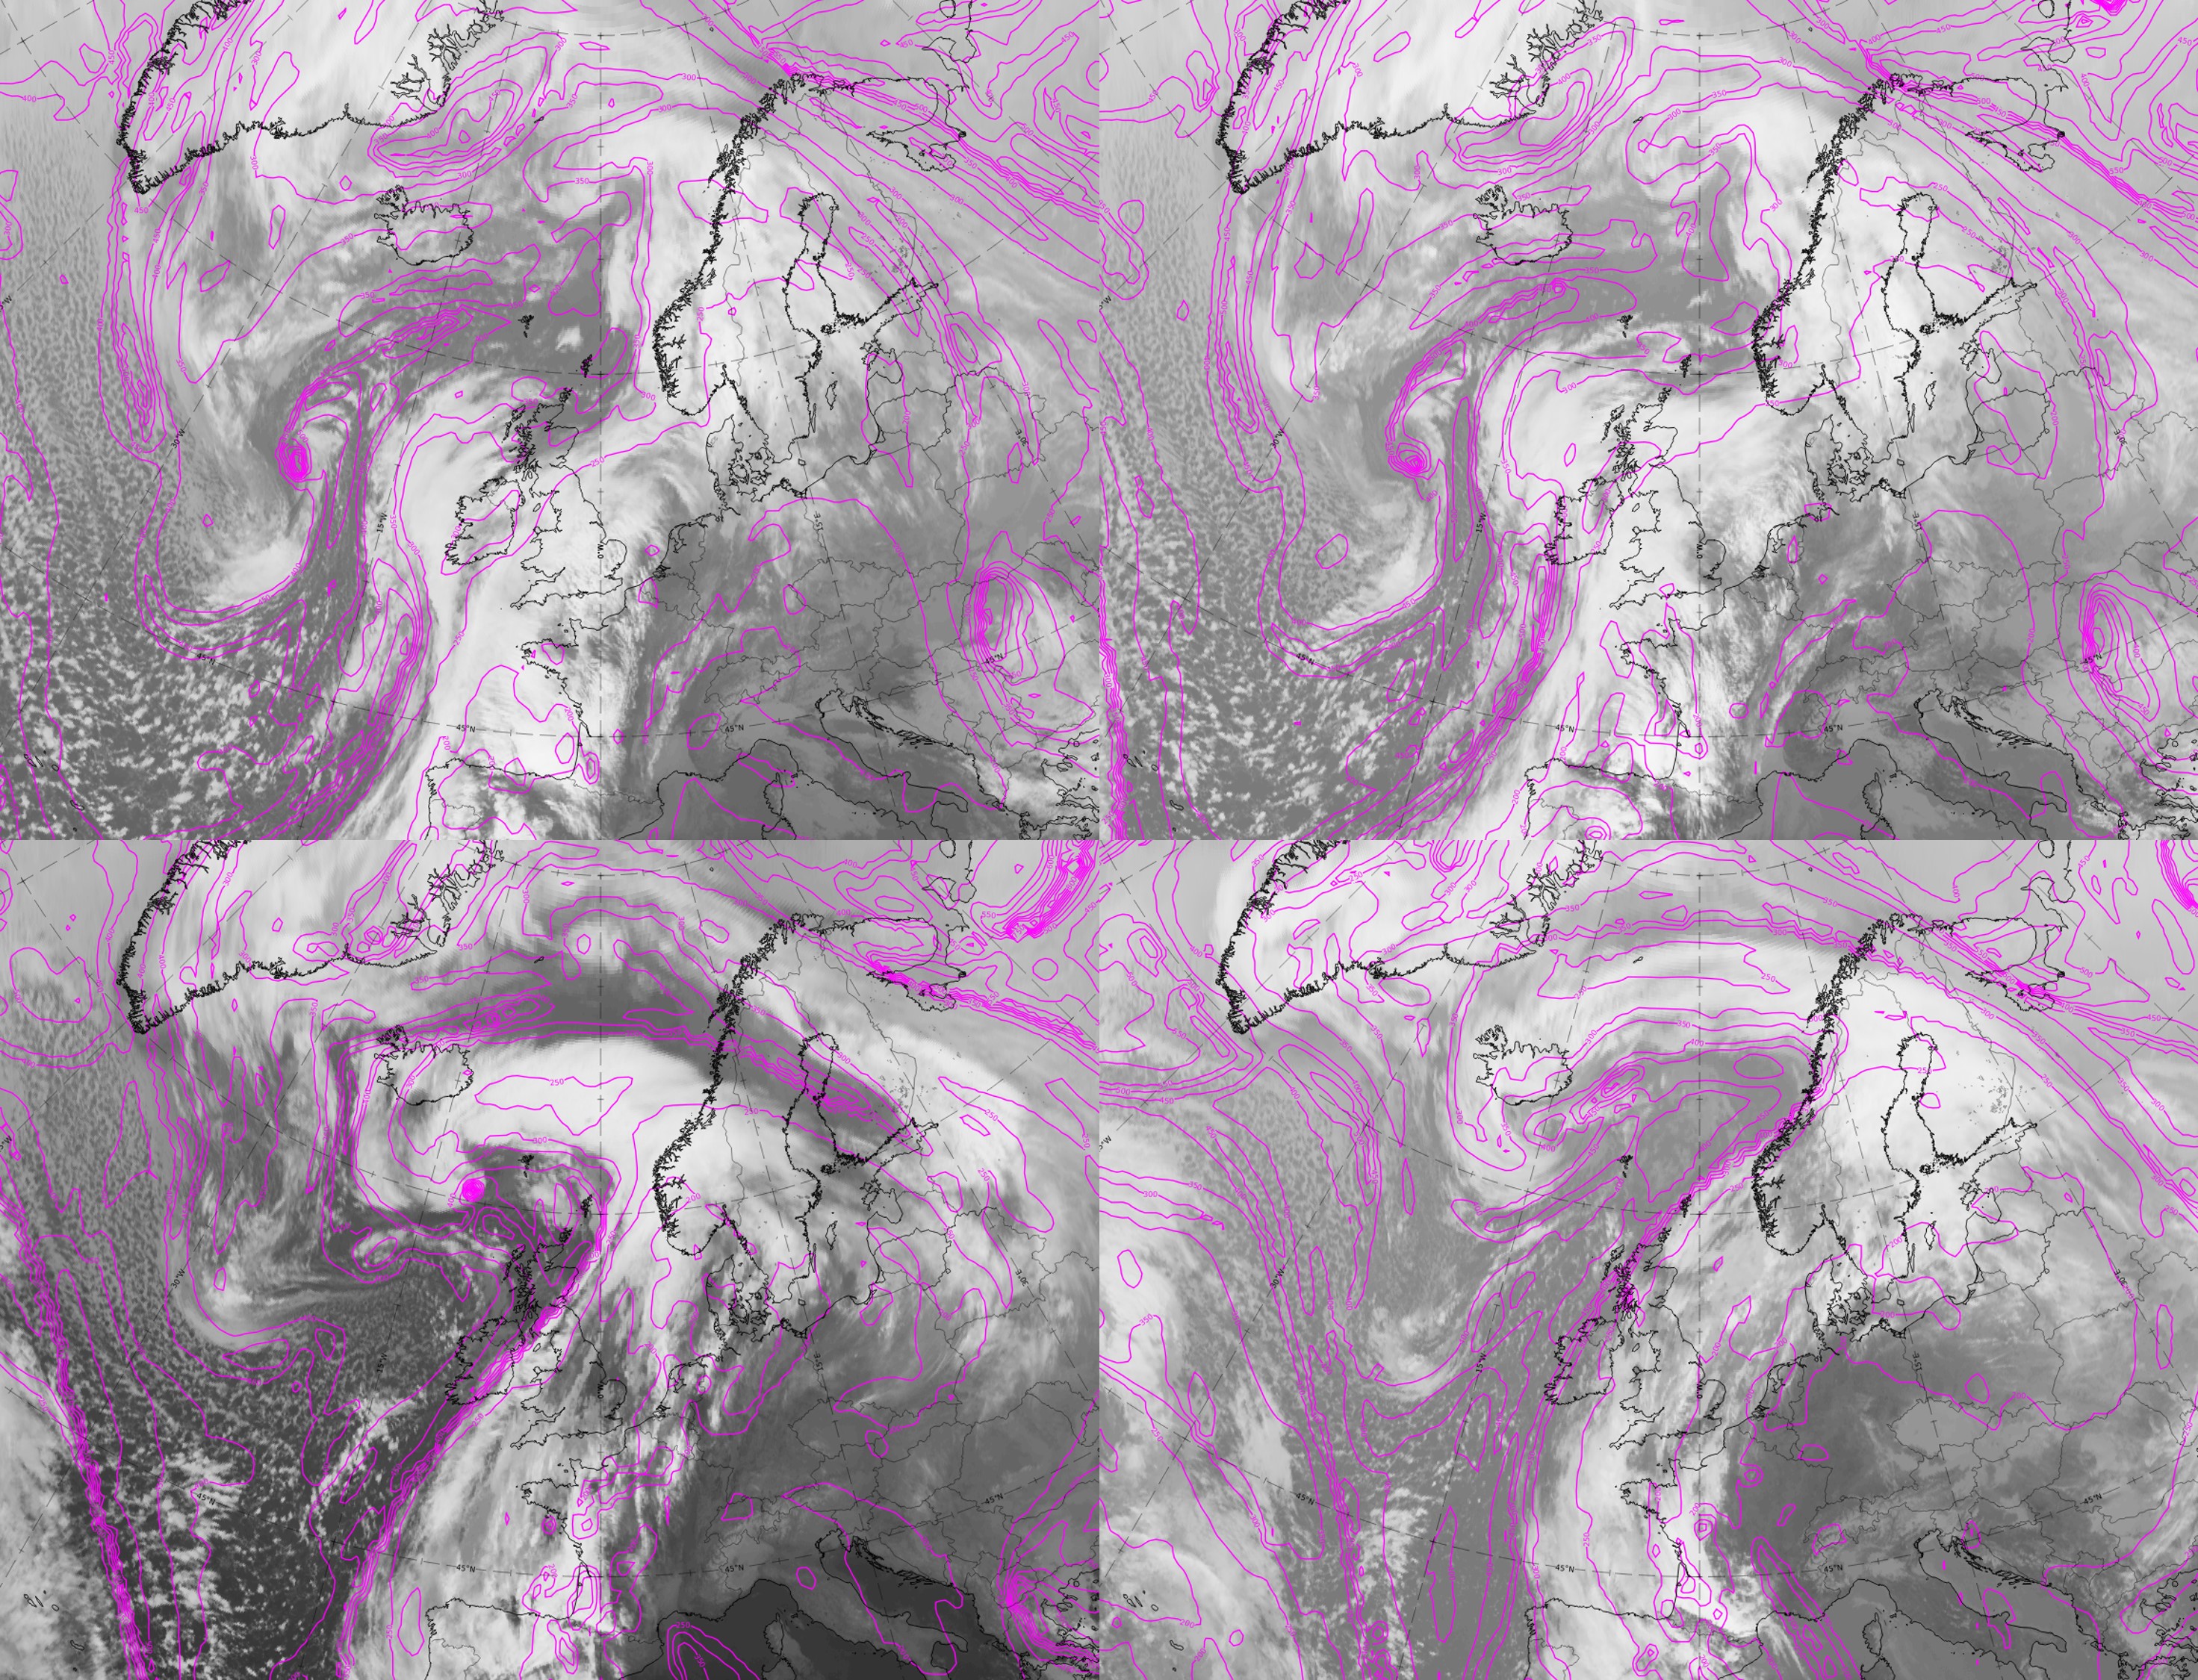
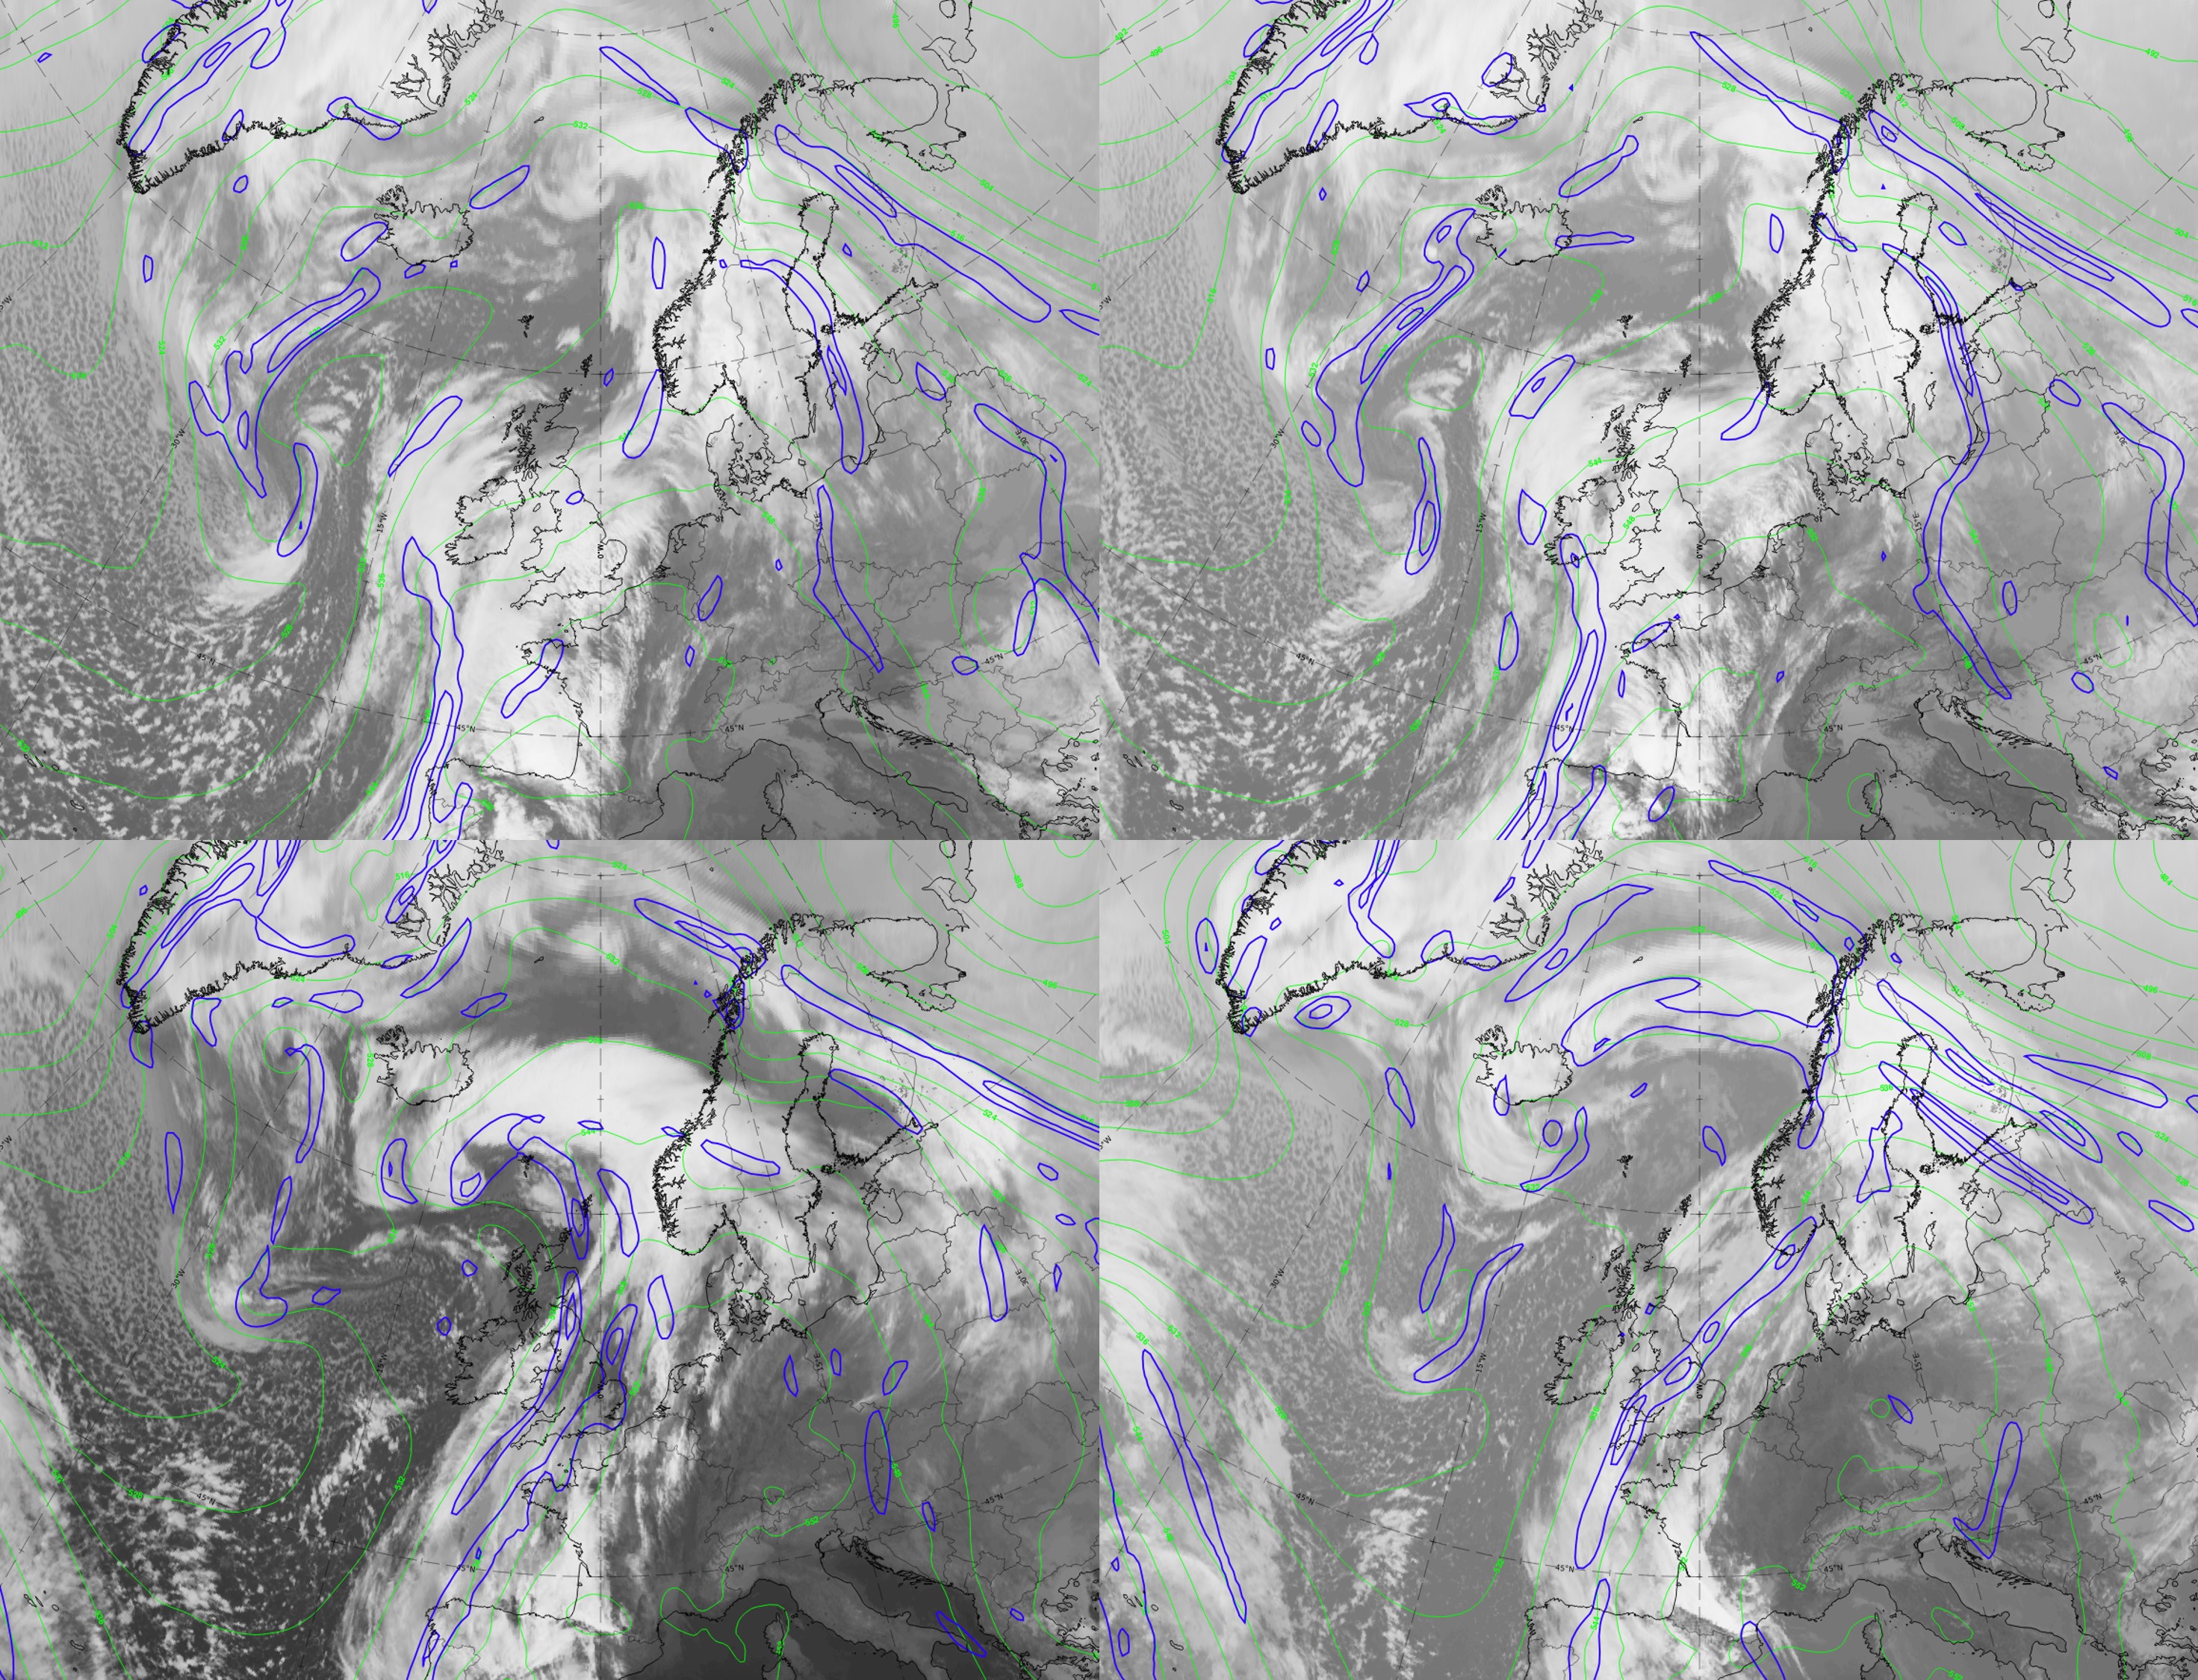
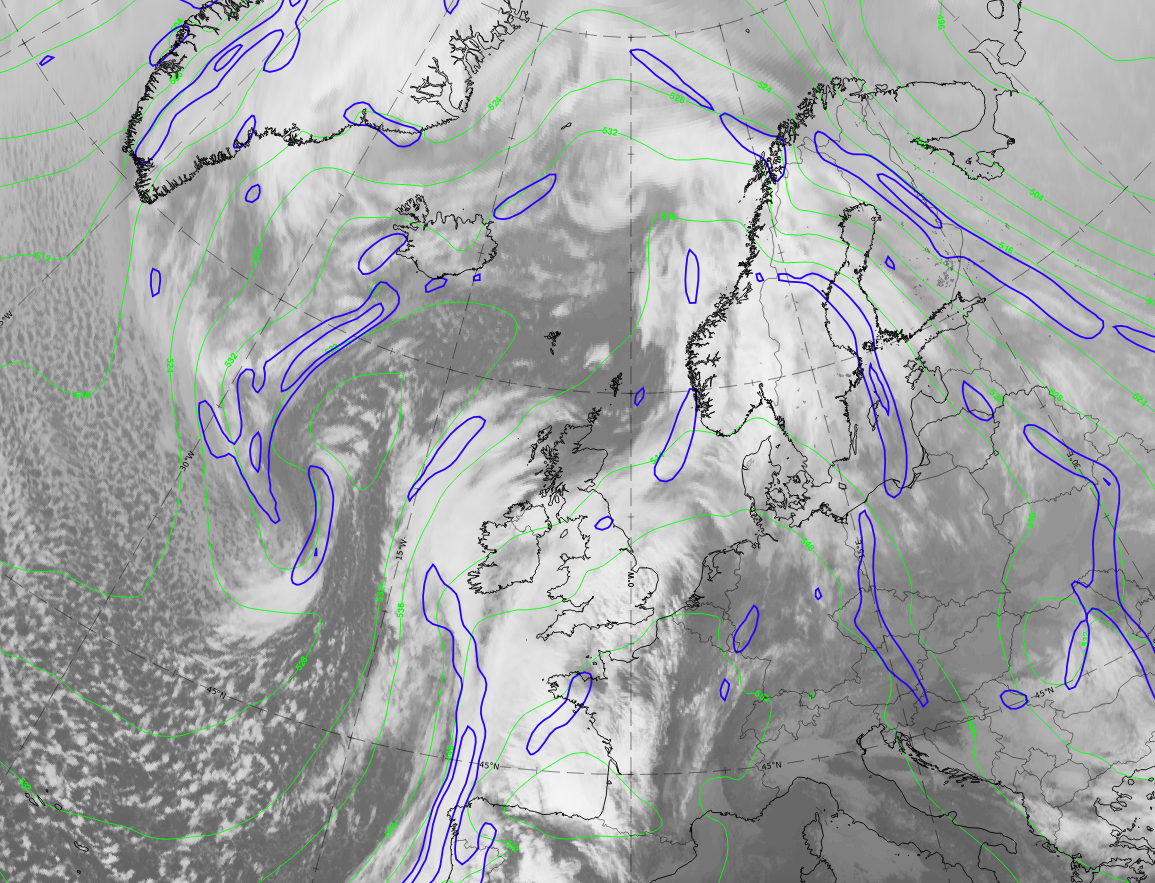
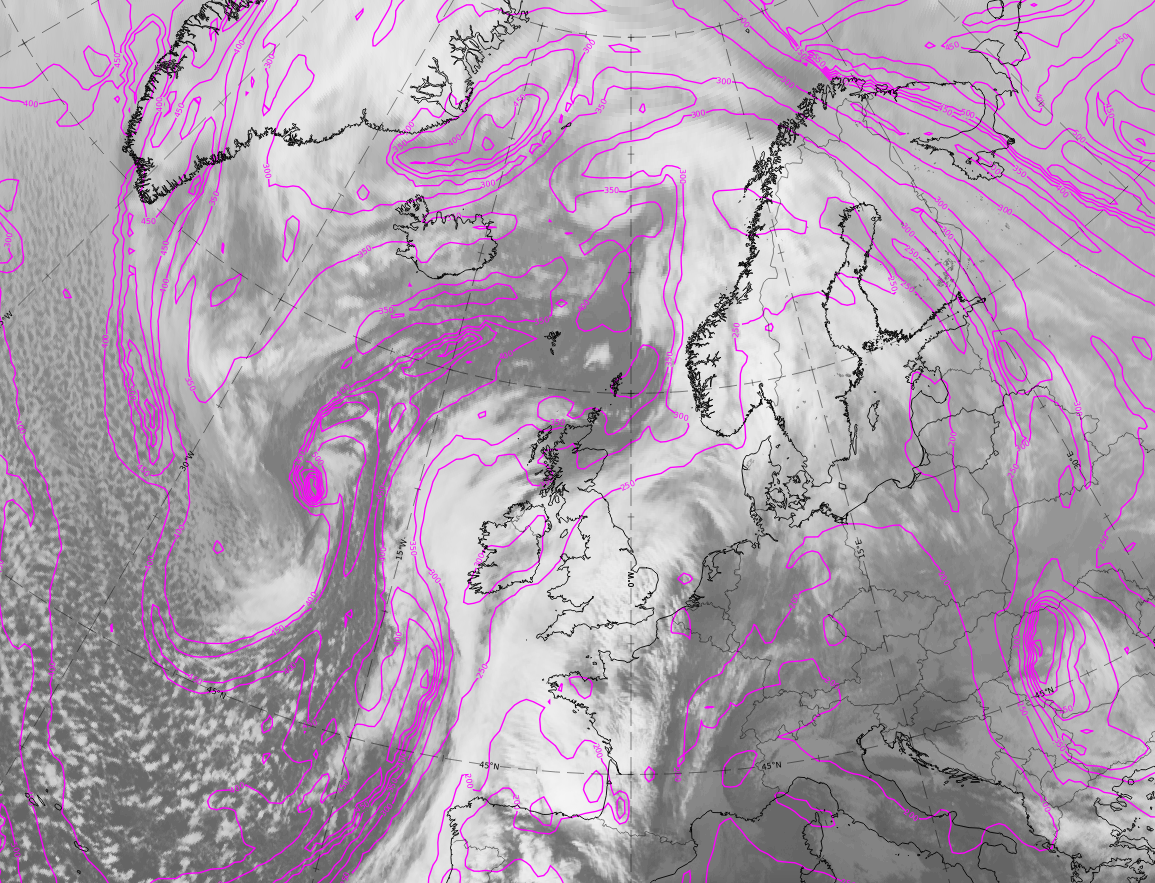
Legend: 20-21 February 2021, IR; height at which PV is >=1.5 PVU.
U.l.: 9 UTC on 20 February 2021, Wave stage; u.r.: 12 UTC on 21 February 2021, Intensification stage; 00 UTC on 21 February 2021, Mature stage; 12 UTC on 21 February 2021, Dissipation stage.
Note: To enlarge the image, click on it.
Note: To access the gallery of individual images click here
The main characteristics of PV >= 1.5 PVU height in this demonstration case are:
- In all four stages the difference between the high values of tropopause (where PV = 1,5 PV units) in the cloud bands and the low tropopause in the cold air behind is very clear.
- The boundary between the two systems is at a height of about 250 hPa.
- In the Wave stage and the Intensification stage, stratospheric extends down to a height of 500-550 hPa.
- In the Mature stage, there are small areas in the spiral centre where a tube of stratospheric air extending from upper levels down to 800 hPa has developed. This is usually formed by a combination of the sinking stratospheric air and intensification of rotation in the low layer.
- In the Dissipation stage, the lowest height reached by stratospheric air is 600 hPa.