Key Parameters
In this chapter the key parameters of Cold Front in Cold Advection reaching from Denmark towards the southwest are described and compared to the corresponding parameters of a Cold Front over Scotland.
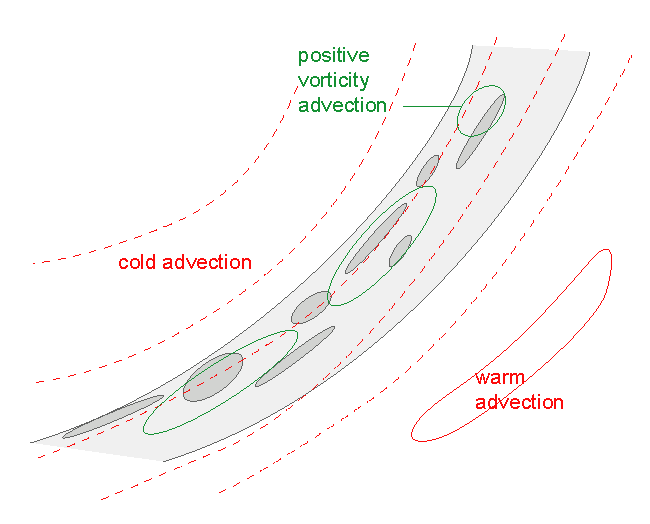
Positive vorticity advection at 500 hPa and temperature advection at 700 hPa:
- In a CF in CA there is a maximum of PVA over the rear edge of the cloud band.
- In a CF in CA there is cold advection over the whole frontal cloudiness as well as behind it. Ahead of the front the temperature advection is usually negligible.
- In a CF there is warm advection ahead of the cloud band and strong cold advection behind it. The cloud band is mostly under cold advection.
|
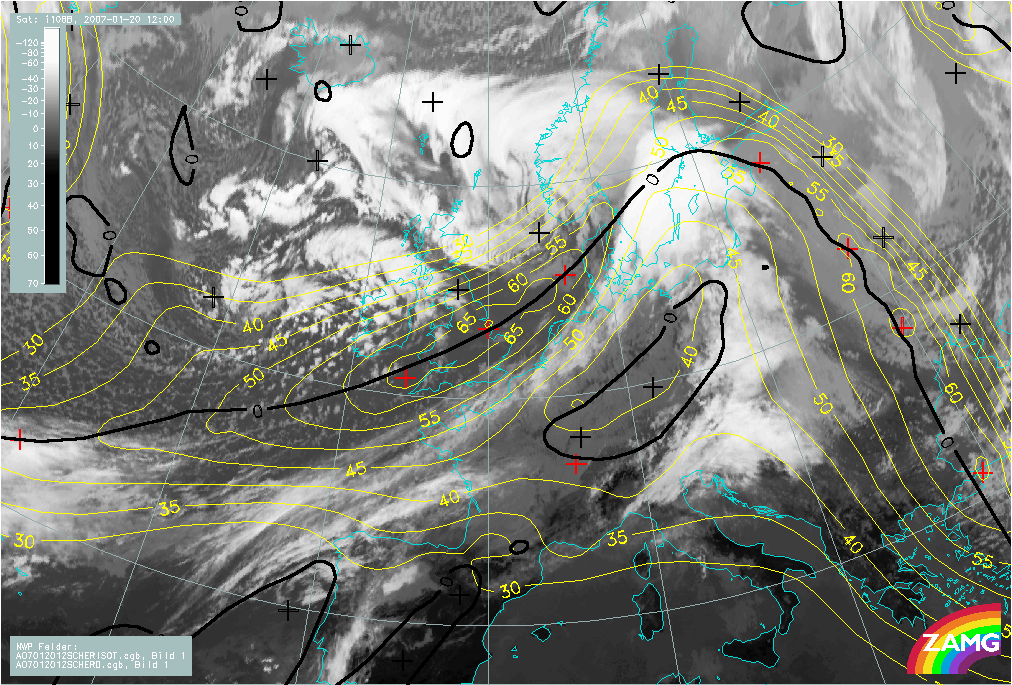
20 January 2007/12.00 UTC - Meteosat 8 IR 10.8 image; green: PVA 500 hPa, red: temperature advection 700 hPa
|
|
|

|
|
|
|
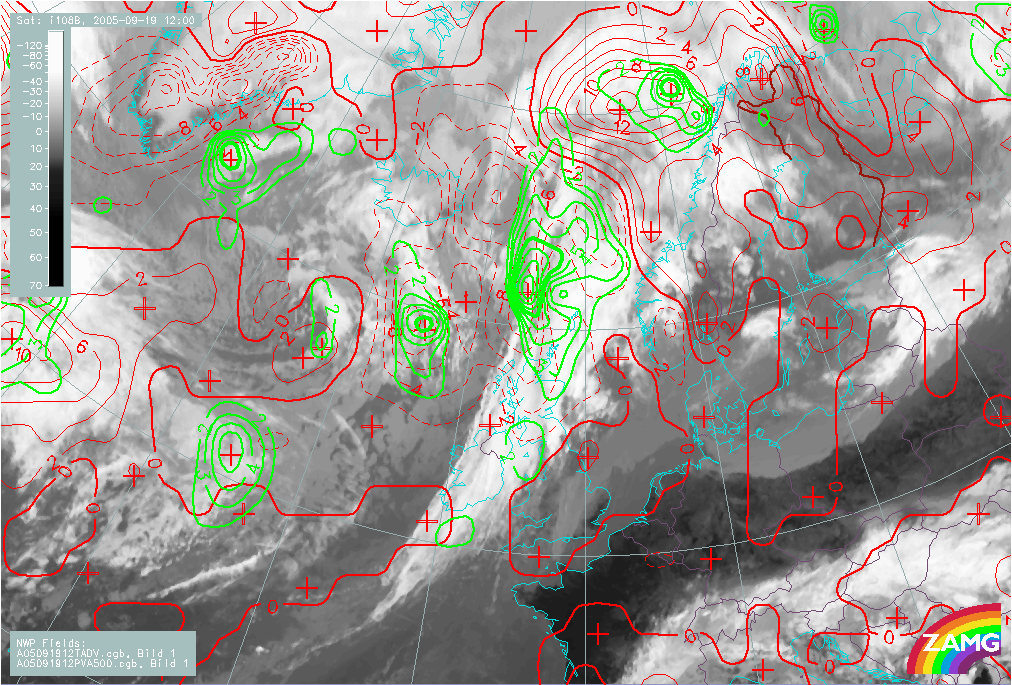
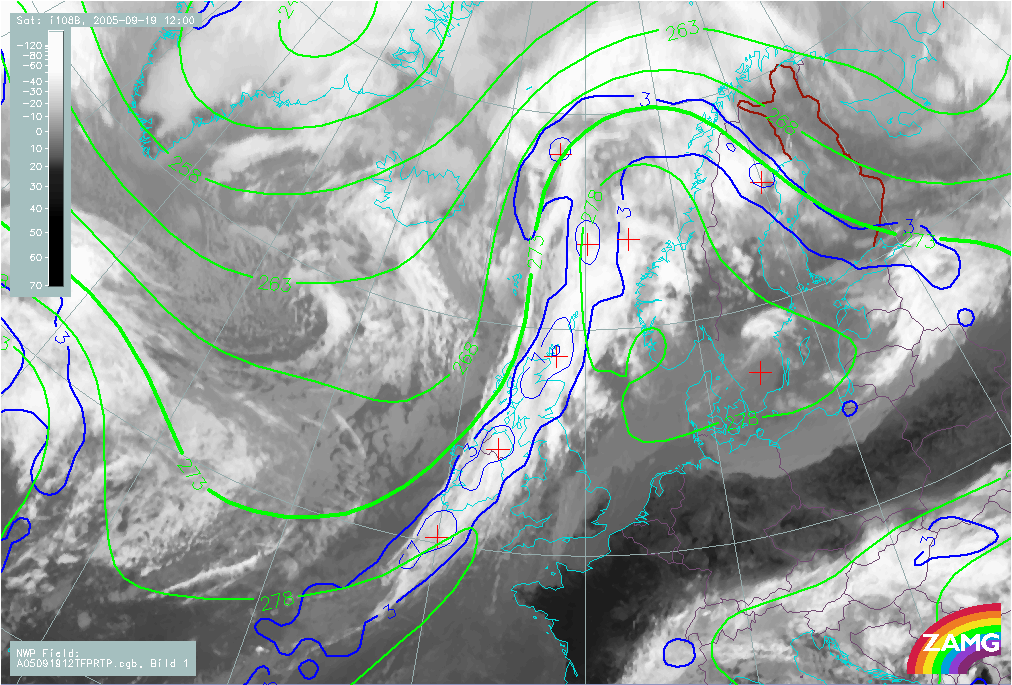
19 September 2005/12.00 UTC - Meteosat 8 IR 10.8 image; green: PVA 500 hPa, red: temperature advection 700 hPa
|
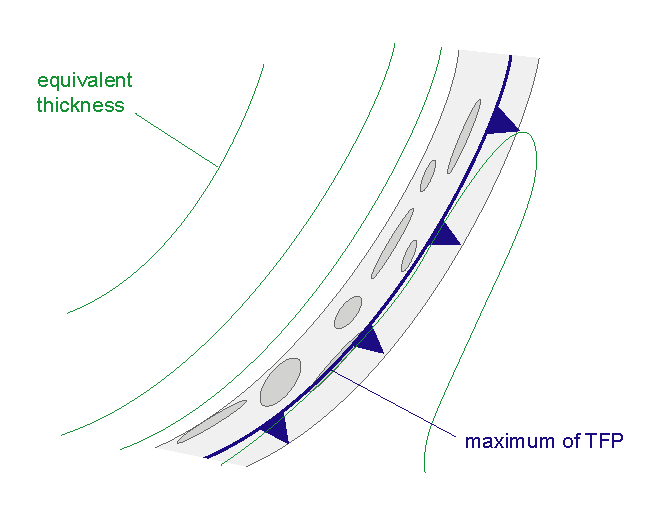
Thermal frontal parameter and equivalent thickness:
- TFP accompanies the cloud band in both cases, although in CF in CA it is weaker.
- Equivalent thickness shows a crowding zone near the rear edge of the cloud band, and a ridge ahead of it.
|
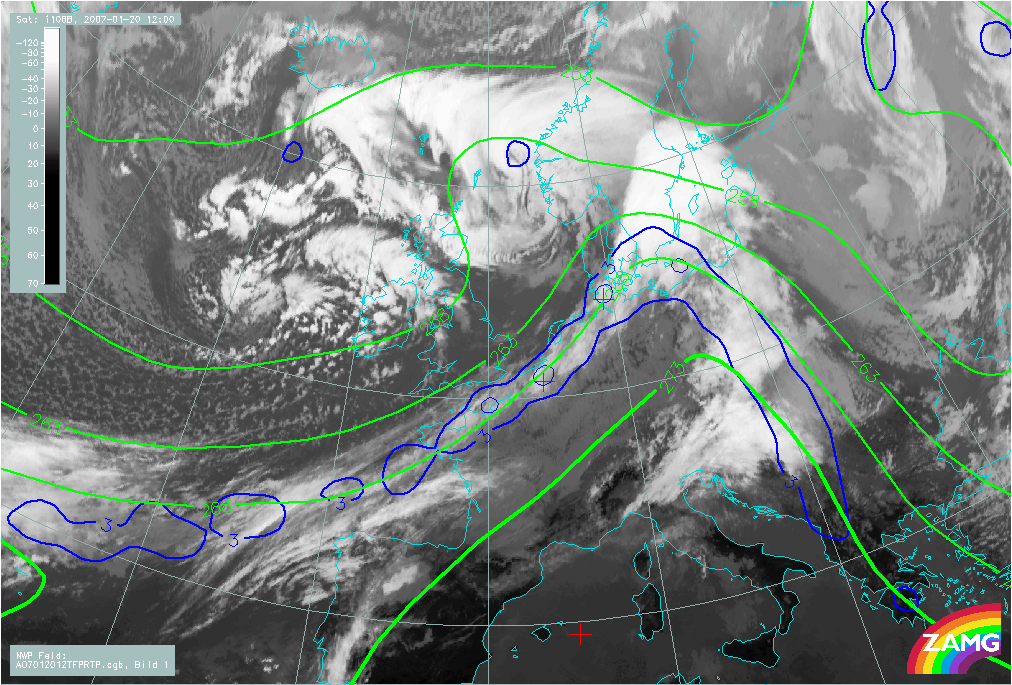
20 January 2007/12.00 UTC - Meteosat 8 IR 10.8 image; blue: TFP, green: equivalent thickness
|
|
|
|
|
|
|
19 September 2005/12.00 UTC - Meteosat 8 IR 10.8 image; blue: TFP, green: equivalent thickness
|
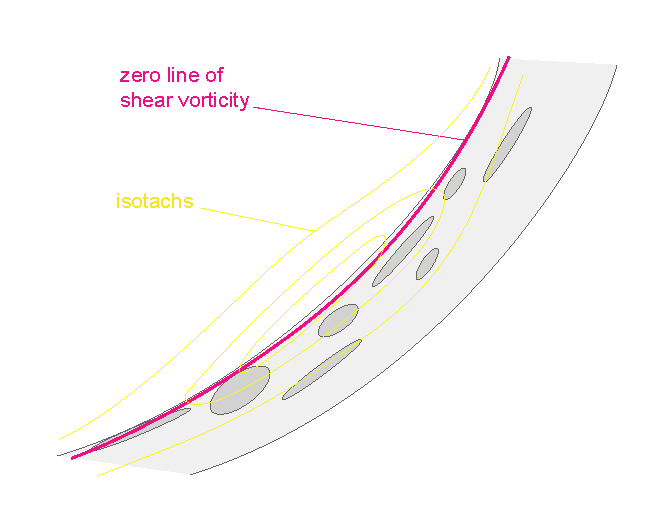
Shear vorticity and wind at 300 hPa:
- The zero line of shear vorticity follows the rear edge of the cloud band.
|
20 January 2007/12.00 UTC - Meteosat 8 IR 10.8 image; black: zero line of shear vorticity 300 hPa, yellow: isotachs 300 hPa
|
|
|
|

|
|
|
19 September 2005/12.00 UTC - Meteosat 8 IR 10.8 image; magenta: zero line of shear vorticity 300 hPa, yellow: isotachs 300 hPa
|