Table of Contents
Cloud Structure In Satellite Images
Cold Fronts are usually associated with cold advection behind the frontal zone and warm advection ahead of it, but sometimes the whole front is under cold advection. These fronts are called Cold Fronts in Cold Advection, abbreviated CF in CA.
CF's in CA form mostly over the Atlantic, but also in the north-eastern parts of Europe after some way across the continent, and are more common in the winter than in the summer. The CF's in CA stage generally lasts 0,5-2 days, although in winter 3-4 day developments sometimes occur.
CF's in CA are often old, dissolving kata-type fronts in occluded cyclones. The upper level cloudiness is slight or nonexistent. In the earlier stages there is also often a significant dark stripe behind the front due to the very cold dry air.
Appearance in the basic channels:
- In VIS images a white/light grey cloud band with some broken structure
- In IR images a grey, broken cloud band, which is clearly darker than other frontal parts (e.g. warm front or occlusion) of the system
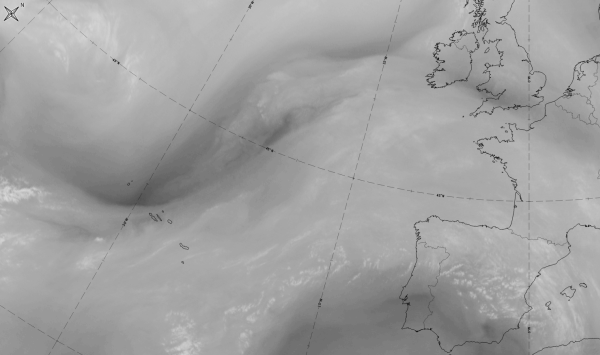
- In WV images a grey cloud band with often a black stripe behind it. In small and dissolving systems, the black stripe is missing. Additionally, in some cases, other systems like jet clouds or an upper level wave can hide the black stripe. Generally in the end of the CF in CA stage, the dark stripes weaken and disappear.
|
|
|
Appearance in the basic RGBs
Airmass RGB:
In front of the cloud band, depending on the geographical location, there is cold air showing as blue colours and /or warmer air showing as greenish colours. The latter appears more in southern latitudes as well as in the southern parts of the warm sector.
At the rear side of the CF in CA the cold and dry air from N-NW regions shows as blue (cold air) and brownish (cold and dry air) areas. The dark stripe in the WV image can be seen as a brown stripe in the Airmass RGB.
The cloud band looks very similar in the Airmass RGB to its appearance in the IR image. However, there are often areas where a brownish shadow is superimposed, indicating penetrating dry air.
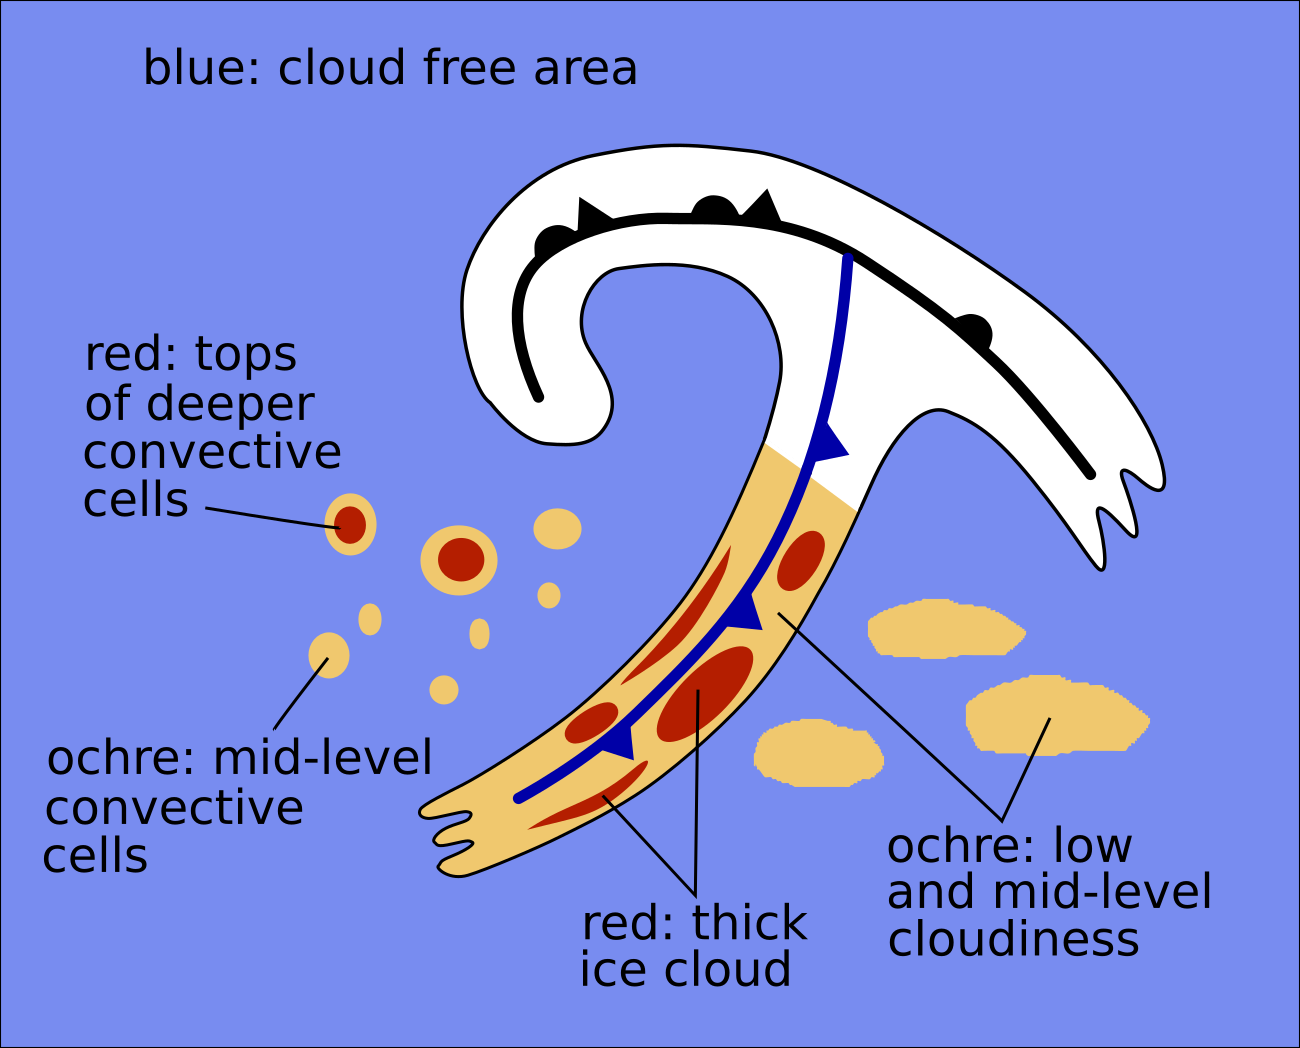
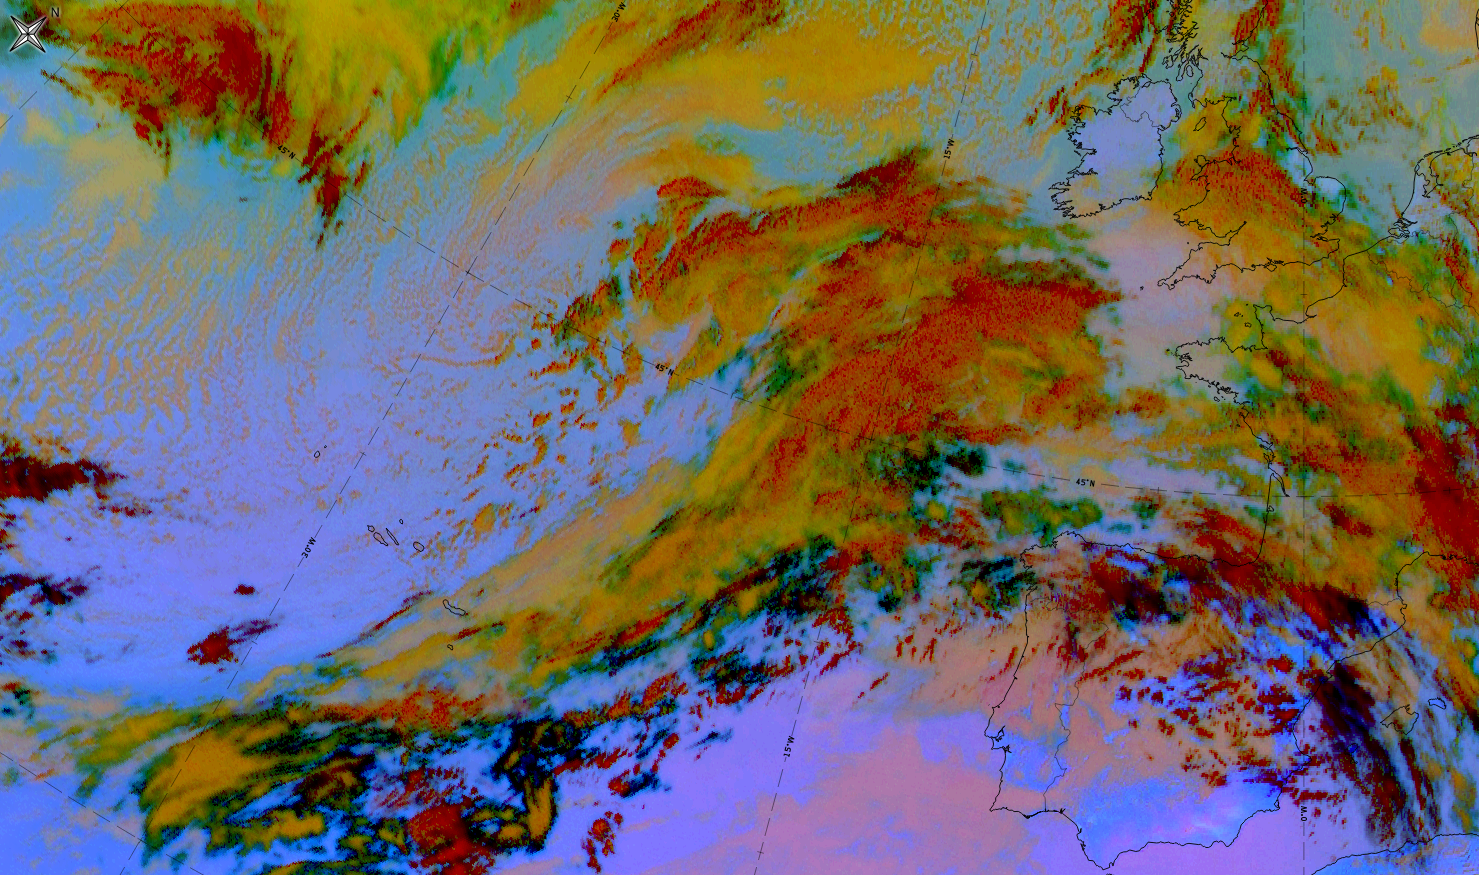
Dust RGB:
The Dust RGB discriminates between cloud-free areas in blue colours and areas with mostly low clouds in ochre colours.
As the cloudiness of a CF in CA often is less pronounced than for an active CF, the low level cloudiness with ochre colours dominates, although there are sometimes red-brown stripes indicating thicker clouds.
 |
 |
Basic RGBs schematics. Left: Airmass RGB; right: Dust RGB
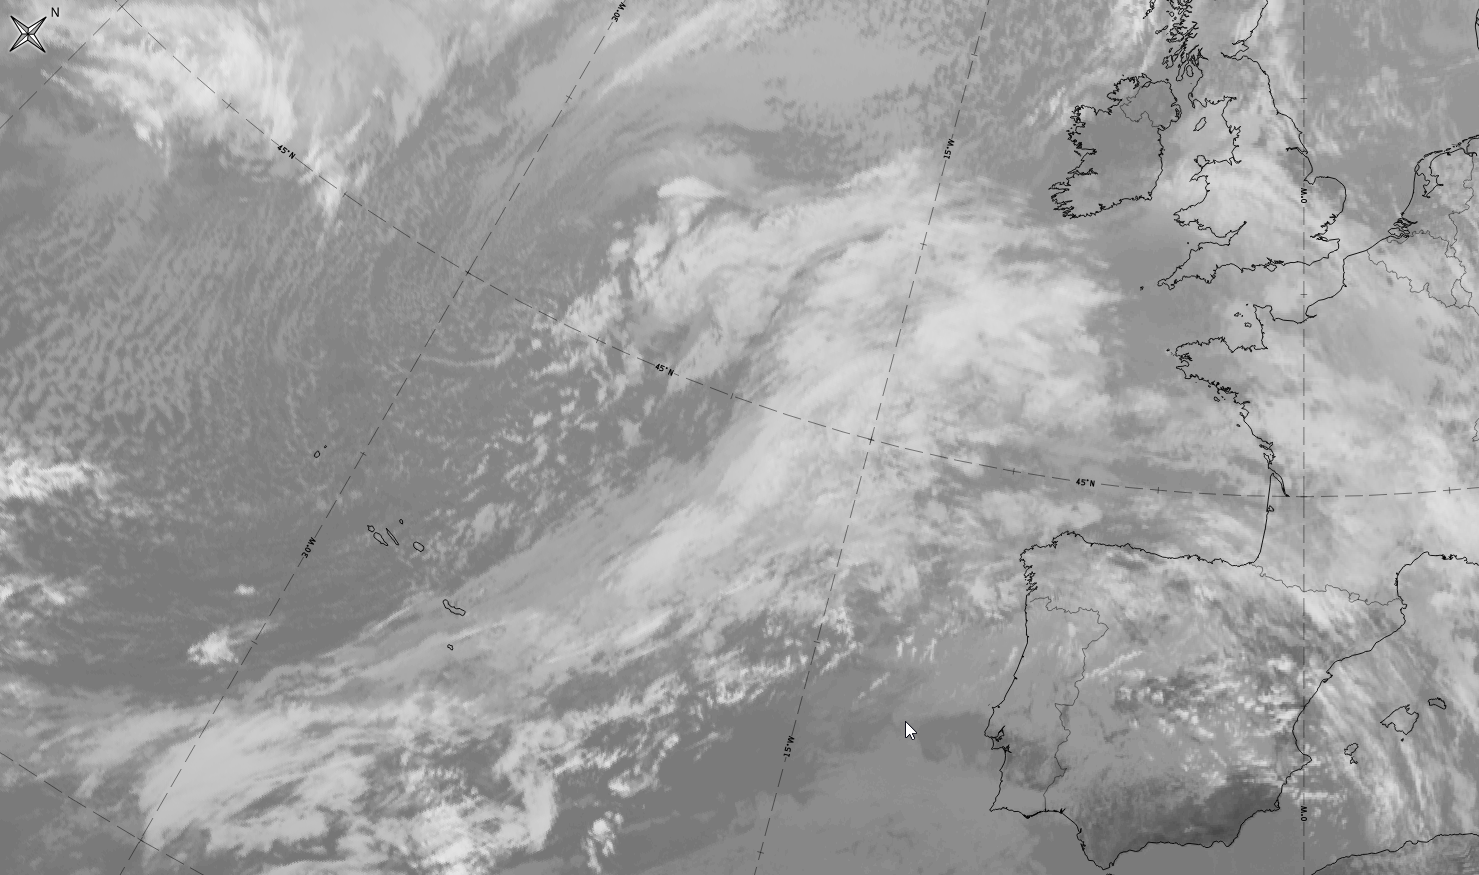
A good example of a CF in CA can be seen in the data from 4 March 2020 at 12 UTC.
|
|
|
|
|


| IR | Grey areas with some brighter cloud fibres above; grey areas in the Cold Front band are darker than in the occlusion and warm secto.r |
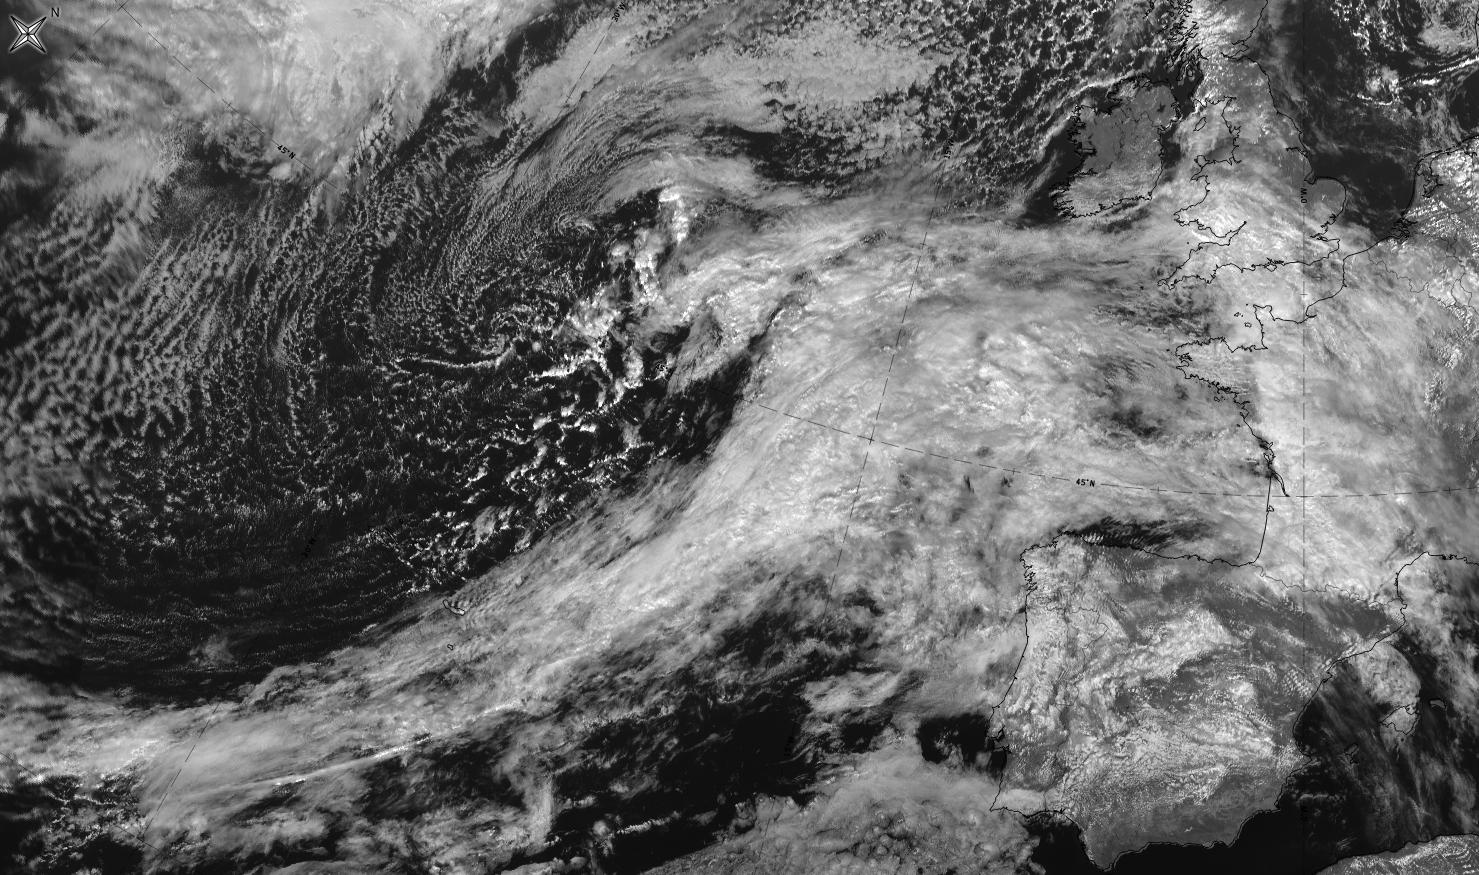
| HRV | White and broken cloudiness. |
| WV | Grey to dark grey band; black stripe at the rear representing sinking dry air. |
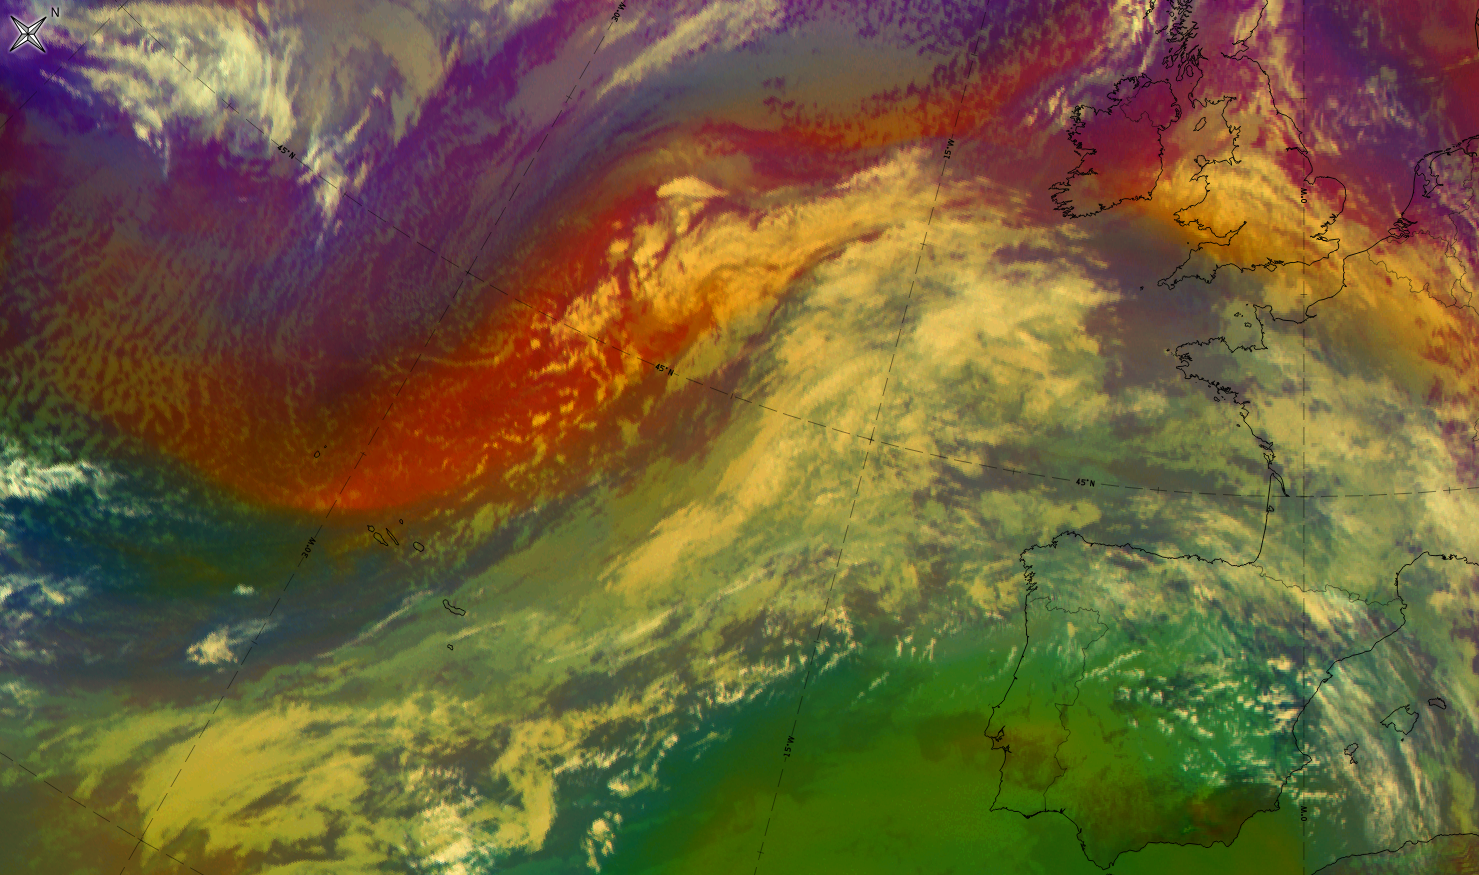
| Airmass RGB | As the cloud band is in southern latitudes, there are greenish colours indicating warm air masses superimposed with some brighter cloud patches; a broad brown area represents sinking dry air at the rear. |
| Dust RGB | Ochre colours indicate mid-level clouds. |
When defining the type of the CF in CA, the following aspects are to be taken into account:
- Along the front there can be several types of Cold Fronts present, that is CF, CF in CA and CF in WA.
- In the earlier stages there might still be some upper cloudiness connected to the front.
- Quite often (in over 70% of the cases) some other upper cloudiness overruns CF in CA: most common is Jet Fibres, the other possibility is an Upper Wave. This might make the images look like an ordinary Cold Front, and hide the black stripe behind the CF in CA.
- CF in CA can change back into CF or even into CF in WA before it is dissolved.
- Sometimes in the north CF in CA can be found already in a wave before the occlusion stadium. These fronts look like conventional Cold Fronts in the beginning, but the cloudiness reduces rapidly.
- The dark stripes are clear only in the beginning of the development, afterwards they grow lighter and smoother.
The last stage of CF's in CA can be:
- most often a common CF, after the cold advection has reduced, or warm advection from a WF or WCB is effecting it
- CF in CA can also dissolve in itself when the cyclone is very old and there are no other features nearby having any influence
- a Split Front, although this is rare.
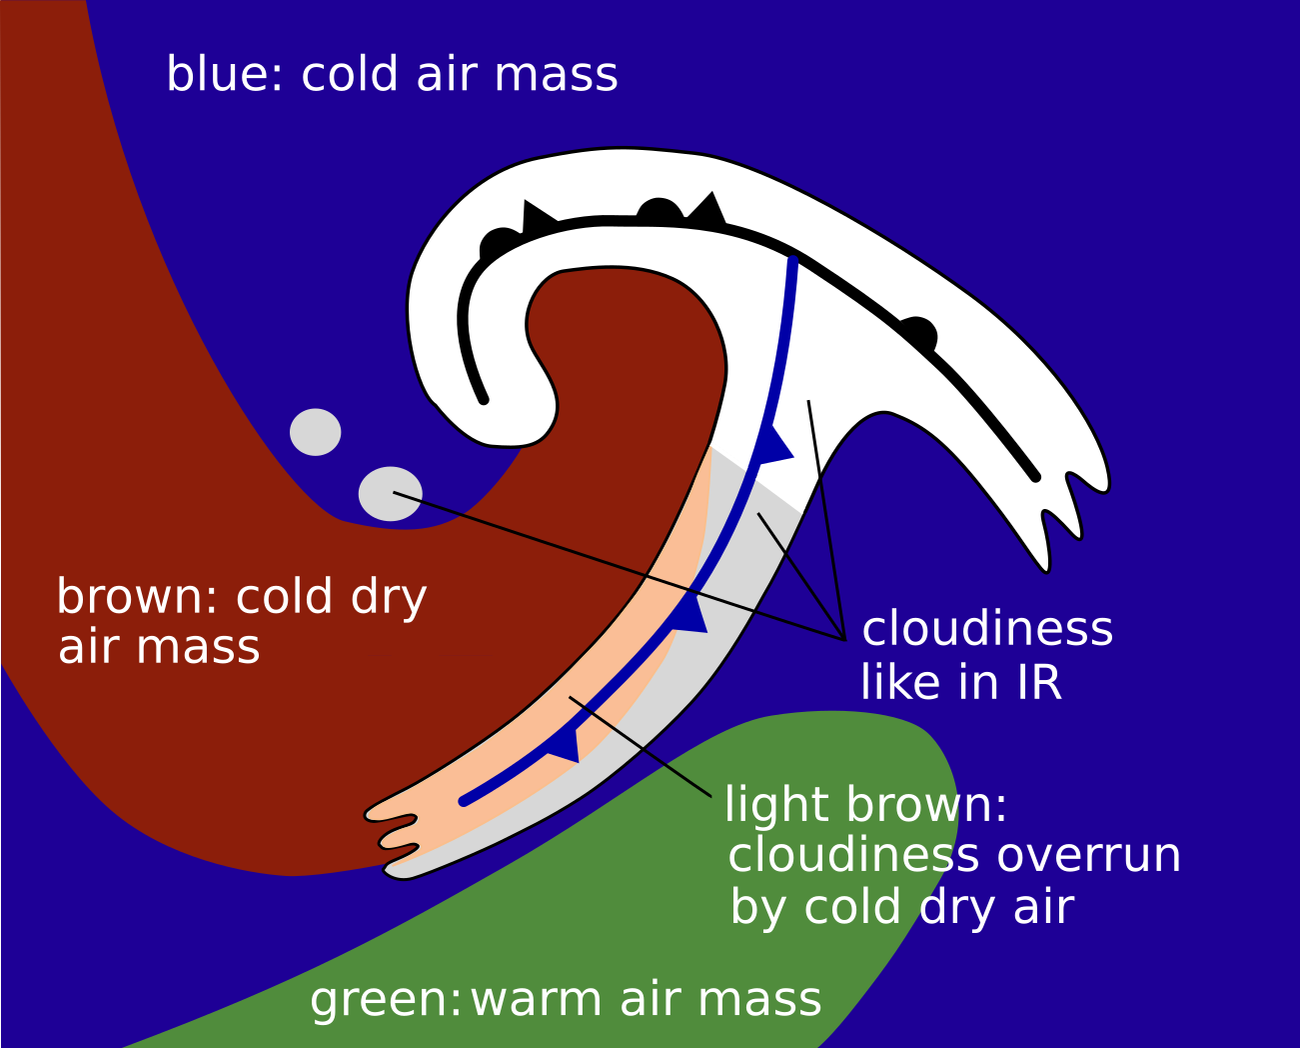
Meteorological Physical Background
Some differences in comparison with classical CFs can be noticed in the behaviour of the conveyor belts, especially for the dry intrusion.
The most typical feature in many cases is a sinking dry intrusion from behind. It splits into two branches over the rearward and middle part of the cloud band of the CF in CA: one branch is oriented to the south-southwest and the other branch to the north-northeast. The southern part is sinking from high levels to middle or even low levels, whereas the northern part stays on high levels. This feature is not always clear, however, especially in the earlier stages of development. The warm conveyor belt is usually weak.
|
The great majority of CF in CA's are either weakening or remaining the same as they are. This is because the strong cold advection triggers the weakening of the fronts.
In the summer the CF in CA's may be accompanied by MCS development on the leading edge of the cloud band (see Convective Cloud Features in Typical Synoptic Environments: At the Leading Edge of Frontal Cloud Bands ). This is due to the unstable stratification caused by the warm conveyor belt below and cold dry intrusion above. This development occurs regularly in the area of northern Adriatic Sea, where the topography is further contributing to the instability.
On the 3rd of September 2007 at 00 UTC there is a Cold Front in Cold Advection reaching from Southern Sweden to the English Channel. The relative streams at 316 K show a dry intrusion coming from the cold, dry northern air and splitting over the frontal cloudiness into two branches: one is turning to follow the cloud band towards the northeast, while the other turns to southwest while sinking.
|
03 September 2007/00.00 UTC - Meteosat 8 IR10.8 image; magenta: relative streams 316K, yellow: isobars 316K
|
|
Key Parameters
In this chapter the key parameters of Cold Front in Cold Advection reaching from Denmark towards the southwest are described and compared to the corresponding parameters of a Cold Front over Scotland.
Positive vorticity advection at 500 hPa and temperature advection at 700 hPa:
- In a CF in CA there is a maximum of PVA over the rear edge of the cloud band.
- In a CF in CA there is cold advection over the whole frontal cloudiness as well as behind it. Ahead of the front the temperature advection is usually negligible.
- In a CF there is warm advection ahead of the cloud band and strong cold advection behind it. The cloud band is mostly under cold advection.
|
20 January 2007/12.00 UTC - Meteosat 8 IR 10.8 image; green: PVA 500 hPa, red: temperature advection 700 hPa
|
|
|

|
|
|
|
19 September 2005/12.00 UTC - Meteosat 8 IR 10.8 image; green: PVA 500 hPa, red: temperature advection 700 hPa
|
Thermal frontal parameter and equivalent thickness:
- TFP accompanies the cloud band in both cases, although in CF in CA it is weaker.
- Equivalent thickness shows a crowding zone near the rear edge of the cloud band, and a ridge ahead of it.
|
20 January 2007/12.00 UTC - Meteosat 8 IR 10.8 image; blue: TFP, green: equivalent thickness
|
|
|
|
|
|
|
19 September 2005/12.00 UTC - Meteosat 8 IR 10.8 image; blue: TFP, green: equivalent thickness
|
Shear vorticity and wind at 300 hPa:
- The zero line of shear vorticity follows the rear edge of the cloud band.
|
20 January 2007/12.00 UTC - Meteosat 8 IR 10.8 image; black: zero line of shear vorticity 300 hPa, yellow: isotachs 300 hPa
|
|
|
|

|
|
|
19 September 2005/12.00 UTC - Meteosat 8 IR 10.8 image; magenta: zero line of shear vorticity 300 hPa, yellow: isotachs 300 hPa
|
Typical Appearance In Vertical Cross Sections
Comparison of cross sections between a Cold Front and a Cold Front in Cold Advection (see Cold Front - Typical Appearance In Vertical Cross Sections):
- Temperature Advection: in CF warm advection ahead of the frontal zone and strong cold advection behind it, in CF in CA cold advection within and behind the frontal zone, weak warm advection ahead of it.
- Omega: strong ascend ahead of the frontal zone and weak descend behind it.
- Potential Vorticity Advection: the frontal zone is within PVA, which increases with height.
- Divergence: convergence within the frontal zone, divergence above it. Features are similar in both types.
- Relative humidity: Humid air ahead of the frontal zone, dry air intruding into it from behind.
|
Cold Front in Cold Advection: 20 January 2007/06.00 UTC - Meteosat 8 10.8 image; position of vertical cross section indicated
|
Cold Front: 10 November 2006/06.00 UTC - Meteosat 8 10.8 image; position of vertical cross section indicated
|
|
|
Temperature advection
|
20 January 2007/06.00 UTC - Vertical cross section; black: isentropes, red thick: warm advection, red thin: cold advection
|
|
|
|
|
|
|
10 November 2006/06.00 UTC - Vertical cross section; black: isentropes, red thick: warm advection, red thin: cold advection
|
Omega
|
20 January 2007/06.00 UTC - Vertical cross section; black: isentropes, cyan thick: upward motion, cyan thin: downward motion
|
|
|
|
|
|
|
|
10 November 2006/06.00 UTC - Vertical cross section; black: isentropes, cyan thick: upward motion, cyan thin: downward motion
|
Positive Vorticity Advection
|
20 January 2007/06.00 UTC - Vertical cross section; black: isentropes, green: PVA
|
|
|
|
|
|
|
10 November 2006/06.00 UTC - Vertical cross section; black: isentropes, green: PVA
|
Divergence
|
20 January 2007/06.00 UTC - Vertical cross section; black: isentropes, red thick: warm advection, red thin: cold advection
|
|
|

|
|
|
|
10 November 2006/06.00 UTC - Vertical cross section; black: isentropes, red thick: warm advection, red thin: cold advection
|
Weather Events
| Parameter | Description |
| Precipitation |
|
| Temperature |
|
| Wind (incl. gusts) |
|
| Other relevant information |
|
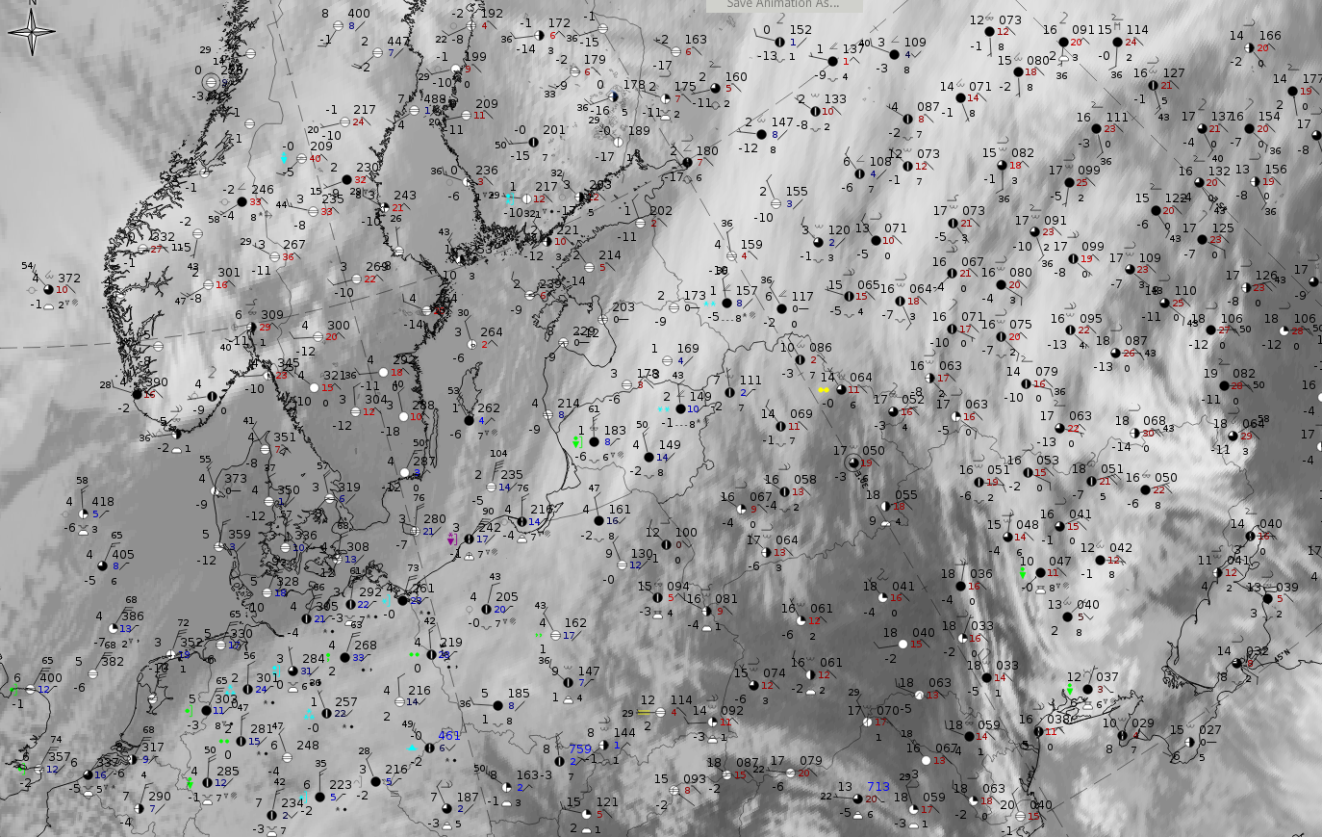
These features are best illustrated using data from 29 March 2020 at 12 when an example of a CF in CA occurred over the north-eastern part of Europe, extending from Poland where cloudiness is low to mid-level, across the Baltic States into Russia where also thicker ice clouds are also superimposed.
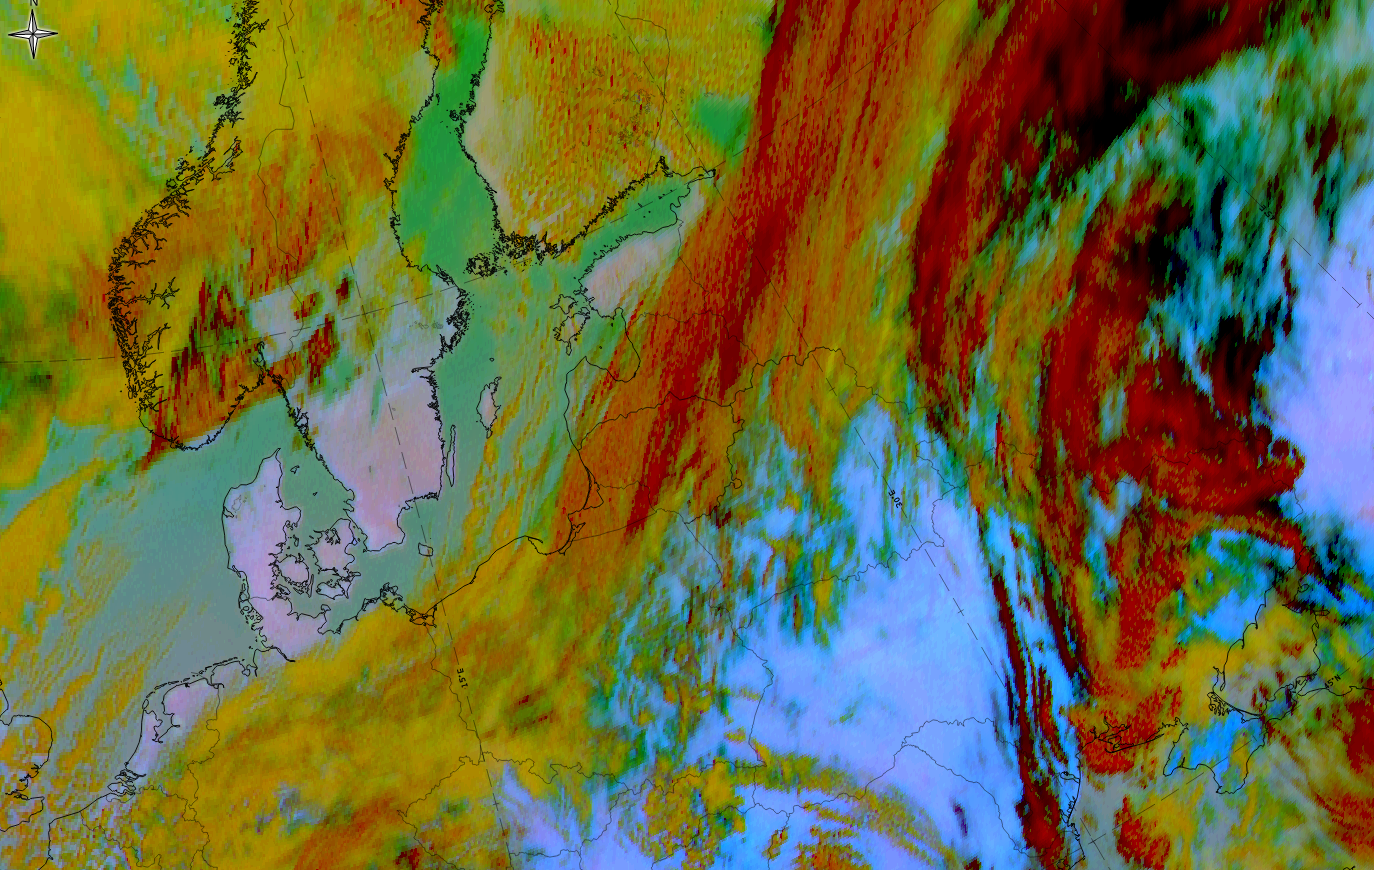
29 March 2020, 12 UTC; Dust RGB
|
|
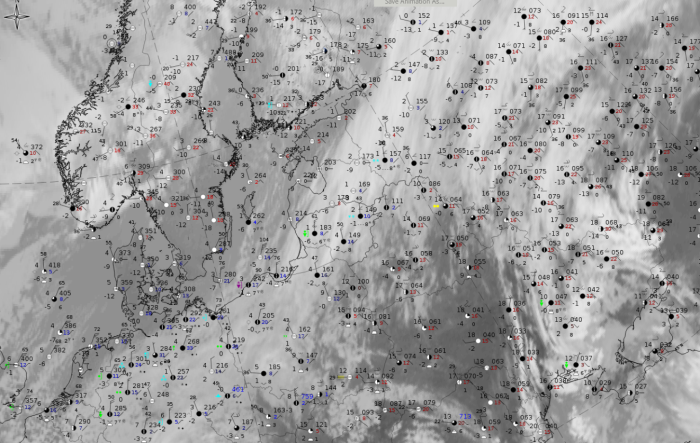
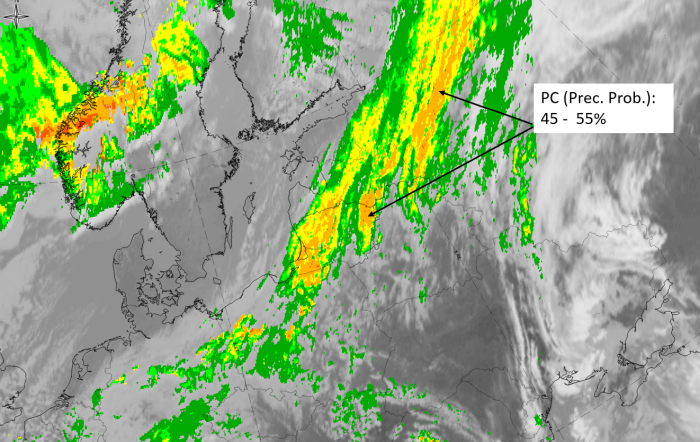
29 March 2020, 12UTC: IR + synoptic measurements (above) + probability of moderate rain (Precipitting clouds PC - NWCSAF).
Note: for a larger SYNOP image click this link.
Weather stations in the cloud band mostly reported only low to mid-level cloudiness and one report at the leading edge contains a Cb. Mostly there is low probability of moderate rain, only in the few ochre areas does it rise to values of 45 - 50%.
|
|
|
|
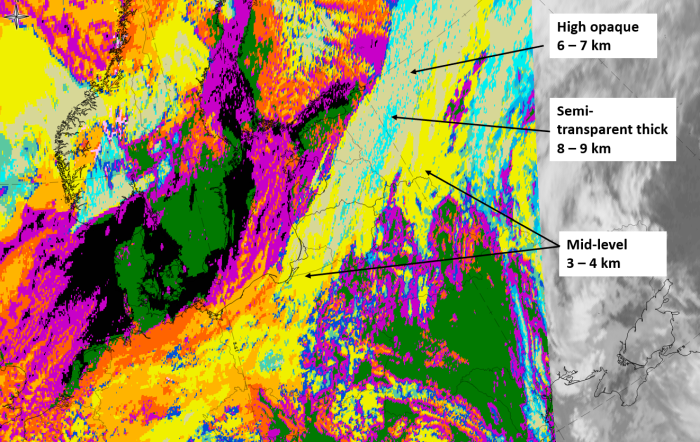
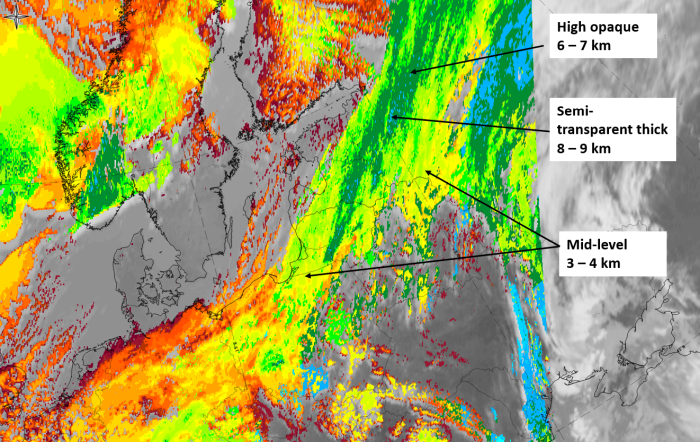
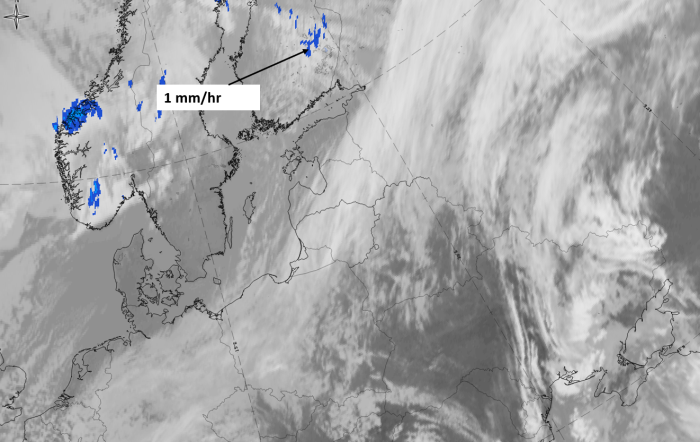
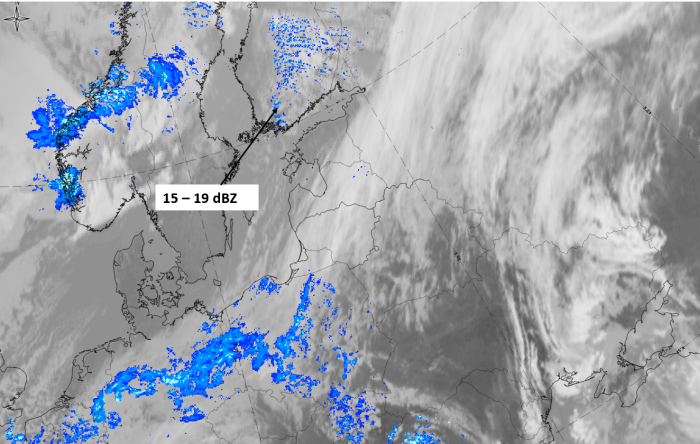
29 March 2020, 12 UTC, IR; superimposed:
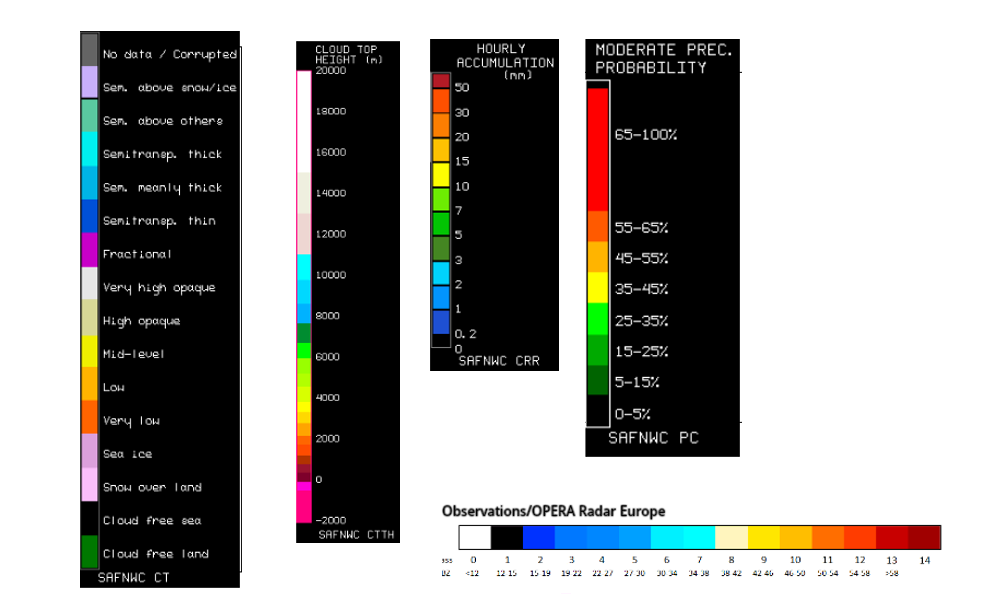
1st row: Cloud Type (CT NWCSAF) (above) + Cloud Top Height (CTTH - NWCSAF) (below); 2nd row: Convective Rainfall Rate (CRR NWCSAF) (above) + Radar intensities from Opera radar system (below).
For identifying values for Cloud type (CT), Cloud type height (CTTH), precipitating clouds (PC), and Opera radar for any pixel in the images look into the legends. (link)
References
References concerning the "Cold Front in Cold Advection" are similar to the ones for "Cold Front". Compare Cold Front - References