Typical Appearance In Vertical Cross Sections
The parameters we use to describe the vertical structure of a UTCV in this conceptual model are the relative vorticity, the zonal deviation of temperature and the vertical velocity.
The first set of figures below show a UTCV in its early stage of development, during which the closed circulation begins to develop in the 300 hPa field.
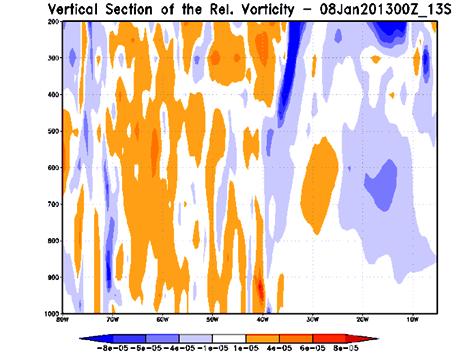
Figure (b) shows the west-east, vertical cross-section of relative vorticity through the cyclone center (around 11°S), during the formation phase. We can see how the UTCV extends from the tropopause to 500 hPa, with a vertical inclination towards the east.
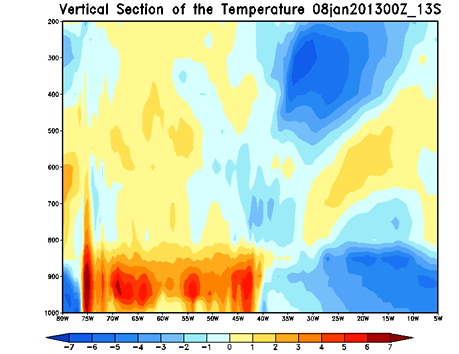
In figure (c) , the cross-section of the zonal air temperature deviation also shows the same vertical inclination of the cold air (negative values), as it extends to 550 hPa. Furthermore, this figure illustrates how positive values appear to the west of the UTCV. These positive values could be associated with the Bolivian High.
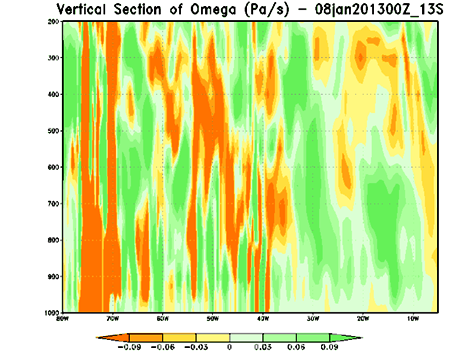
The vertical velocity cross-section in figure (d) indicates clear downwards motion in the UTCV core and upwards motion at the periphery.This vertical motion extends through to low levels.
|
08 January 2013 / 0000 UTC. Infrared satellite image with 300 hPa streamlines (a), vertical cross- section at 13°S for relative vorticity (b), zonal deviation of temperature (c) and vertical velocity (d).
|
|
| a) | b) |
|
|
| c) | d) |
|
|
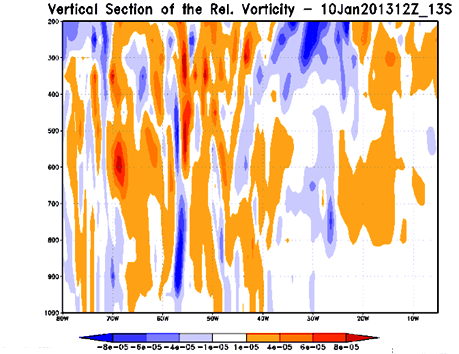
The second set of figures shows the same system during its mature stage. The west-east vertical cross-section of relative vorticity through the cyclone center (13°S) has been produced while the UTCV is over the Atlantic Ocean. Cloud structures in the north-eastern sectors show how the UTCV extends from the tropopause to 350 hPa with a vertical inclination towards the east (b).
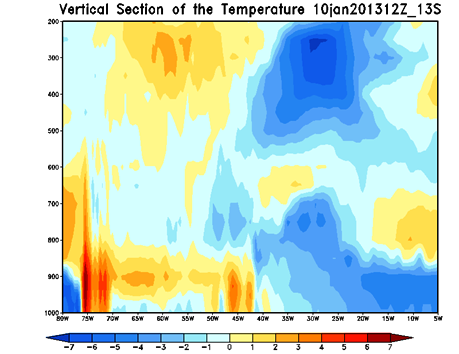
The cross-section of the zonal air temperature deviation (c) continues to show the vertical inclination of the cold air eastwards, extending through to 550 hPa, while also illustrating how the dipole observed in the previous phase has intensified.
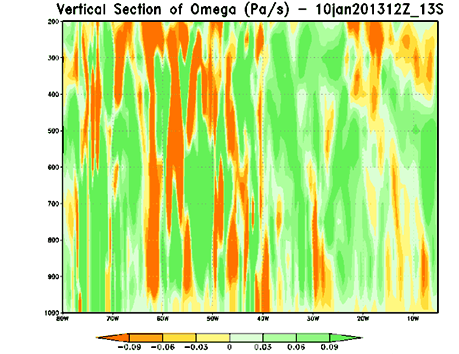
The vertical velocity cross-section in figure (d) again indicates clear downwards motion in the UTCV core and upwards motion at the periphery. In this image, the downwards motion extends to low levels while the upwards motion in the eastern sector is confined to upper levels (500 hPa up to tropopause).
|
10 January 2013 / 1200 UTC. IR image with 300 hPa streamlines (a), vertical cross-section at 13°S for relative vorticity (b), zonal deviation of temperature (c) and vertical velocity (d).
|
|
| a) | b) |
|
|
| c) | d) |
|
|
The third set of figures show a "classical" deep UTCV case during the mature stage.
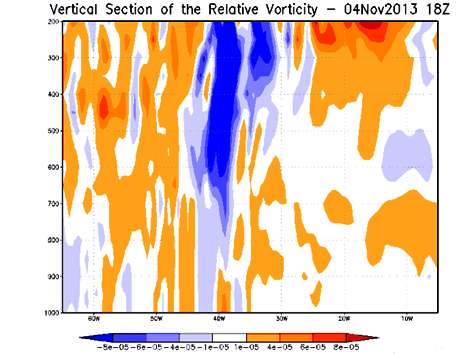
The west-east vertical cross-section of relative vorticity through the cyclone center (13°S) has been compiled while the UTCV was over the coast of northeastern Brazil. We see cloud patterns at the periphery and convective activity in the core. The UTCV extends from the tropopause to 750 hPa, with a small vertical inclination towards the east, from 600 hPa to 300 hPa (b). As expected, this UTCV is deeper than the previous one, with upper cirrus clouds.
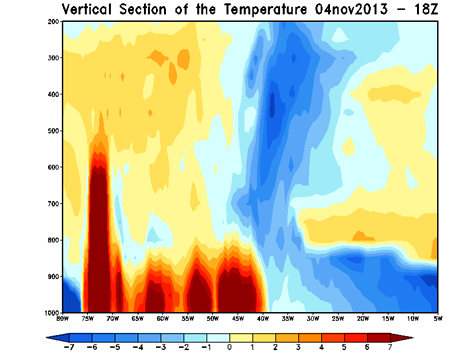
The cross-section of the zonal air temperature deviation (c) once more shows a vertical inclination of the cold air towards the east, this time extending through to 800 hPa., while we also see warmer air in the west at upper levels.
|
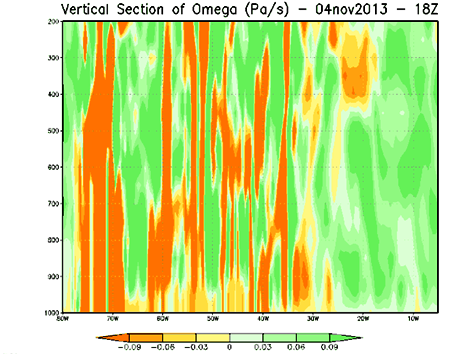
4 November 2013 / 1800 UTC. Water Vapour image (a) and vertical cross section at 18°S for relative vorticity (b), zonal deviation of temperature (c) and vertical velocity (d).
|
|
| a) | b) |
|
|
| c) | d) |
|
|