Table of Contents
Appearance in Satellite Data
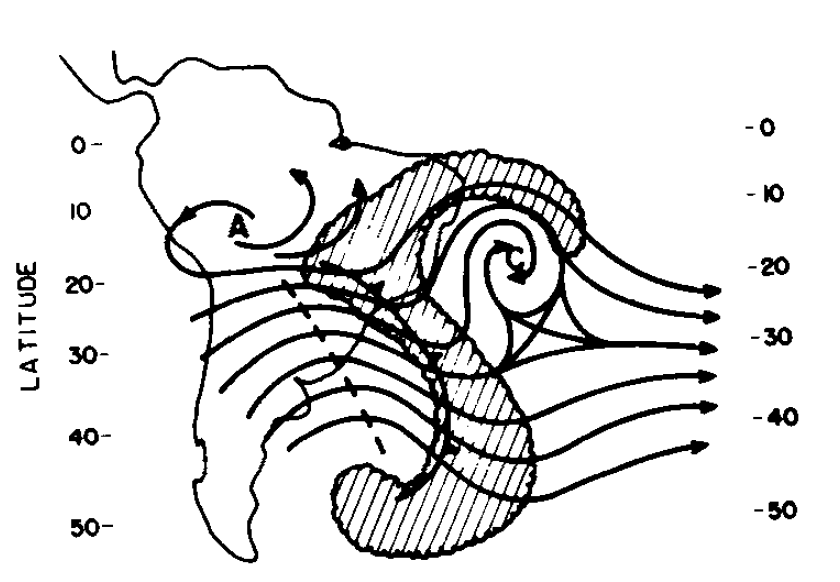
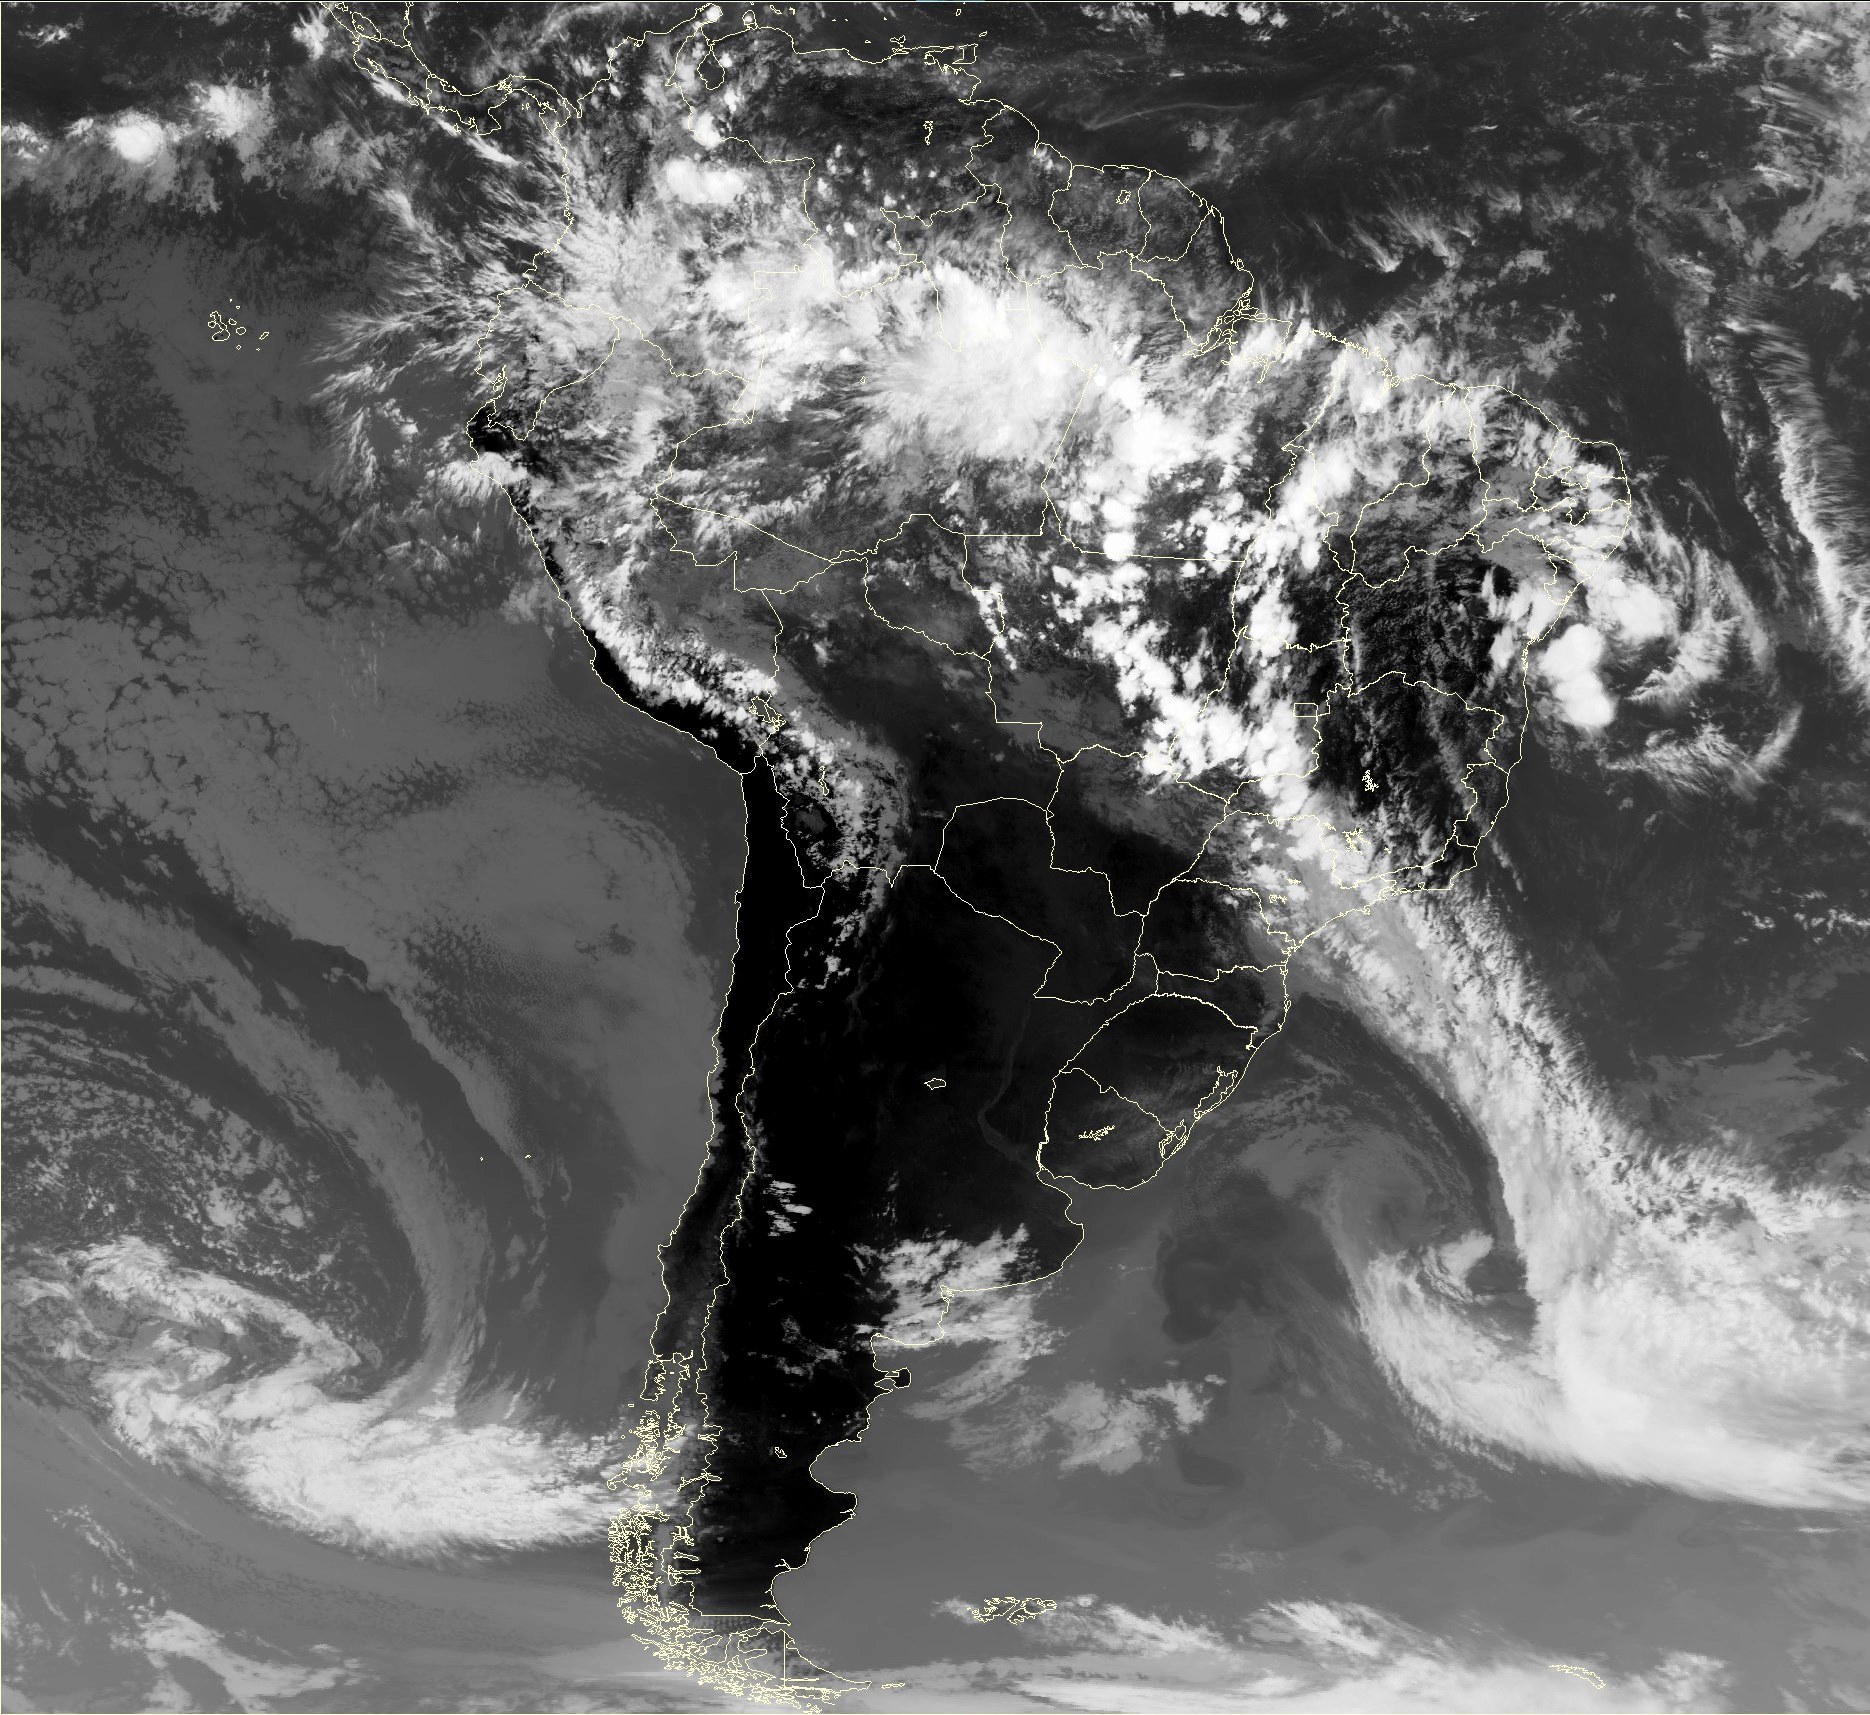
The cloud patterns associated with UTCVs vary considerably, depending on their intensity and depth. At mid and upper levels, we often see these cloud patterns form in connection with situations such as those in the figures (schematic and IR image) below. Here we can see that the cloud structures associated with the UTCV have merged with those of the extratropical low pressure and frontal system, to produce an "S" shape. In some case, convective clouds in the western sector of the vortex will interact with the circulation from the Bolivian High.
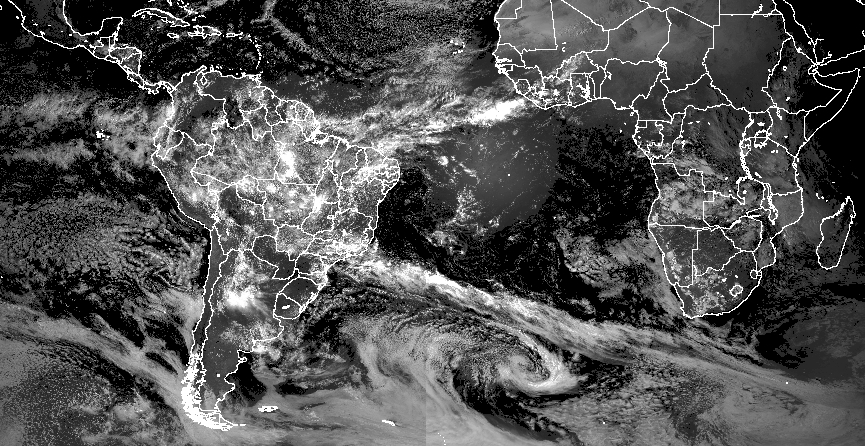
Although the center of the UTCV is generally a clear region, characterized by subsidence, convection activity can also be observed near the center when the UTCV is over the continent (see the satellite image below). This generally indicates that cyclonic vortices are passing over warm oceanic waters or continental areas.
|
Schematic illustration of middle and high clouds for UTCV. Source: Kousky and Gan (1981).
|
04 November 2013 / 18 UTC. GOES-13 IR image.
|
|
|
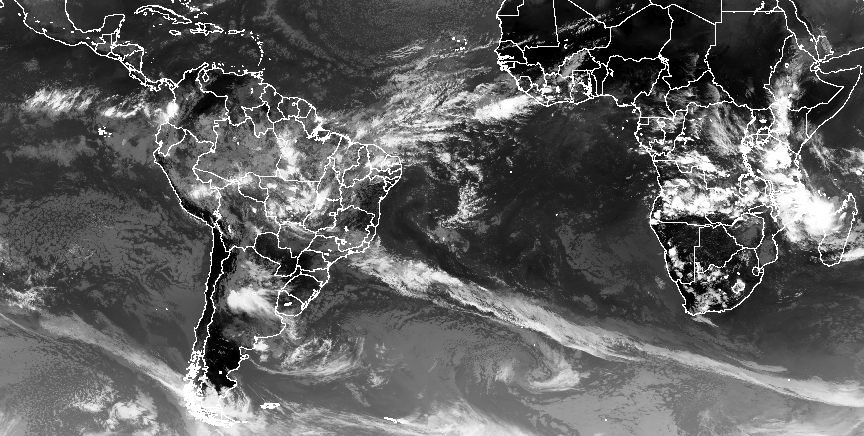
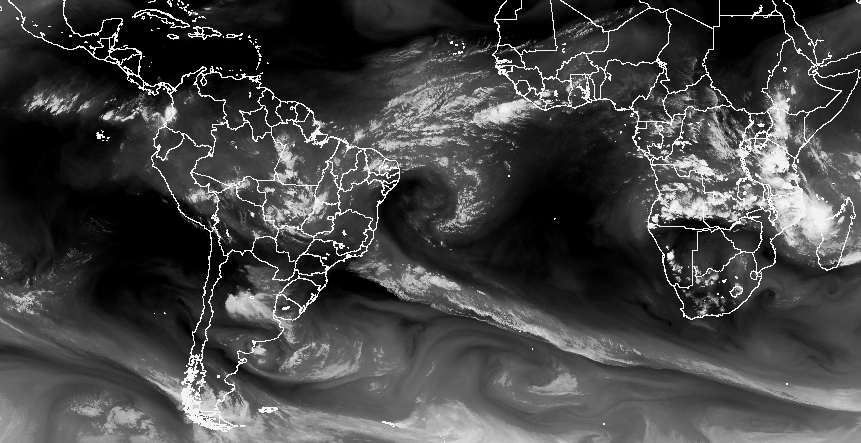
In the images below, we see an example of cloud patterns, taken on 17 February 2014 at 1745 UTC, using infrared and water vapor satellite images. In these figures we can see dry air in the center (darker gray in the WV channel) surrounded by moist air forming a dark tongue and spiral shape (different shade of gray) in the UTCV center. Convection at the edge of the system is indicated by the brighter white tones. Because there are many cirrus clouds around the UTCV, this system is difficult to identify in the visible channel.
We can also see the presence of an anticyclonic circulation (Bolivian High) over the continent, which contributes to diffluence and divergence at upper levels between this high and the UTCV. Convective clouds then form in this region, in association with this divergence.
|
17 February 2014/1745 UTC - thermal infrared (11 µm), water vapor (6.7 µm) and visible (0.8 µm) channels for GOES-Meteosat composite images.
|
|
|
|
|
|
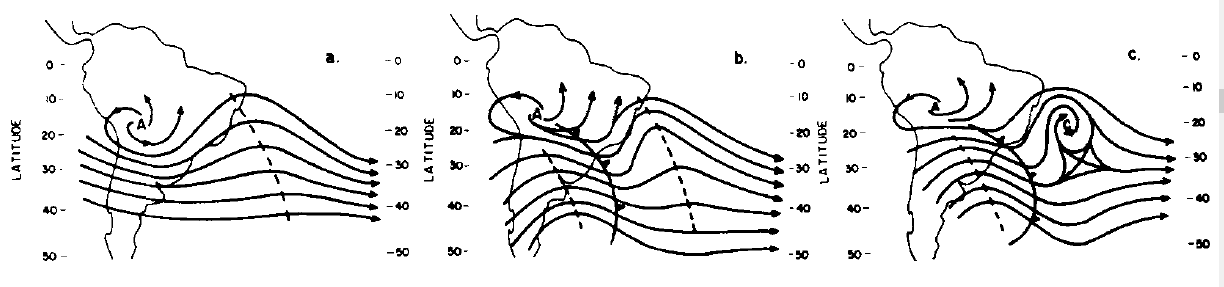
The evolution of a UTCV over northeastern Brazil and the tropical South Atlantic Ocean can be seen in the infrared (11 µm) satellite image, superimposed with 300 hPa streamlines (figure below) for the system which occurred on January 08, 2013. An upper-level trough associated with upper-level cloud structures (cirrus) is shown at 1200 UTC 06 January (red dashed line in figure "a" below). On the next day (figure "b" below), the trough over the coast of northeastern Brazil (30oW) had evolved to a closed circulation and the upper clouds had dissipated (cirrus are observed in other cases). At 0000 UTC 08 January 2013 (figure "c" below) the trough appears closed (see letter C in figure "c" below) indicating that the UTCV has now formed. Although the cloud structures associated with a UTCV will vary according to their intensity and depth, the presence of a wide upper-level band of clouds with a cyclonic curvature is a typical pattern associated with a UTCV (as showed in the figures "a" and "d"). The clouds are located over the periphery of the UTCV. When the trough changes to a closed circulation, the clouds appear on the eastern side of the system and the core is then free of clouds (figure "d" below).
| a) | b) |
|
|
| c) | d) |

|
|
Meteorological Physical Background
Broad Overview
The upper tropospheric cyclonic vortices (UTCVs) are synoptic-scale, low-pressure systems with maximum cyclonic circulation at upper levels. They usually develop from a deep upper-level trough over the northeastern coast of Brazil and the adjacent Atlantic Ocean. Figure 1 shows a UTCV over the Atlantic Ocean, close to the northeastern coast of Brazil, on 17 February 2014 at 1800 UTC.
|
17 February 2014 at 1800 UTC Thermal Infrared (11 µm) channel for GOES-Meteosat composite image.
|
17 February 2014 at 1800 UTC Water Vapour (6.7 µm) channel for GOES-Meteosat composite image.
|
|
|
The UTCVs are formed in the 200-300hPa layer (Kousky and Gan 1981; Ramirez et al. 1999, Mishra, 2001) and extend to mid and low levels (Morais, 2015). Most of these vortices have a lifetime of 3 days but some can persist for more than 10 days (Ramirez et al. 1999 e Coutinho 2008). Their wavelength is around 2000-3000 km.
Seasonal Variety
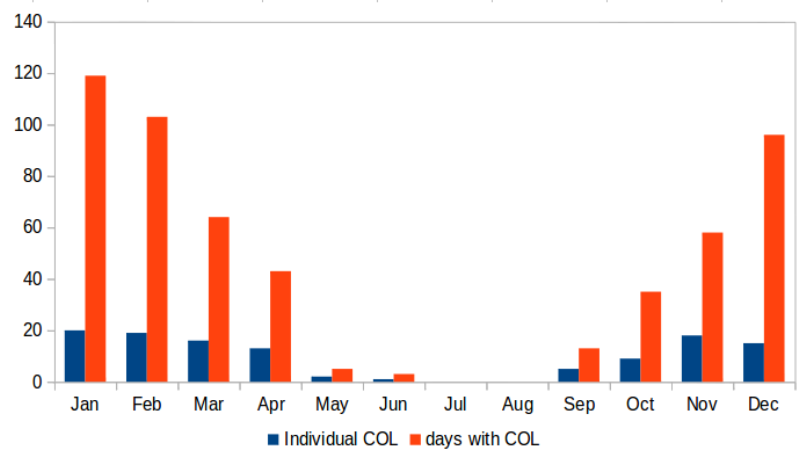
UTCVs can occur at any time of the year but are most frequently observed during the summer months. The 5 year average analysis (2002-2006 period) by Coutinho et al. (2010), in the figure below, shows the number of individual UTCVs (whole life cycle) observed using WV satellite imagery and the number of individual days with UTCVs.
|
Number of individual UTCVs (whole life cycle) observed using WV satellite imagery and the number of days with UTCVs (source: Coutinho, 2010).
|
|
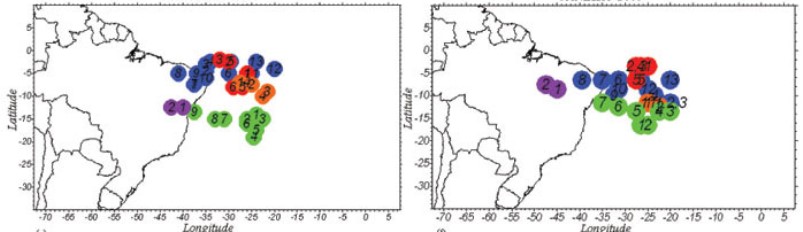
The UTCVs normally show a counterclockwise trajectory , propagating eastwards when they are south of 15°S and westwards when they are north of 15°S. Figure 4 shows some examples of these UTCV paths.
|
Path of the 200 mb cyclone during January 2003. The colored cycle represents the UTCVs and the numbers indicate the sequence of 12 hours. The figure on the left shows the formation time and that on the right shows a period twelve hours later. Source: Coutinho (2010).
|
|
In many cases, the genesis of a UTCV is associated with cold frontal systems, penetrating from high latitudes to low latitudes. Strong low and mid-level warm advection precedes the active cold front. This warm advection then amplifies the upper-level ridge downstream, which contributes to the amplification of the downstream trough located over northeastern Brazil and the Atlantic Ocean. The vortex formation mechanism was proposed by Kousky and Gan (1981) and is schematically illustrated below. Figure (a) shows the typical summer circulation pattern over South America and the South Atlantic (200 hPa). Figure (b) shows an active mid-latitude, upper-level trough over South America, its associated surface-level cold front in southern Brazil and a strong upper-level ridge, extending from southeastern Brazil out, over the Atlantic. A sharpening of the trough pattern can be seen over the western Atlantic region. Finally, the cold front moves over southeastern Brazil and a UTCV forms in the western Atlantic.
|
Schematic sequence for the formation of a 200 hPa subtropical cyclone in the South Atlantic. Source: Kousky and Gan (1981).
|
|
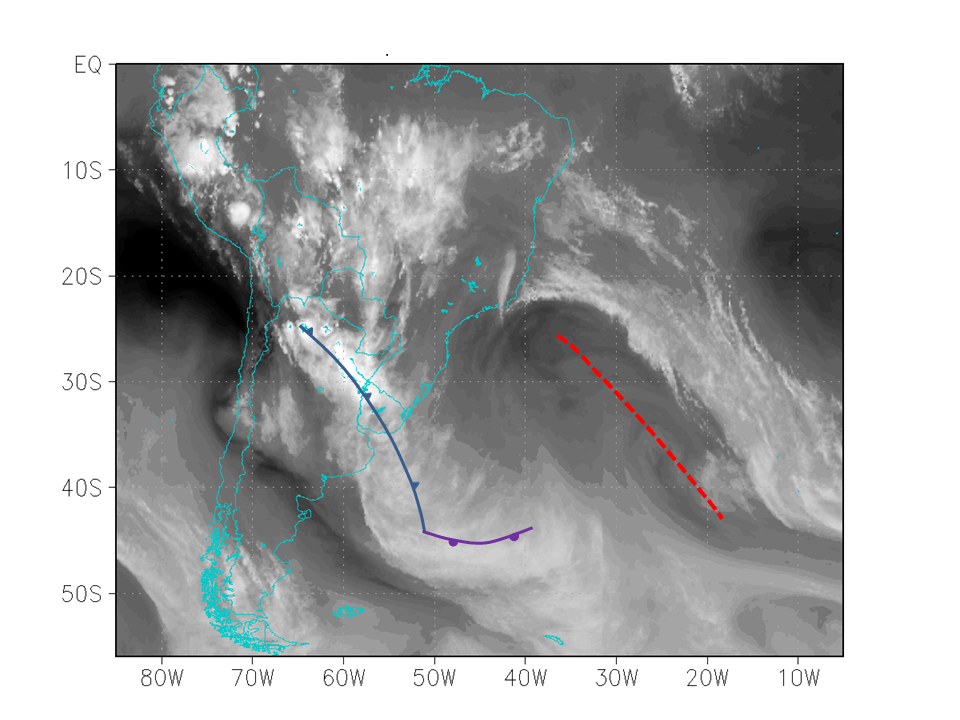
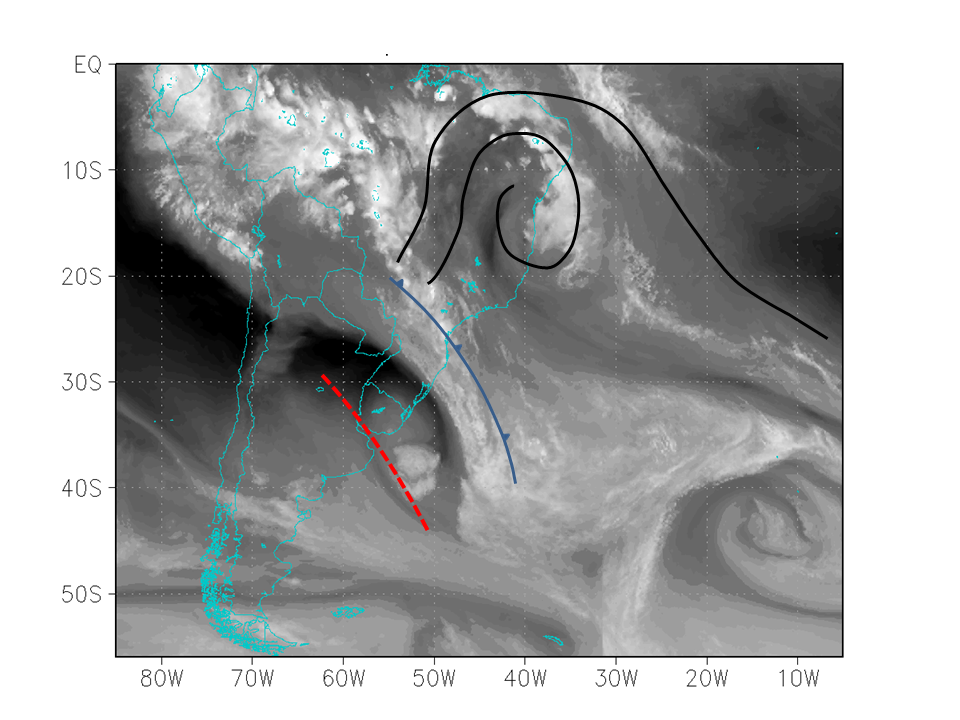
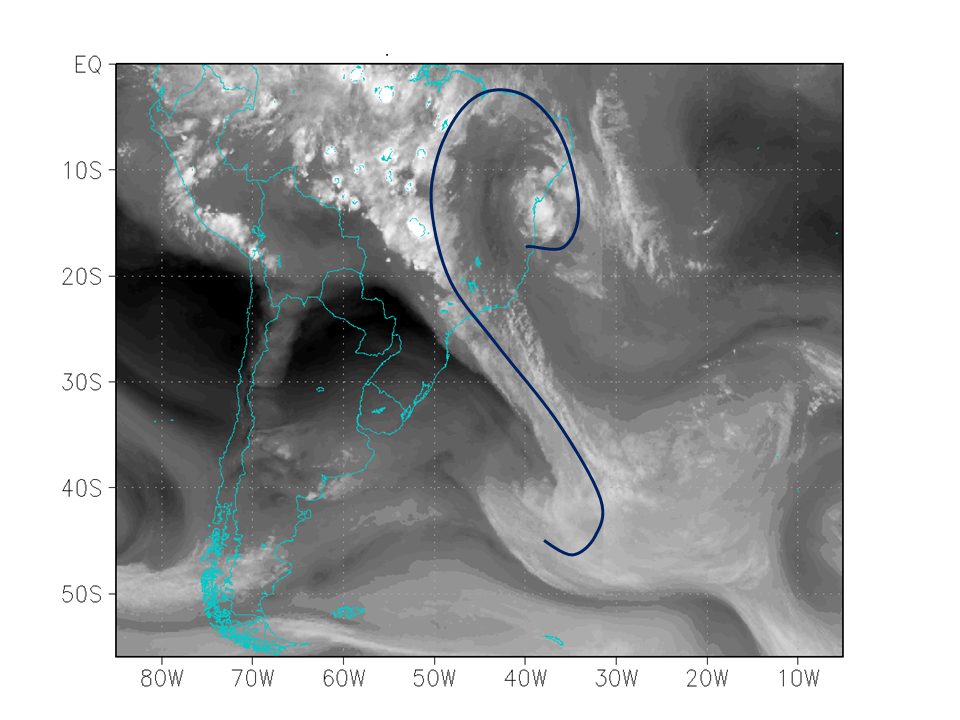
In the water vapor satellite image sequence (figure below) for 01 November 2013 at 23:45 UTC, we can see the vortex formation mechanism as described by Kousky and Gan. During the first stage, a cold frontal system is located over southern Brazil, preceded by strong low and mid-level warm advection. This warm advection amplifies the upper-level ridge downstream, which then helps to amplify the downstream trough located over northeastern Brazil and the Atlantic Ocean (02 Nov. 2013). During the last two days, we see a sharpening of the trough pattern over the western Atlantic and finally, the cold front moves to southeastern Brazil and a UTCV can be seen over the tropical Atlantic Ocean.
When the UTCV is close to the continent, the western edge of the UTCV interacts with the continental tropical convection and cloud structures develop in this section of the system (c). Once the UTCV center moves over the continent, convective activities can develop in the center of the system during the afternoon and evening hours (d). During the day, heat from below (low levels) meets cold air in the mid and upper levels associated with the UTCV, to produce a situation sufficiently unstable for convective clouds to develop. The latent heat release associated with the convection in the UTCV center then leads to dissipation of the system. UTCVs located over oceanic areas do not normally dissipate and are instead absorbed by a mid-latitude trough
| a) | b) |
|

|
| c) | d) |
|
|
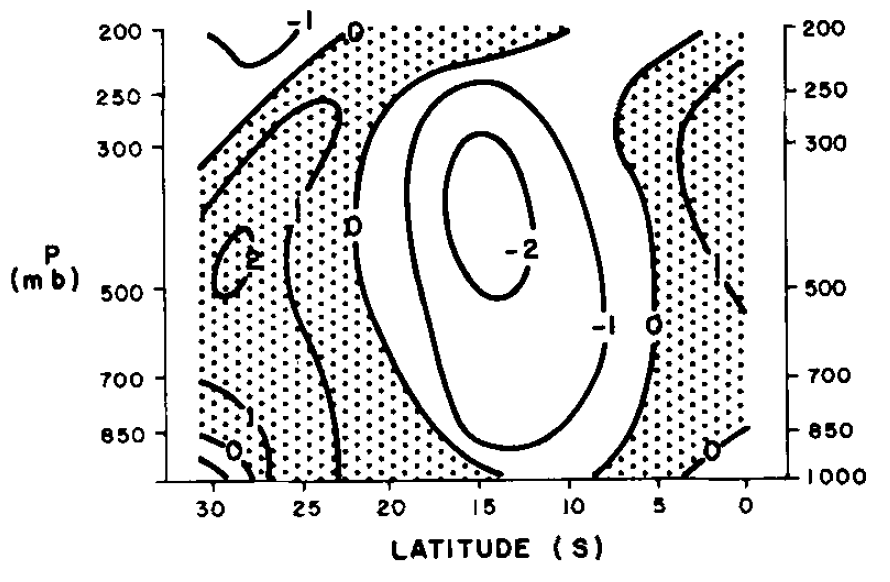
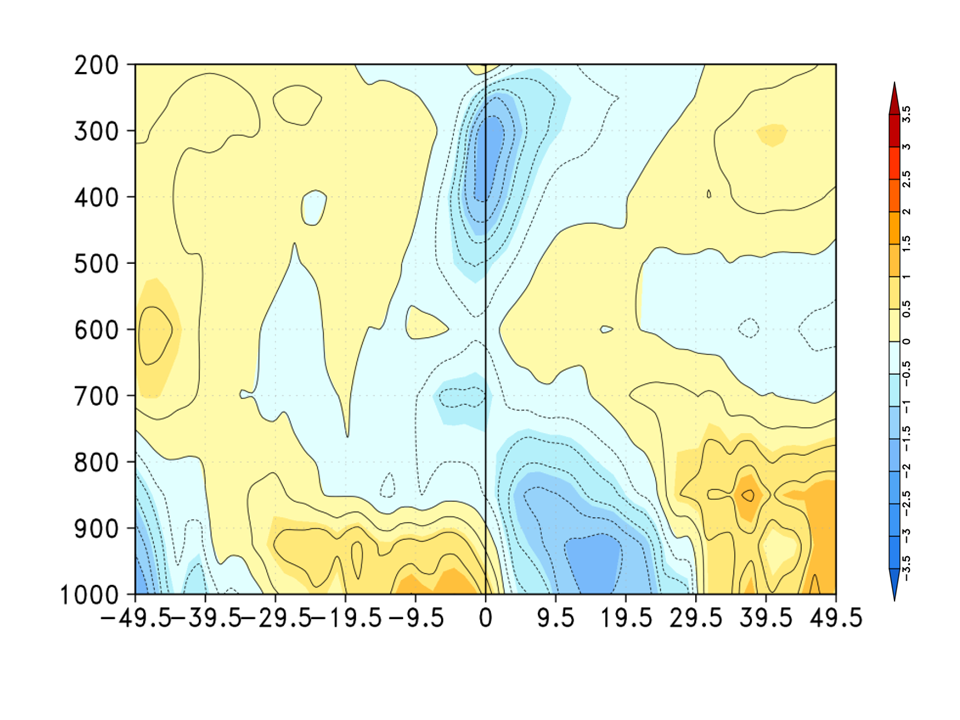
The UTCVs are characterized by a cold core. The coldest temperatures are observed at mid-upper levels of the troposphere, while temperatures near the surface are relatively unaffected by the presence of the vortex (Kousky and Gan, 1981). While the first image shows a vertical section of the zonal average temperature anomaly for one particular day, the second one shows a composite of 61 cases during a 10 year period (2003-2013). The composite is based on the minimum relative vorticity at 200 hPa for each system during the whole life cycle.
|
North-south vertical cross section of temperature deviations from longitudinal mean values for 12 March 1978 at 40°W longitude. A longitudinal mean temperature for each level was calculated first. Unit: °C. Source: Kousky and Gan (1981).
|
Field composite of the vertical cross section of the temperature deviation (°C) for 2003-2013 period with vertical axis fixed at the Center for UTCVs in the formation time. The line passes through the middle of the UTCV (0.0) and horizontal axis shows the width spacing in degrees from that center. Source: Morais (2015).
|
|
|
Key Parameters
Water Vapour imagery
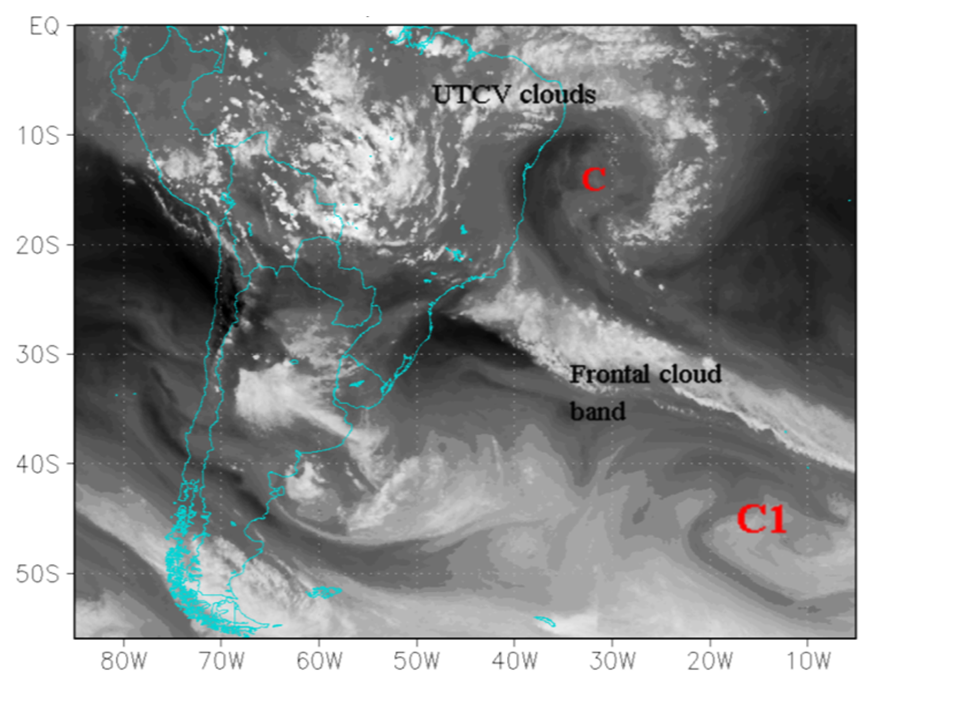
WV imagery shows the distribution of moisture/humidity around the UTCV at mid and upper atmospheric levels. The dark areas represent dry air, the mid-gray areas show moisture in the upper atmosphere and the brighter, white features indicate upper-level cloud structures.
|
February 2014 / 1200UTC Water Vapour 6.2 µm image. The letter C indicates the UTCV center and C1 the extratropical cyclone.
|
|
The clouds associated with the UTCV, the frontal system and the extratropical cyclone merge to form the typical "S" pattern defined by Kousky and Gan (1981).
Upper Level Streamlines
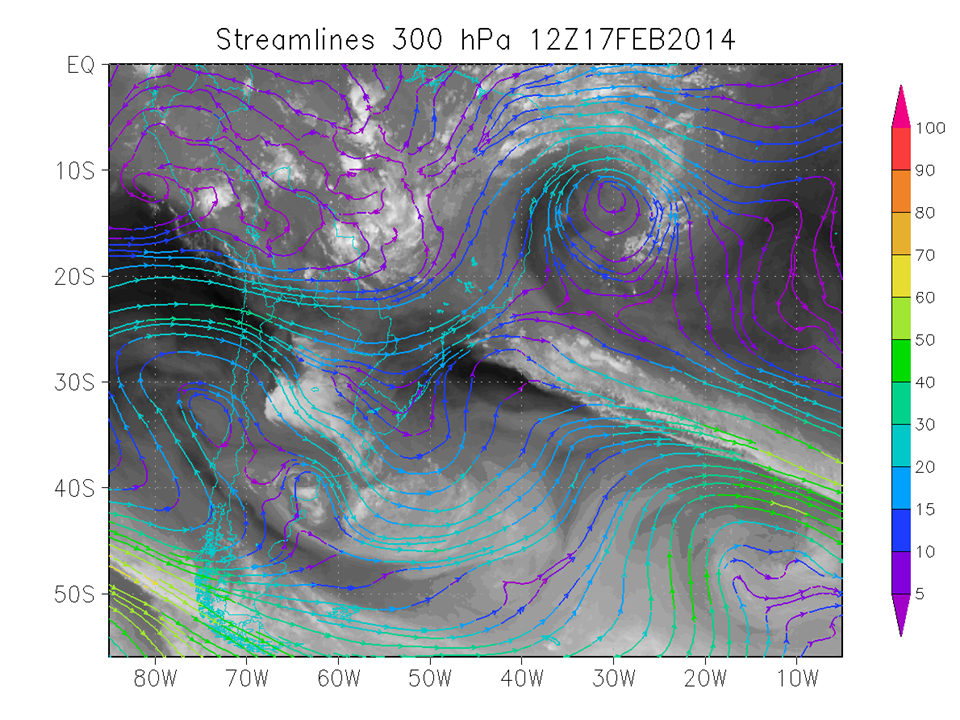
300 hPa streamlines are used to identify the center of the UTCV. At this center of the system, we can see wind coming from the NE, SE, SW and NW (across quadrants one to four in the figure below). The streamlines also show a closed circulation at the same level. Finally, a jet stream can be observed in the northern and northeastern sector of the UTCV at 300 hPa.
|
17 February 2014 / 1200UTC. GOES water vapor image and streamlines at 300 hPa (colored vector).
|
|
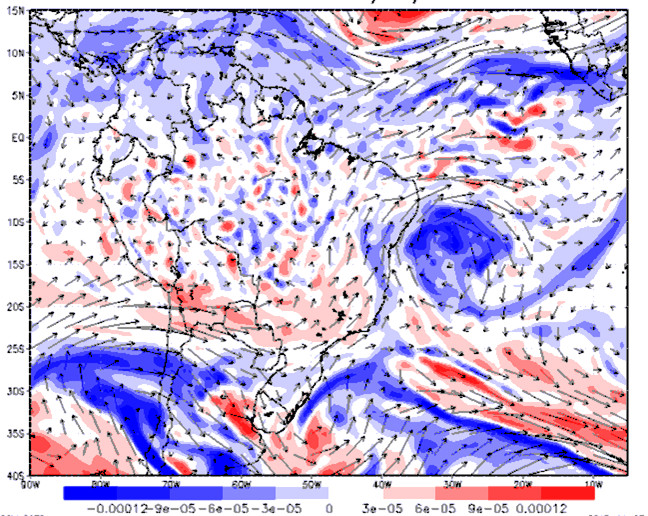
Upper Level Relative Vorticity
In the figure below, we can see an area of minimum relative vorticity in the center of the UTCV. Over southeastern Brazil, we can also identify an area of maximum (positive) relative vorticity, in association with the upper-level ridge downstream of the frontal trough.These two areas form a dipole.
|
17 February 2014 / 1200UTC. Relative vorticity (shaded) and stream lines at 250 hPa on 17 February 2014 at 1200 UTC.
|
|
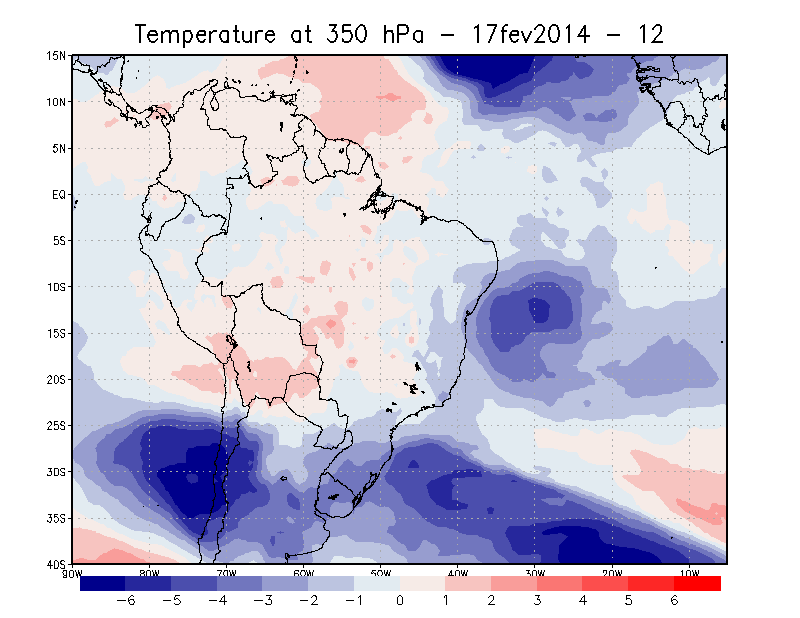
Upper Level Zonal Temperature Deviation
The center of the UTCV is associated with low temperatures. In order to clearly illustrate this feature, we calculate the Zonal temperature deviation at 350 hPa. This local temperature anomaly is shown in the figure below, where we see more negative zonal temperature deviation values around the UTCV center and relatively high, positive values near to the Bolivian High.
|
17 February 2014 / 1200 UTC. 350 hPa Zonal Temperature Deviation.
|
|
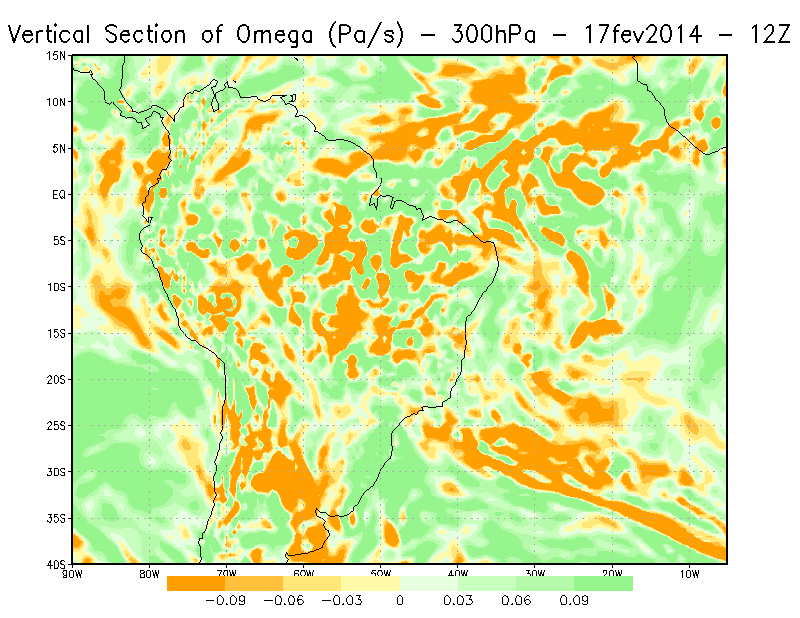
Vertical velocity
The center of the UTCV is associated with downward motion (positive omega values) at upper levels (green color), while upward motion (negative omega values) can be observed over the edge and the frontal system at 350 hPa. In the satellite image, we also see some convection in the center of the UTCV.
|
17 February 2014 / 1200 UTC. 350 hPa Omega (Ps/s).
|
|
Typical Appearance In Vertical Cross Sections
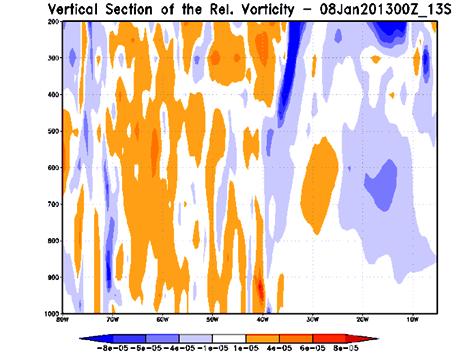
The parameters we use to describe the vertical structure of a UTCV in this conceptual model are the relative vorticity, the zonal deviation of temperature and the vertical velocity.
The first set of figures below show a UTCV in its early stage of development, during which the closed circulation begins to develop in the 300 hPa field.
Figure (b) shows the west-east, vertical cross-section of relative vorticity through the cyclone center (around 11°S), during the formation phase. We can see how the UTCV extends from the tropopause to 500 hPa, with a vertical inclination towards the east.
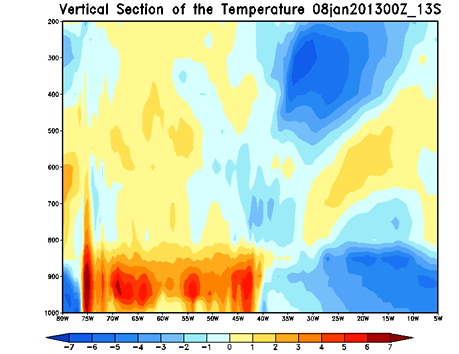
In figure (c) , the cross-section of the zonal air temperature deviation also shows the same vertical inclination of the cold air (negative values), as it extends to 550 hPa. Furthermore, this figure illustrates how positive values appear to the west of the UTCV. These positive values could be associated with the Bolivian High.
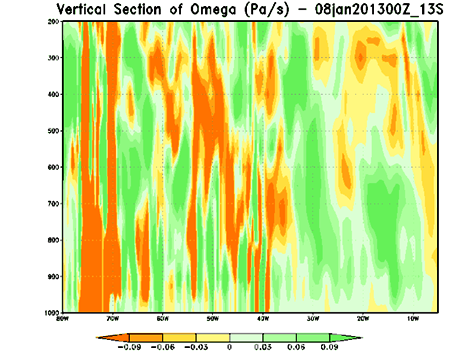
The vertical velocity cross-section in figure (d) indicates clear downwards motion in the UTCV core and upwards motion at the periphery.This vertical motion extends through to low levels.
|
08 January 2013 / 0000 UTC. Infrared satellite image with 300 hPa streamlines (a), vertical cross- section at 13°S for relative vorticity (b), zonal deviation of temperature (c) and vertical velocity (d).
|
|
| a) | b) |
|
|
| c) | d) |
|
|
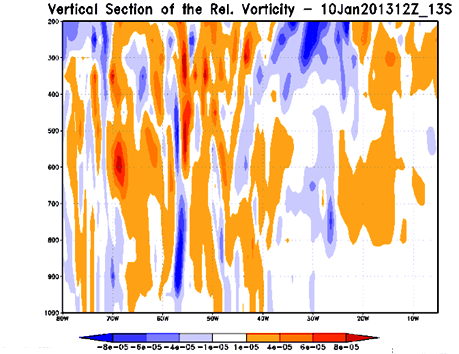
The second set of figures shows the same system during its mature stage. The west-east vertical cross-section of relative vorticity through the cyclone center (13°S) has been produced while the UTCV is over the Atlantic Ocean. Cloud structures in the north-eastern sectors show how the UTCV extends from the tropopause to 350 hPa with a vertical inclination towards the east (b).
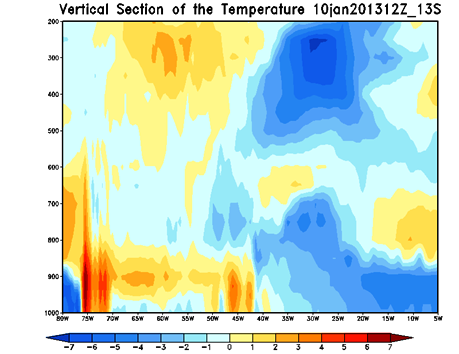
The cross-section of the zonal air temperature deviation (c) continues to show the vertical inclination of the cold air eastwards, extending through to 550 hPa, while also illustrating how the dipole observed in the previous phase has intensified.
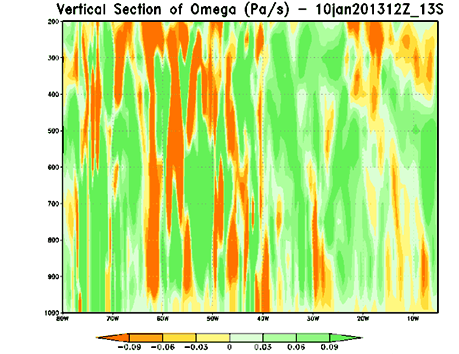
The vertical velocity cross-section in figure (d) again indicates clear downwards motion in the UTCV core and upwards motion at the periphery. In this image, the downwards motion extends to low levels while the upwards motion in the eastern sector is confined to upper levels (500 hPa up to tropopause).
|
10 January 2013 / 1200 UTC. IR image with 300 hPa streamlines (a), vertical cross-section at 13°S for relative vorticity (b), zonal deviation of temperature (c) and vertical velocity (d).
|
|
| a) | b) |
|
|
| c) | d) |
|
|
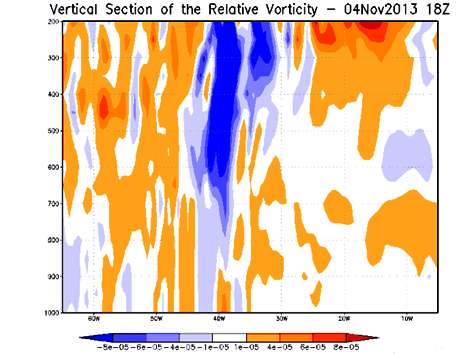
The third set of figures show a "classical" deep UTCV case during the mature stage.
The west-east vertical cross-section of relative vorticity through the cyclone center (13°S) has been compiled while the UTCV was over the coast of northeastern Brazil. We see cloud patterns at the periphery and convective activity in the core. The UTCV extends from the tropopause to 750 hPa, with a small vertical inclination towards the east, from 600 hPa to 300 hPa (b). As expected, this UTCV is deeper than the previous one, with upper cirrus clouds.
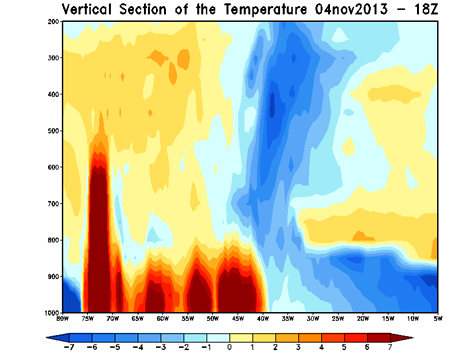
The cross-section of the zonal air temperature deviation (c) once more shows a vertical inclination of the cold air towards the east, this time extending through to 800 hPa., while we also see warmer air in the west at upper levels.
|
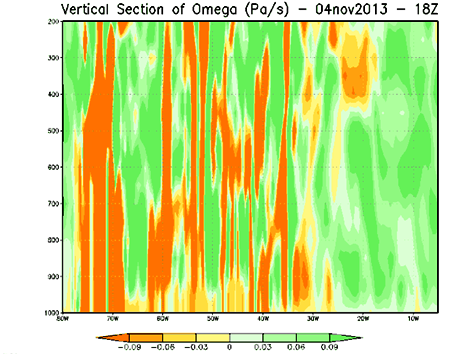
4 November 2013 / 1800 UTC. Water Vapour image (a) and vertical cross section at 18°S for relative vorticity (b), zonal deviation of temperature (c) and vertical velocity (d).
|
|
| a) | b) |
|
|
| c) | d) |
|
|
Weather Events
| Parameter | Description |
|---|---|
| Precipitation |
Precipitation (sometimes intense) can occur at the edge of the system, associated with divergence at high levels (300 hPa) and updrafts.
In many cases we can observe an anticyclonic circulation (Bolivian High) over the continent, which contributes to diffluence and divergence at upper levels, between this high and the UTCV. Convective clouds and intense preciptation may then develop in assocation with the upper-level divergence in this region. At the center of the vortex, cold, dry air in the upper levels (200-500 hpa) and the positive omega (downwards motion) suppresses most precipitation. However, isolated showers may still be observed near the center of the system, due to an additional, local circulation when the system is over the continent. |
| Temperature | The center of the system has clear skies. Cloudy skies, with rainfall and/or convective clouds can be seen at the edge. |
| Wind (including gusts) | Strong winds may be observed close to the edge of the system, at upper levels (300-200 hPa). This occurs mainly in the northern and northeastern areas. This could cause turbulence at upper levels, due to the strong gradient in the streamlines. |
|
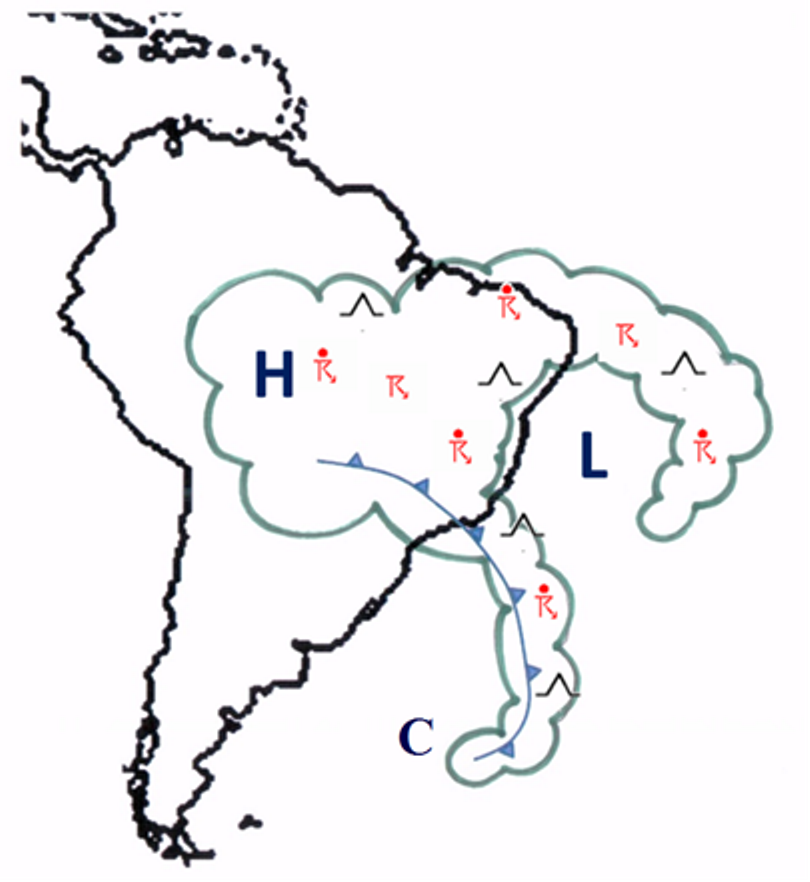
Schematic of weather events associated with UTCV: H and L represent the mean position of high and low pressure systems at high levels. Convective clouds (sometimes associated with high volumes of rain) are observed over the continent, while clear skies, associated with dry and sinking air, are observed at the center of the system.
|
|
|
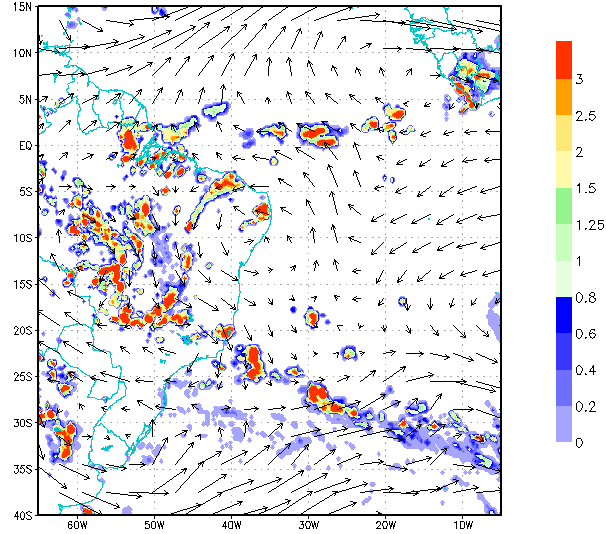
17 February 2014/00:00 UTC. Wind at 250 hPa (GFS analysis) and 3-hourly accumulated precipitation using the TRMM Multi-satellite Precipitation Analysis (TMPA) product.
|
17 February 2014/00:00 UTC. GOES13-Meteosat 9 WV 6.7 composite image.
|
|
|
|
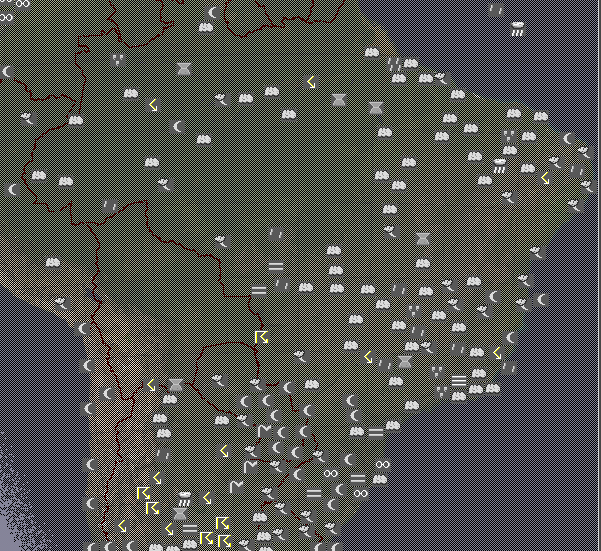
17 February 2014/00:00 UTC. Significant Weather (source: Ogimet)
|
|
References
General Meteorology and Basics
- COUTINHO, M. D. L. Objective method to identify upper level cyclonic vortices over southern tropical region: validation and climatology (In portugueses: Método objetivo de identificação dos vórtices ciclônicos de altos níveis na região tropical sul: validação e climatologia). Master Thesis, Instituto Nacional de Pesquisas Espaciais (INPE). São José dos Campos, 2008.
- COUTINHO, M. D. L.; GAN, M. A.; RAO, V. B. Objective method to identify upper level cyclonic vortices over southern tropical region: validation (In portugueses: Método objetivo de identificação dos vórtices ciclônicos de altos níveis na região Tropical Sul: validação). Brazilian Journal of Meteorology, 25:311-323, 2010.
- KOUSKY, V. E.; GAN, M. L. Upper tropospheric cyclonic vortices in the subtropical South Atlantic. Tellus, v. 33, p. 538-551. 1981.
- CMISHRA, S. K.; RAO, V. B.; GAN, M. A. Structure and evolution of the large-scale flow and an embedded upper tropospheric cyclonic vortex over northeast Brazil. Monthly Weather Review, v. 129, p. 1673-1688, 2001.
- MORAIS, M. D. C. Upper level cyclonic vortices over Norteast of Brazil: Observational and numerical study (In portugueses: Vórtice ciclônico de altos níveis no nordeste do Brasil: estudo observacional e numérico). PhD Dissertation (in preparation), 2016.
- RAMIREZ, M. C. V. KAYANO, M. T.; FERREIRA, N. J. Statistical analysis of upper tropospheric vortices in the vicinity of northeast Brazil during the 1980-1989 period. (INPE-10582-PRE/604412). Atmósfera., v.12, p. 75-88, Apr. 1999.