Meteorological Physical Background
Broad Overview
The upper tropospheric cyclonic vortices (UTCVs) are synoptic-scale, low-pressure systems with maximum cyclonic circulation at upper levels. They usually develop from a deep upper-level trough over the northeastern coast of Brazil and the adjacent Atlantic Ocean. Figure 1 shows a UTCV over the Atlantic Ocean, close to the northeastern coast of Brazil, on 17 February 2014 at 1800 UTC.
|
17 February 2014 at 1800 UTC Thermal Infrared (11 µm) channel for GOES-Meteosat composite image.
|
17 February 2014 at 1800 UTC Water Vapour (6.7 µm) channel for GOES-Meteosat composite image.
|
|
|
The UTCVs are formed in the 200-300hPa layer (Kousky and Gan 1981; Ramirez et al. 1999, Mishra, 2001) and extend to mid and low levels (Morais, 2015). Most of these vortices have a lifetime of 3 days but some can persist for more than 10 days (Ramirez et al. 1999 e Coutinho 2008). Their wavelength is around 2000-3000 km.
Seasonal Variety
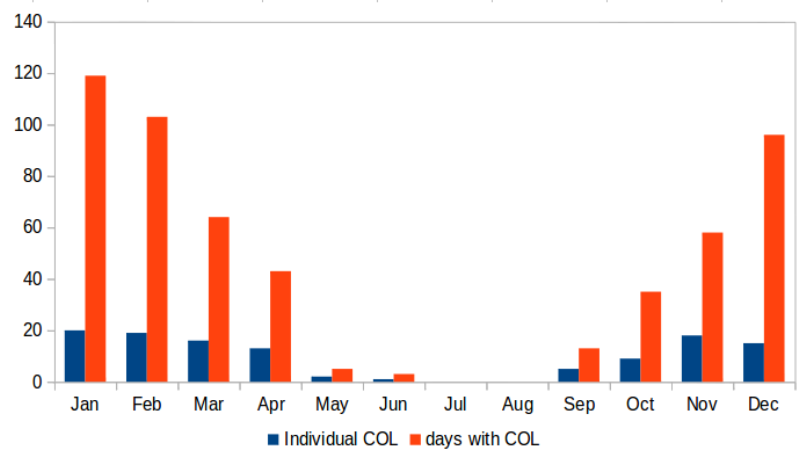
UTCVs can occur at any time of the year but are most frequently observed during the summer months. The 5 year average analysis (2002-2006 period) by Coutinho et al. (2010), in the figure below, shows the number of individual UTCVs (whole life cycle) observed using WV satellite imagery and the number of individual days with UTCVs.
|
Number of individual UTCVs (whole life cycle) observed using WV satellite imagery and the number of days with UTCVs (source: Coutinho, 2010).
|
|
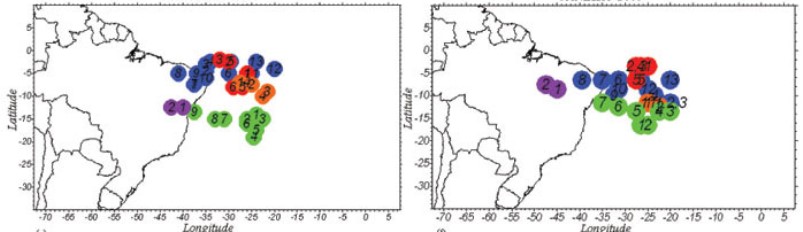
The UTCVs normally show a counterclockwise trajectory , propagating eastwards when they are south of 15°S and westwards when they are north of 15°S. Figure 4 shows some examples of these UTCV paths.
|
Path of the 200 mb cyclone during January 2003. The colored cycle represents the UTCVs and the numbers indicate the sequence of 12 hours. The figure on the left shows the formation time and that on the right shows a period twelve hours later. Source: Coutinho (2010).
|
|
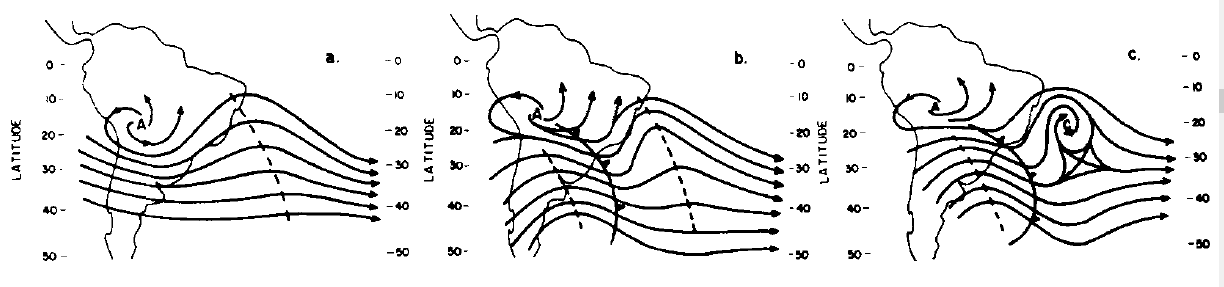
In many cases, the genesis of a UTCV is associated with cold frontal systems, penetrating from high latitudes to low latitudes. Strong low and mid-level warm advection precedes the active cold front. This warm advection then amplifies the upper-level ridge downstream, which contributes to the amplification of the downstream trough located over northeastern Brazil and the Atlantic Ocean. The vortex formation mechanism was proposed by Kousky and Gan (1981) and is schematically illustrated below. Figure (a) shows the typical summer circulation pattern over South America and the South Atlantic (200 hPa). Figure (b) shows an active mid-latitude, upper-level trough over South America, its associated surface-level cold front in southern Brazil and a strong upper-level ridge, extending from southeastern Brazil out, over the Atlantic. A sharpening of the trough pattern can be seen over the western Atlantic region. Finally, the cold front moves over southeastern Brazil and a UTCV forms in the western Atlantic.
|
Schematic sequence for the formation of a 200 hPa subtropical cyclone in the South Atlantic. Source: Kousky and Gan (1981).
|
|
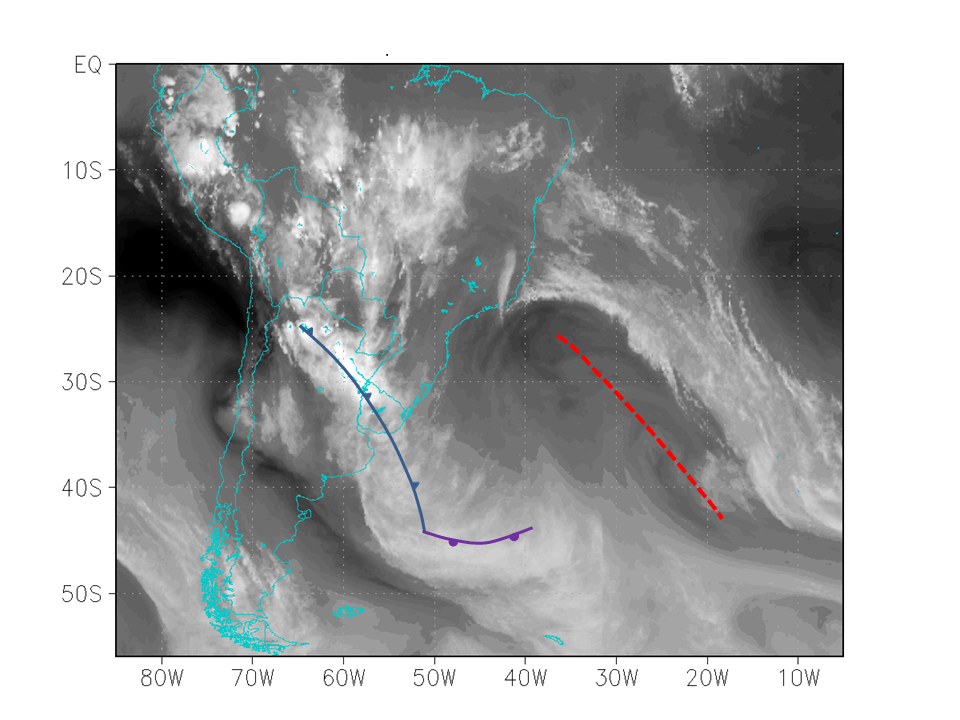
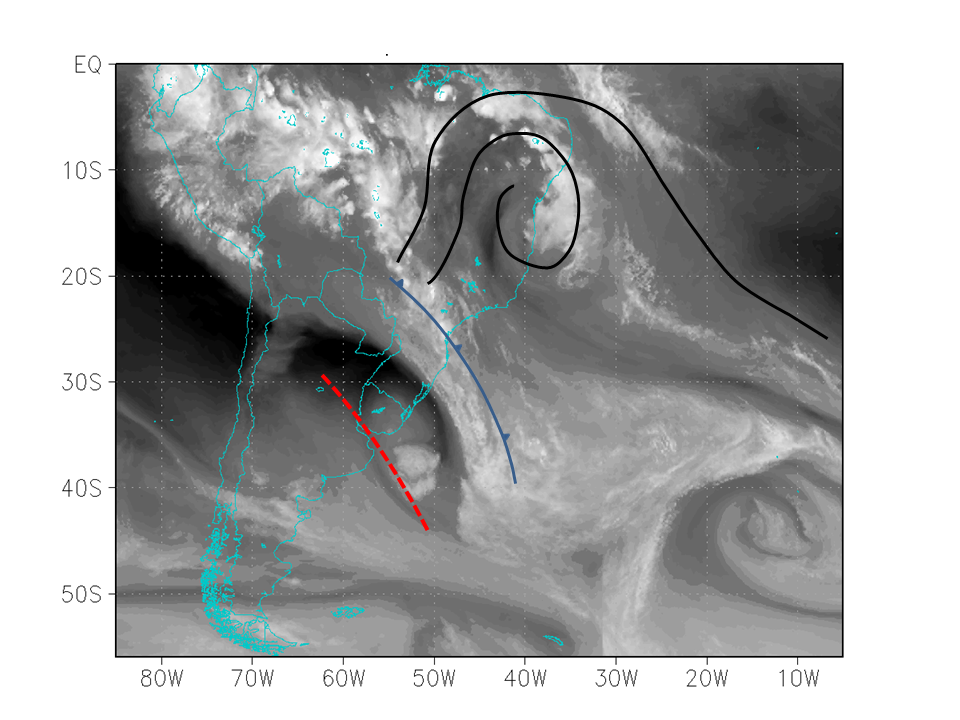
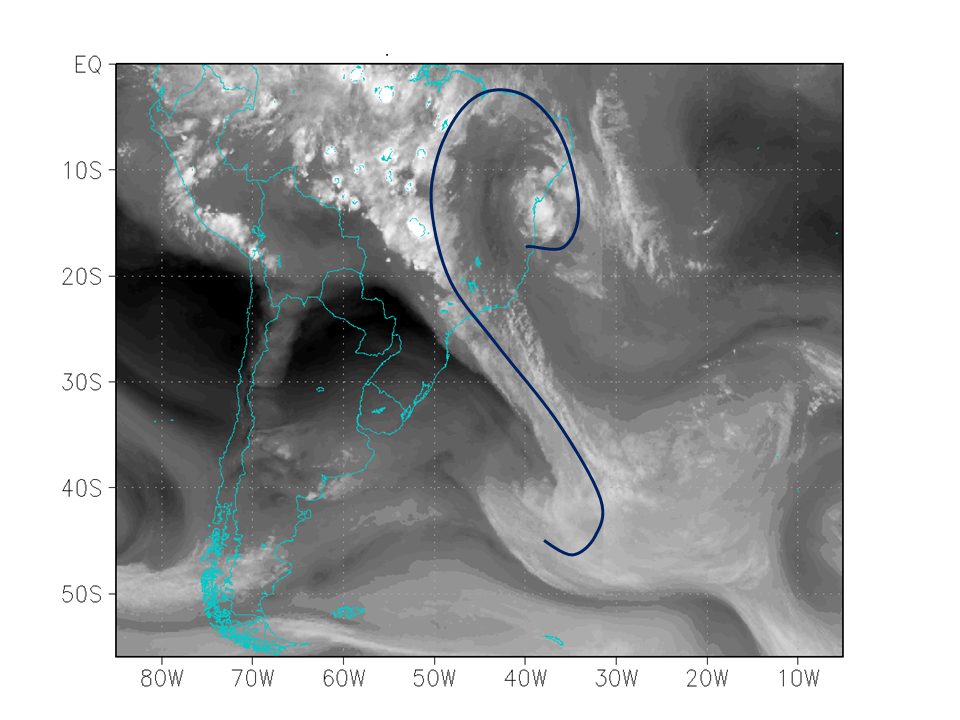
In the water vapor satellite image sequence (figure below) for 01 November 2013 at 23:45 UTC, we can see the vortex formation mechanism as described by Kousky and Gan. During the first stage, a cold frontal system is located over southern Brazil, preceded by strong low and mid-level warm advection. This warm advection amplifies the upper-level ridge downstream, which then helps to amplify the downstream trough located over northeastern Brazil and the Atlantic Ocean (02 Nov. 2013). During the last two days, we see a sharpening of the trough pattern over the western Atlantic and finally, the cold front moves to southeastern Brazil and a UTCV can be seen over the tropical Atlantic Ocean.
When the UTCV is close to the continent, the western edge of the UTCV interacts with the continental tropical convection and cloud structures develop in this section of the system (c). Once the UTCV center moves over the continent, convective activities can develop in the center of the system during the afternoon and evening hours (d). During the day, heat from below (low levels) meets cold air in the mid and upper levels associated with the UTCV, to produce a situation sufficiently unstable for convective clouds to develop. The latent heat release associated with the convection in the UTCV center then leads to dissipation of the system. UTCVs located over oceanic areas do not normally dissipate and are instead absorbed by a mid-latitude trough
| a) | b) |
|

|
| c) | d) |
|
|
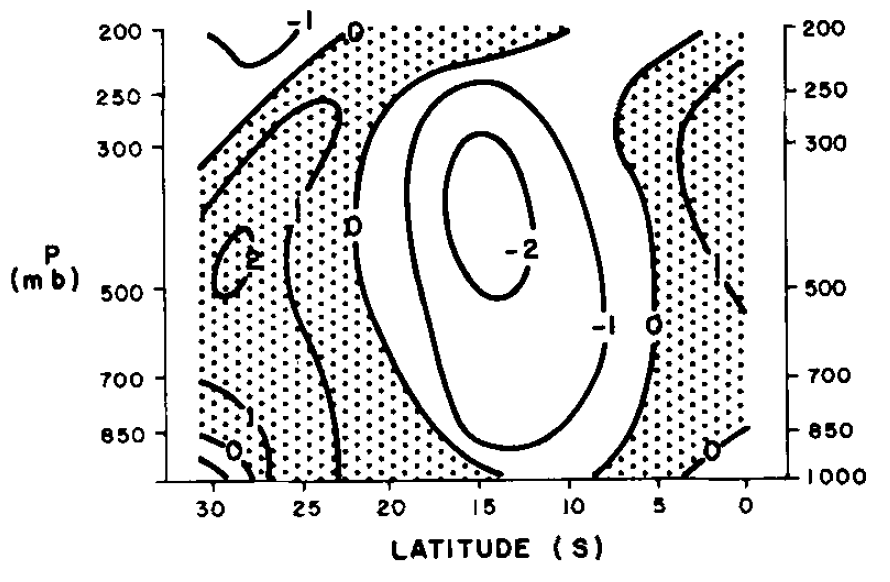
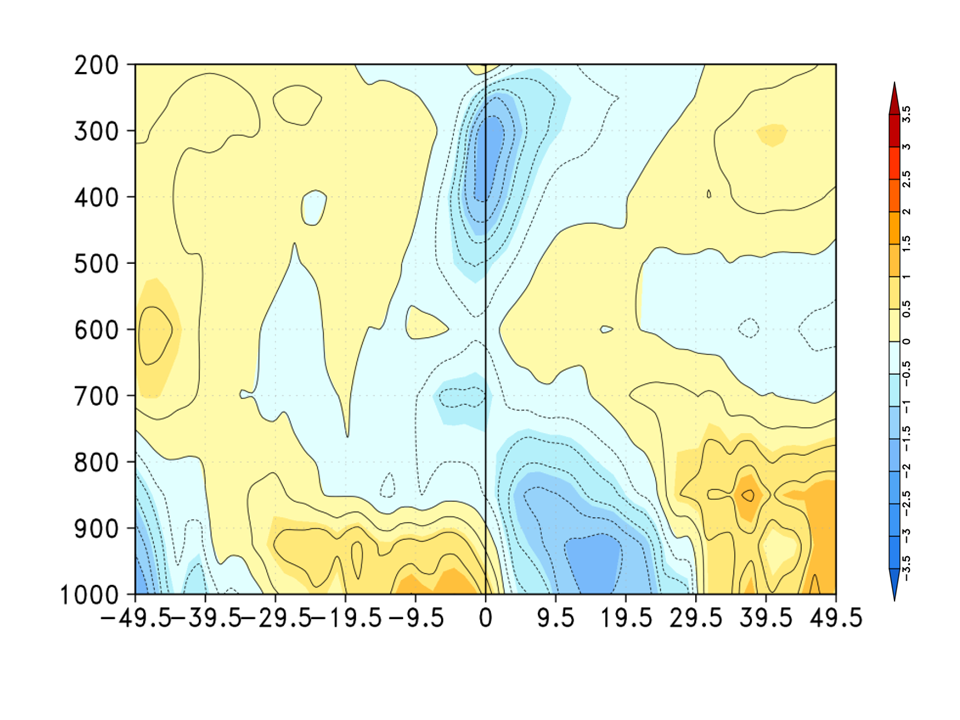
The UTCVs are characterized by a cold core. The coldest temperatures are observed at mid-upper levels of the troposphere, while temperatures near the surface are relatively unaffected by the presence of the vortex (Kousky and Gan, 1981). While the first image shows a vertical section of the zonal average temperature anomaly for one particular day, the second one shows a composite of 61 cases during a 10 year period (2003-2013). The composite is based on the minimum relative vorticity at 200 hPa for each system during the whole life cycle.
|
North-south vertical cross section of temperature deviations from longitudinal mean values for 12 March 1978 at 40°W longitude. A longitudinal mean temperature for each level was calculated first. Unit: °C. Source: Kousky and Gan (1981).
|
Field composite of the vertical cross section of the temperature deviation (°C) for 2003-2013 period with vertical axis fixed at the Center for UTCVs in the formation time. The line passes through the middle of the UTCV (0.0) and horizontal axis shows the width spacing in degrees from that center. Source: Morais (2015).
|
|
|