Key Parameters
Water Vapour imagery
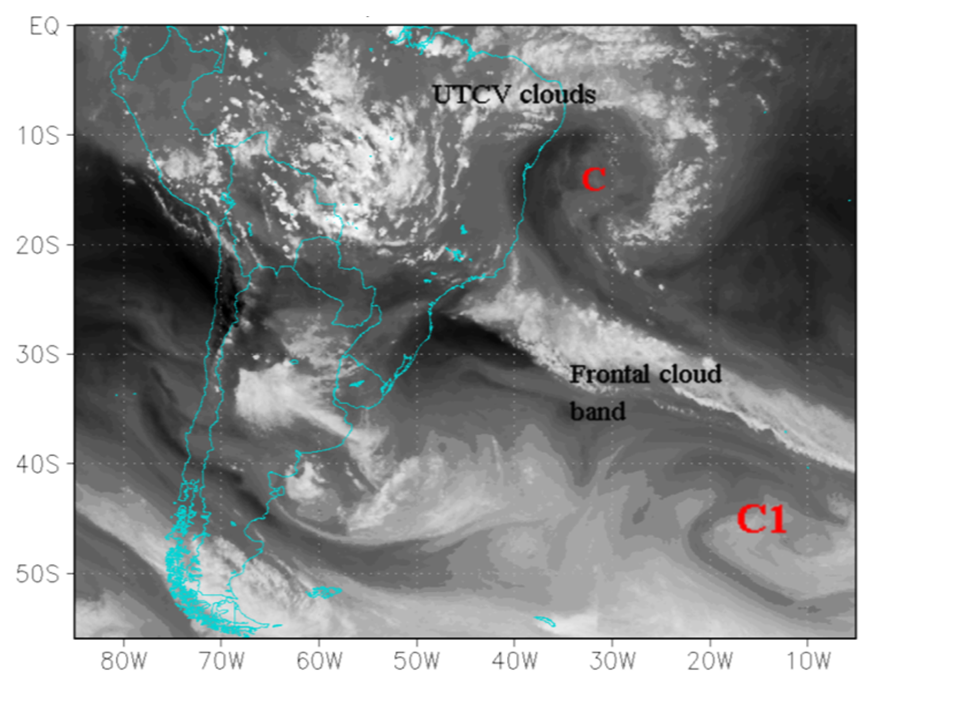
WV imagery shows the distribution of moisture/humidity around the UTCV at mid and upper atmospheric levels. The dark areas represent dry air, the mid-gray areas show moisture in the upper atmosphere and the brighter, white features indicate upper-level cloud structures.
|
February 2014 / 1200UTC Water Vapour 6.2 µm image. The letter C indicates the UTCV center and C1 the extratropical cyclone.
|
|
The clouds associated with the UTCV, the frontal system and the extratropical cyclone merge to form the typical "S" pattern defined by Kousky and Gan (1981).
Upper Level Streamlines
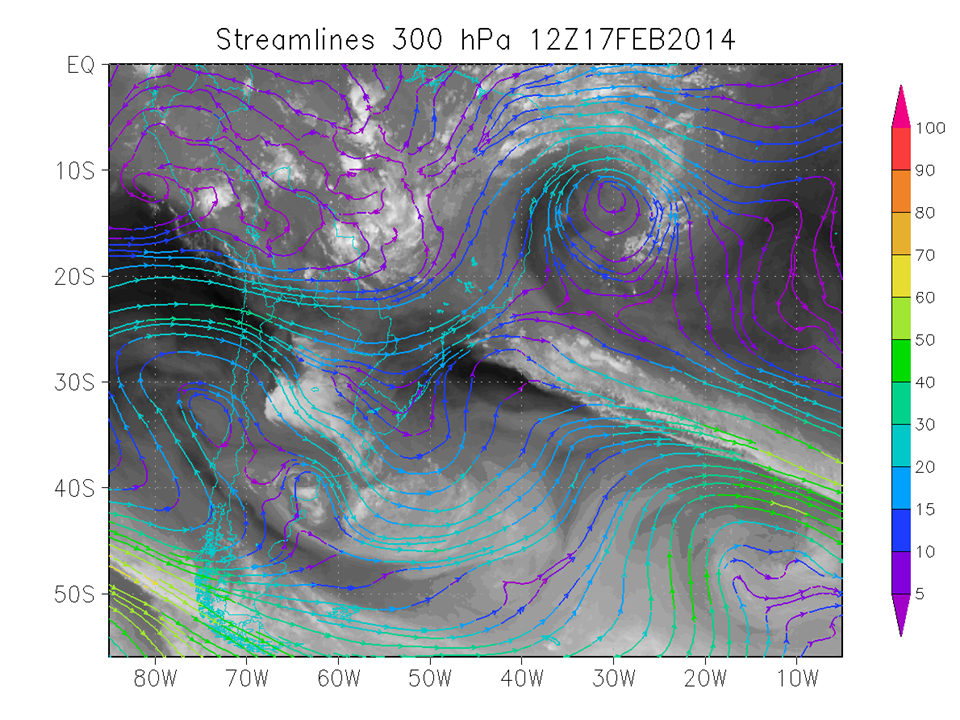
300 hPa streamlines are used to identify the center of the UTCV. At this center of the system, we can see wind coming from the NE, SE, SW and NW (across quadrants one to four in the figure below). The streamlines also show a closed circulation at the same level. Finally, a jet stream can be observed in the northern and northeastern sector of the UTCV at 300 hPa.
|
17 February 2014 / 1200UTC. GOES water vapor image and streamlines at 300 hPa (colored vector).
|
|
Upper Level Relative Vorticity
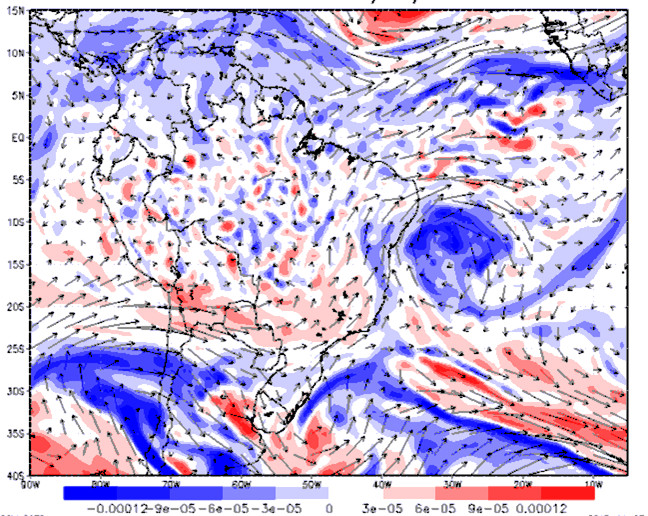
In the figure below, we can see an area of minimum relative vorticity in the center of the UTCV. Over southeastern Brazil, we can also identify an area of maximum (positive) relative vorticity, in association with the upper-level ridge downstream of the frontal trough.These two areas form a dipole.
|
17 February 2014 / 1200UTC. Relative vorticity (shaded) and stream lines at 250 hPa on 17 February 2014 at 1200 UTC.
|
|
Upper Level Zonal Temperature Deviation
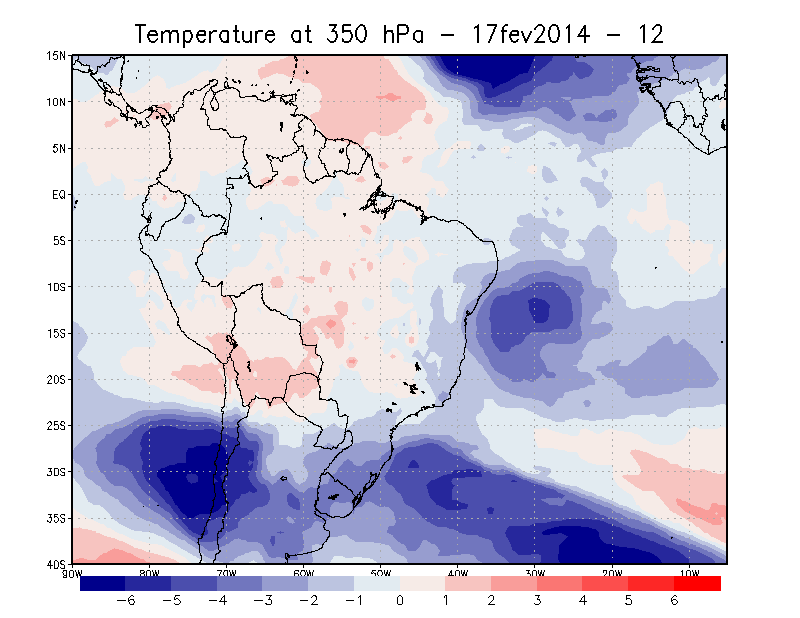
The center of the UTCV is associated with low temperatures. In order to clearly illustrate this feature, we calculate the Zonal temperature deviation at 350 hPa. This local temperature anomaly is shown in the figure below, where we see more negative zonal temperature deviation values around the UTCV center and relatively high, positive values near to the Bolivian High.
|
17 February 2014 / 1200 UTC. 350 hPa Zonal Temperature Deviation.
|
|
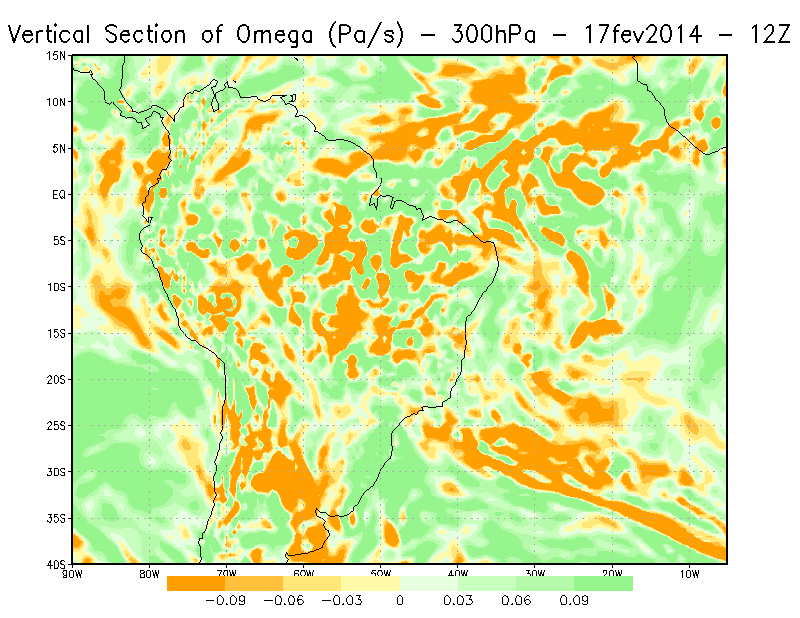
Vertical velocity
The center of the UTCV is associated with downward motion (positive omega values) at upper levels (green color), while upward motion (negative omega values) can be observed over the edge and the frontal system at 350 hPa. In the satellite image, we also see some convection in the center of the UTCV.
|
17 February 2014 / 1200 UTC. 350 hPa Omega (Ps/s).
|
|