Appearance in Satellite Data
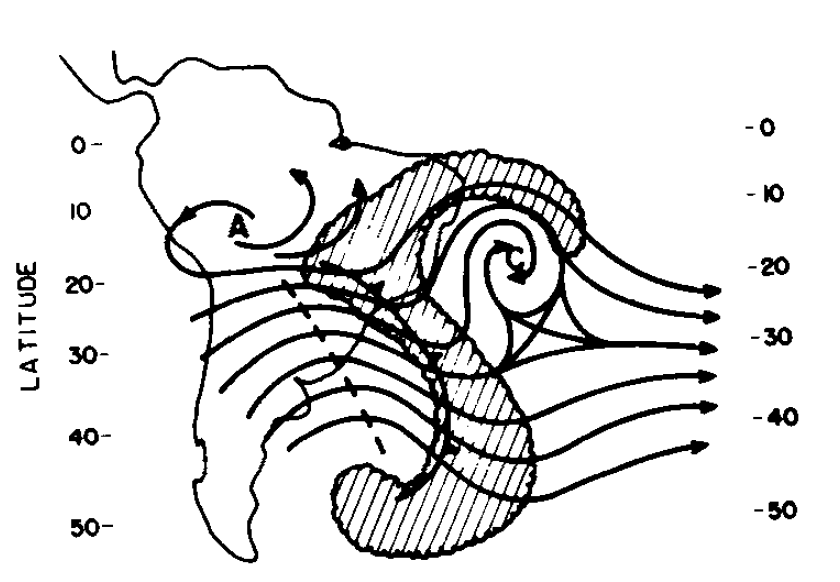
The cloud patterns associated with UTCVs vary considerably, depending on their intensity and depth. At mid and upper levels, we often see these cloud patterns form in connection with situations such as those in the figures (schematic and IR image) below. Here we can see that the cloud structures associated with the UTCV have merged with those of the extratropical low pressure and frontal system, to produce an "S" shape. In some case, convective clouds in the western sector of the vortex will interact with the circulation from the Bolivian High.
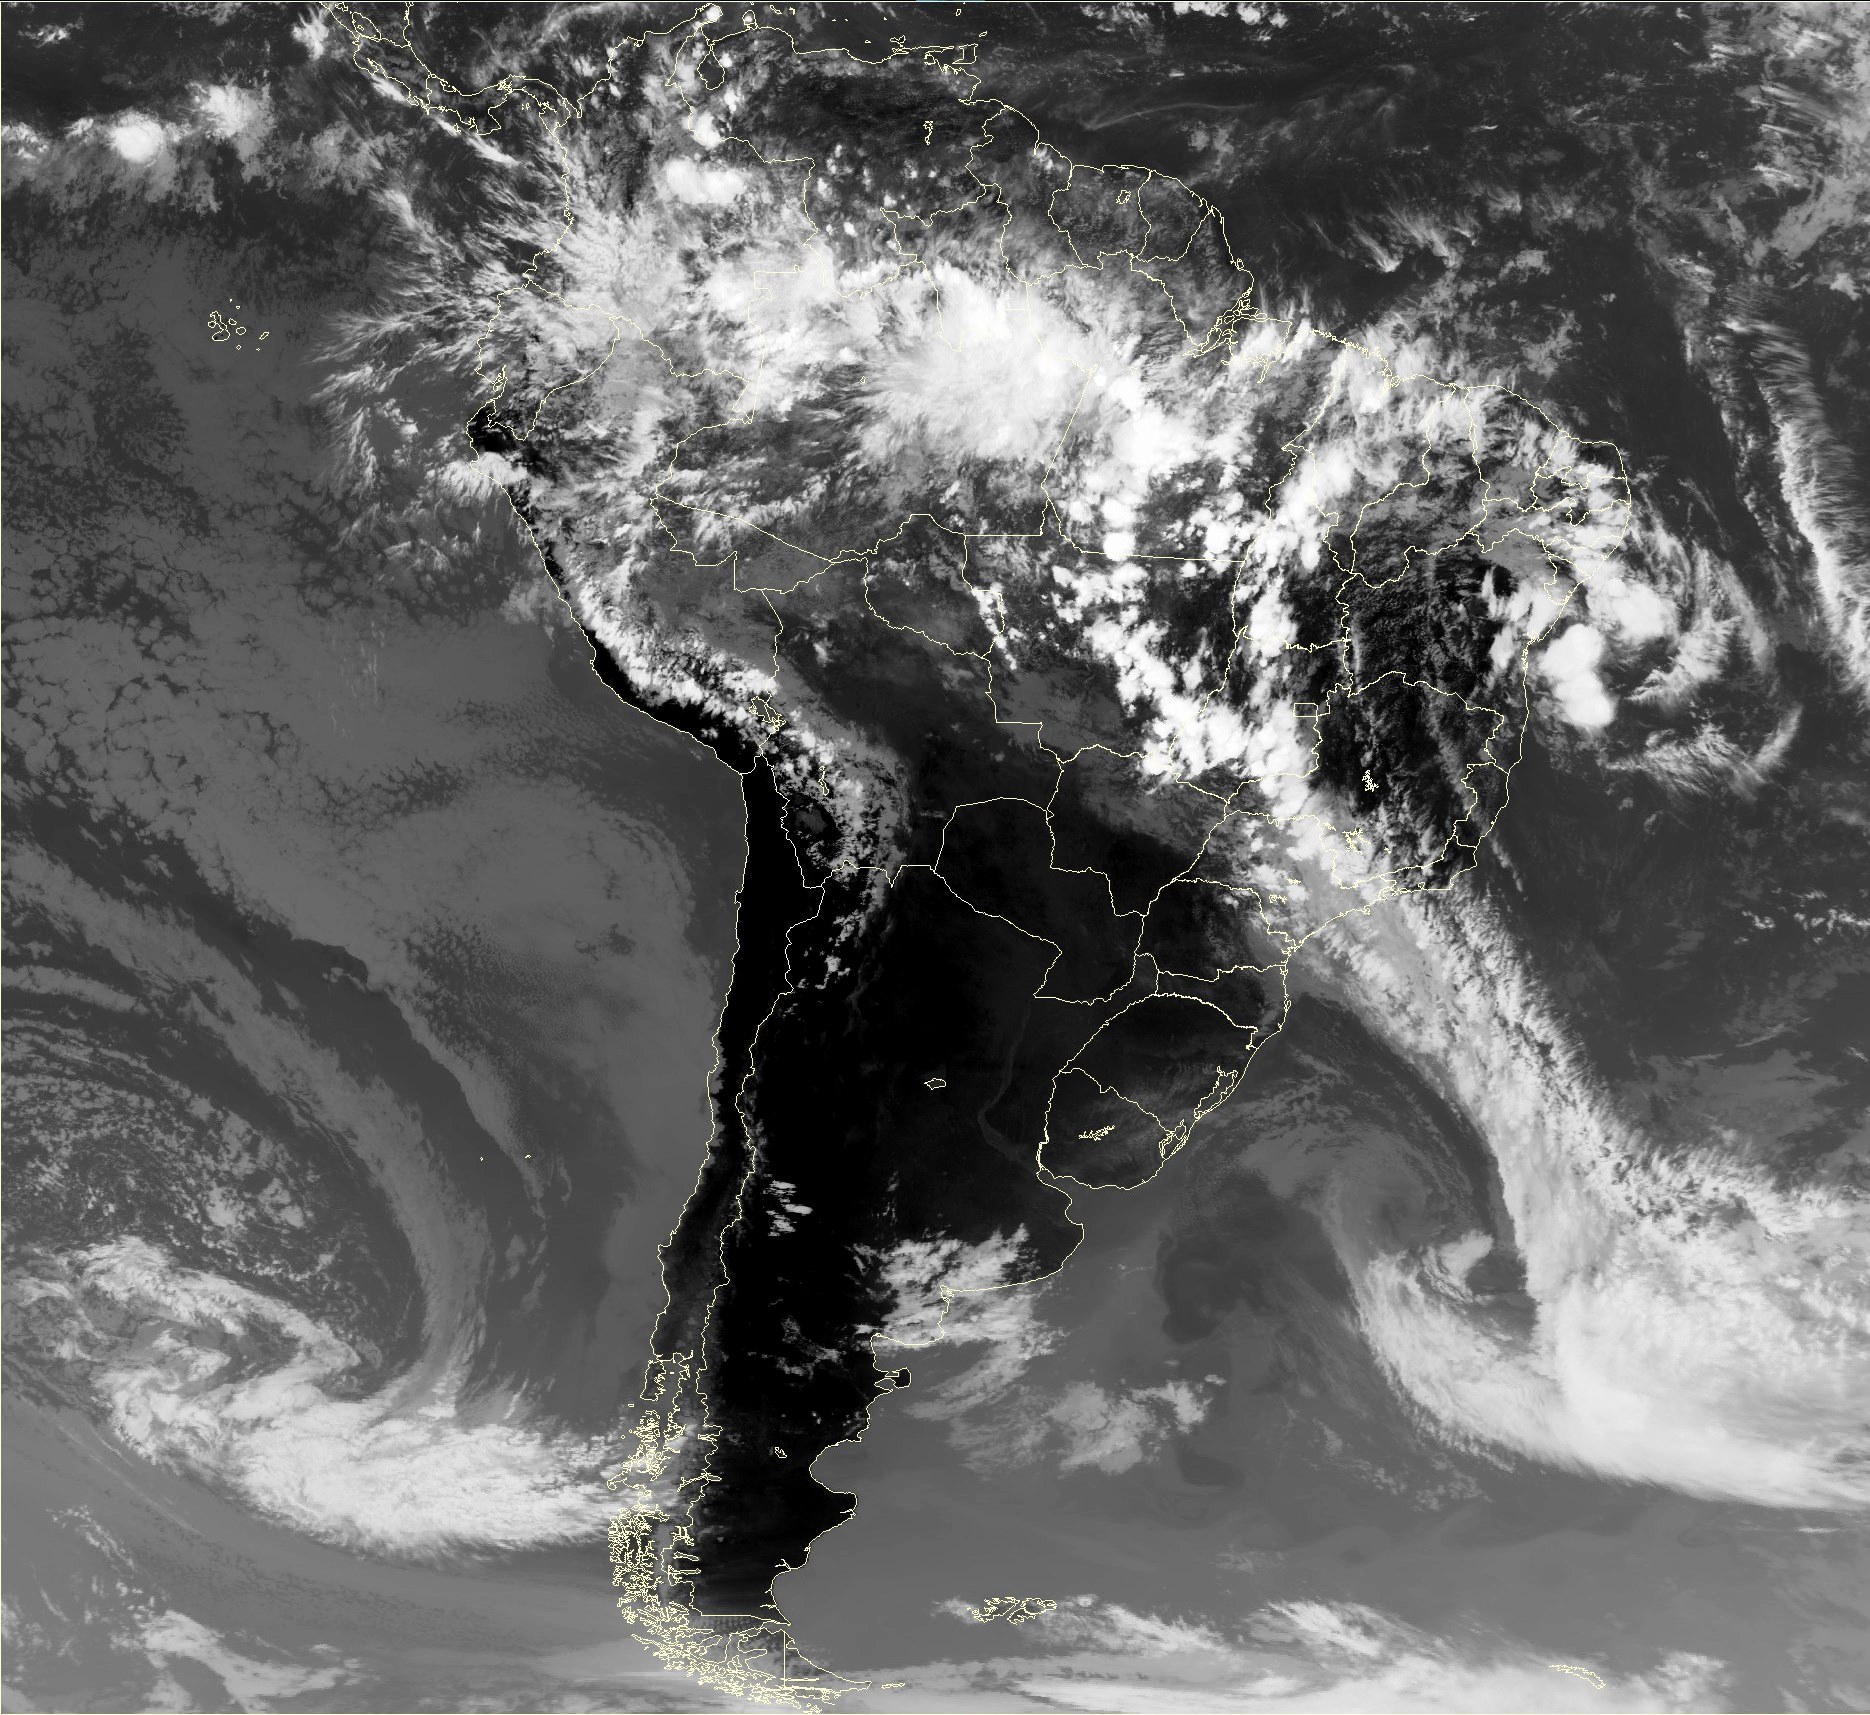
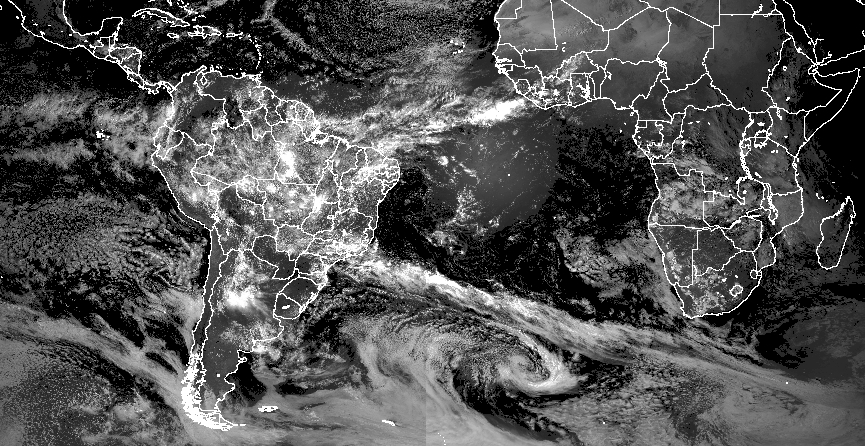
Although the center of the UTCV is generally a clear region, characterized by subsidence, convection activity can also be observed near the center when the UTCV is over the continent (see the satellite image below). This generally indicates that cyclonic vortices are passing over warm oceanic waters or continental areas.
|
Schematic illustration of middle and high clouds for UTCV. Source: Kousky and Gan (1981).
|
04 November 2013 / 18 UTC. GOES-13 IR image.
|
|
|
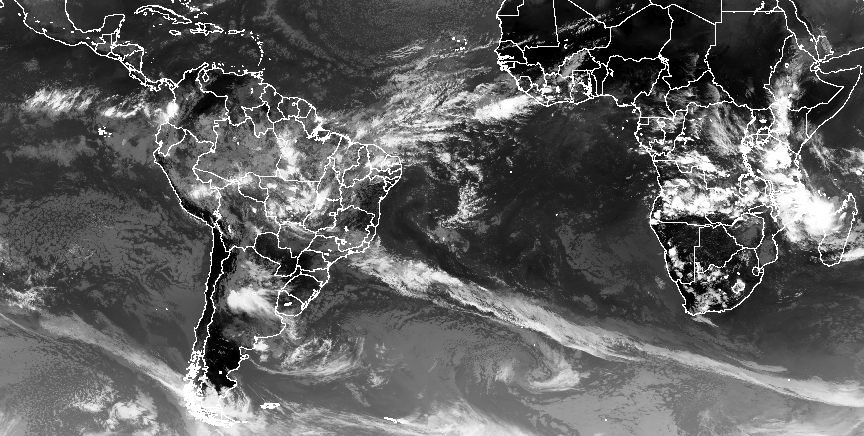
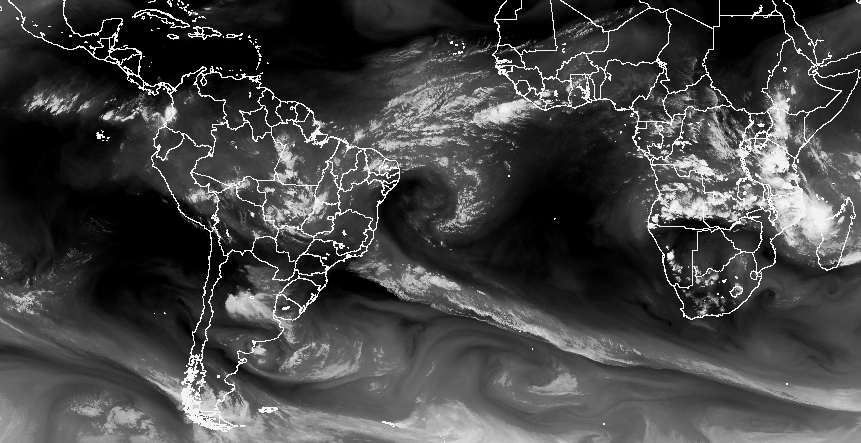
In the images below, we see an example of cloud patterns, taken on 17 February 2014 at 1745 UTC, using infrared and water vapor satellite images. In these figures we can see dry air in the center (darker gray in the WV channel) surrounded by moist air forming a dark tongue and spiral shape (different shade of gray) in the UTCV center. Convection at the edge of the system is indicated by the brighter white tones. Because there are many cirrus clouds around the UTCV, this system is difficult to identify in the visible channel.
We can also see the presence of an anticyclonic circulation (Bolivian High) over the continent, which contributes to diffluence and divergence at upper levels between this high and the UTCV. Convective clouds then form in this region, in association with this divergence.
|
17 February 2014/1745 UTC - thermal infrared (11 µm), water vapor (6.7 µm) and visible (0.8 µm) channels for GOES-Meteosat composite images.
|
|
|
|
|
|
The evolution of a UTCV over northeastern Brazil and the tropical South Atlantic Ocean can be seen in the infrared (11 µm) satellite image, superimposed with 300 hPa streamlines (figure below) for the system which occurred on January 08, 2013. An upper-level trough associated with upper-level cloud structures (cirrus) is shown at 1200 UTC 06 January (red dashed line in figure "a" below). On the next day (figure "b" below), the trough over the coast of northeastern Brazil (30oW) had evolved to a closed circulation and the upper clouds had dissipated (cirrus are observed in other cases). At 0000 UTC 08 January 2013 (figure "c" below) the trough appears closed (see letter C in figure "c" below) indicating that the UTCV has now formed. Although the cloud structures associated with a UTCV will vary according to their intensity and depth, the presence of a wide upper-level band of clouds with a cyclonic curvature is a typical pattern associated with a UTCV (as showed in the figures "a" and "d"). The clouds are located over the periphery of the UTCV. When the trough changes to a closed circulation, the clouds appear on the eastern side of the system and the core is then free of clouds (figure "d" below).
| a) | b) |
|
|
| c) | d) |
|
|