Cloud Structure In Satellite Images
Tropical weather systems are associated with wide spread convection and high water vapour content in the atmosphere. Some examples are provided for
- The Intertropical Convergence Zone (ITCZ)
- Easterly lows
- Continental tropical lows
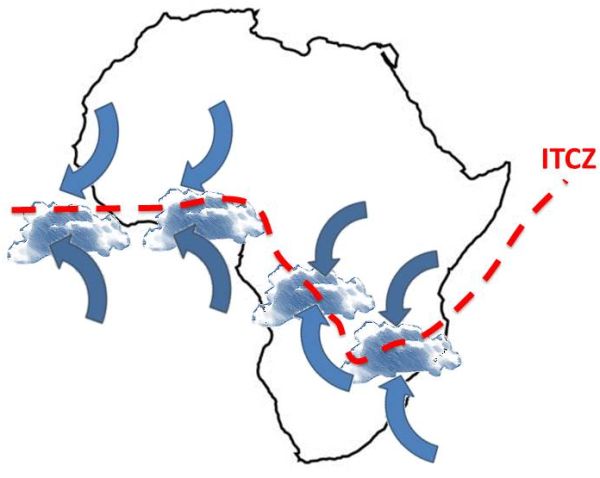
Position of the ITCZ over the ocean and continent of Africa
|
Schematic of the position of the ITCZ over the ocean and continent of Africa
|
|
Intertropical convergence zone (ITCZ) over the Ocean
|
15 January 2013 1200 UTC - MSG IR 10.8 image.
|

|
The ITCZ is situated in the convergence zone over the coast of West Africa but the maximum cloud cover is situated equator ward of this zone. Convective cloud is visible in a line over the Atlantic Ocean.
|
15 January 2013 1200 UTC - MSG WV 6.9-7.9 Image.
|

|
This water vapour image shows the position of the ITCZ where abundant mid-level moisture is available in the grey shades over the Atlantic Ocean.
Intertropical convergence zone (ITCZ) over the continent
|
15 January 2013 1200 UTC - MSG Day Natural Colors RGB image.
|
|

|
Over the continent of Africa the area of convective development extends much further south than over the ocean. This convective development is only partially caused by the ITCZ and other factors such as convection also play a role. |
|
15 January 2013 1200 UTC - MSG WV 6.9-7.9 Image.
|
|

|
The southward extend of the ITCZ is clearly visible on this image as mid-level moisture extends from the equator to close to 30° S |
Easterly Lows
|
8 January 2013 0000 UTC - MSG IR 10.8 Image.
|

|
Two easterly waves are present on this image. Large MCS develop to the east of the low over Angola.
A series of easterly lows develop on this loop. The waves move slowly eastwards and eventually disappear over the Atlantic Ocean, while re-development takes place over Mozambique. Convective development occurs east of these waves on nearly every day.

|
Press "Play Button" to see the loop; 6th January 2013 06 UTC Start - 10th January 2013 00 UTC End - MSG IR 10.9 Image. |
Continental Tropical Low
|
19 January 2013 1200 UTC - MSG IR 10.8 image and 700 hPa winds (in knots)
|

|
On the IR 10.8 image the cyclonic circulation into the low situated over Botswana is clearly visible but also the anticyclonic curvature of the cirrus stretching out into the Indian Ocean.
|
19 January 2013 1200 UTC - MSG Day Microphysics RGB and 300 hPa winds (in knots)
|

|
Mid-level cloud (magenta shades) is visible over southeastern South Africa with a band of cirrus above that stretching into the Indian Ocean. This cirrus lies on the southern side of the upper level high. Active, high and fast developing convective cloud is present over western Zimbabwe (orange colours) with older decaying convective cells over northern South Africa.
|
19 January 2013 1200 UTC - MSG Airmass RGB Image
|

|
On the airmass RGB the brown colours to the west of the low confirms that drier air is present in the west with moist tropical air over the eastern parts.
|
19 January 2013 1200 UTC - MSG Airmass RGB Image and 300 hPa geopotential heights.
|

|
The WV 6.2 image indicates the high water vapor content of the higher levels of the troposphere over Botswana and Zimbabwe.
The continental tropical low moves from the border of Botswana/Namibia on the 18th to the coast of Mozambique on the 21st of January 2013. The cyclonic curvature is visible in the lower level circulation and the anticyclonic circulation in cold cirrus cloud. Convective development takes place mostly to the east and north of the surface low pressure system.
|
|
Press "Play Button" to see the loop; 18th January 2013 00 UTC Start - 21st January 2013 00 UTC End - MSG IR 10.8 |