Table of Contents
Cloud Structure In Satellite Images
Tropical weather systems are associated with wide spread convection and high water vapour content in the atmosphere. Some examples are provided for
- The Intertropical Convergence Zone (ITCZ)
- Easterly lows
- Continental tropical lows
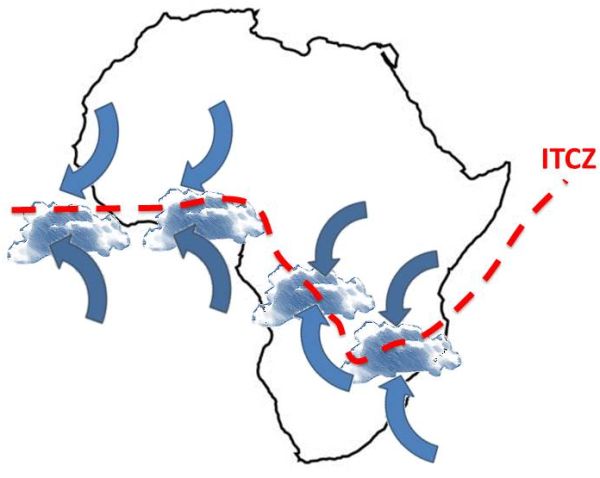
Position of the ITCZ over the ocean and continent of Africa
|
Schematic of the position of the ITCZ over the ocean and continent of Africa
|
|
Intertropical convergence zone (ITCZ) over the Ocean
|
15 January 2013 1200 UTC - MSG IR 10.8 image.
|

|
The ITCZ is situated in the convergence zone over the coast of West Africa but the maximum cloud cover is situated equator ward of this zone. Convective cloud is visible in a line over the Atlantic Ocean.
|
15 January 2013 1200 UTC - MSG WV 6.9-7.9 Image.
|

|
This water vapour image shows the position of the ITCZ where abundant mid-level moisture is available in the grey shades over the Atlantic Ocean.
Intertropical convergence zone (ITCZ) over the continent
|
15 January 2013 1200 UTC - MSG Day Natural Colors RGB image.
|
|

|
Over the continent of Africa the area of convective development extends much further south than over the ocean. This convective development is only partially caused by the ITCZ and other factors such as convection also play a role. |
|
15 January 2013 1200 UTC - MSG WV 6.9-7.9 Image.
|
|

|
The southward extend of the ITCZ is clearly visible on this image as mid-level moisture extends from the equator to close to 30° S |
Easterly Lows
|
8 January 2013 0000 UTC - MSG IR 10.8 Image.
|

|
Two easterly waves are present on this image. Large MCS develop to the east of the low over Angola.
A series of easterly lows develop on this loop. The waves move slowly eastwards and eventually disappear over the Atlantic Ocean, while re-development takes place over Mozambique. Convective development occurs east of these waves on nearly every day.

|
Press "Play Button" to see the loop; 6th January 2013 06 UTC Start - 10th January 2013 00 UTC End - MSG IR 10.9 Image. |
Continental Tropical Low
|
19 January 2013 1200 UTC - MSG IR 10.8 image and 700 hPa winds (in knots)
|

|
On the IR 10.8 image the cyclonic circulation into the low situated over Botswana is clearly visible but also the anticyclonic curvature of the cirrus stretching out into the Indian Ocean.
|
19 January 2013 1200 UTC - MSG Day Microphysics RGB and 300 hPa winds (in knots)
|

|
Mid-level cloud (magenta shades) is visible over southeastern South Africa with a band of cirrus above that stretching into the Indian Ocean. This cirrus lies on the southern side of the upper level high. Active, high and fast developing convective cloud is present over western Zimbabwe (orange colours) with older decaying convective cells over northern South Africa.
|
19 January 2013 1200 UTC - MSG Airmass RGB Image
|

|
On the airmass RGB the brown colours to the west of the low confirms that drier air is present in the west with moist tropical air over the eastern parts.
|
19 January 2013 1200 UTC - MSG Airmass RGB Image and 300 hPa geopotential heights.
|

|
The WV 6.2 image indicates the high water vapor content of the higher levels of the troposphere over Botswana and Zimbabwe.
The continental tropical low moves from the border of Botswana/Namibia on the 18th to the coast of Mozambique on the 21st of January 2013. The cyclonic curvature is visible in the lower level circulation and the anticyclonic circulation in cold cirrus cloud. Convective development takes place mostly to the east and north of the surface low pressure system.
|
|
Press "Play Button" to see the loop; 18th January 2013 00 UTC Start - 21st January 2013 00 UTC End - MSG IR 10.8 |
Meteorological Physical Background
Introduction
It is only during late summer when the ITCZ moves southwards to the northern extremes of South Africa that tropical easterly lows and continental tropical low pressure systems develop. In this section a brief background about each of these three synoptic scale phenomena is provided. First some general information about southern Africa and the appearance of convective cloud in a low shear environment is discussed.
The physical background of the three synoptic scale phenomena is provided separately.
Southern African location map and topography
|
Map of Africa: © 2006 UNEP/GRID-Arendal
|

|
Southern Africa is characterized by a moderately elevated plateau, for the greater part rising to over 1000 m above sea level and to more than 1500 m over extensive areas. For this reason it is the practice in the forecasting offices in South Africa to convert surface pressure measured at synoptic weather stations to the height of the 850hPa pressure level measured in geopotential meter (gpm). In this conceptual model the surface therefore refers to the 850hPa pressure level.
Convective cloud in low shear environments
Convective cloud which form in low shear environments do not have an anvil and appear circular. In A large wind shear exists and an anvil develops while in B no wind shear exists and the clouds develop without an anvil and can grow vertically to the Tropopause.

|
Compare the severe storm RGB on the 12th of January 2013 (on the left) with the 30th of November 2013 (on the right). In January over southern Botswana in a low shear environment the convective cloud had a circular structure while in November in a high shear environment over Lesotho the anvil is clearly visible. The vertical profile of the winds (in knots) at King Shaka International Airport in KwaZulu-Natal shows the wind shear as well as the relatively strong winds in the mid troposphere on the 30th of November 2013.

|

|
Continental Tropical Lows
From time to time the easterly waves develop into CTL and the Model for the Identification of Tropical Weather Systems (MITS) deals with some of the characteristics of these lows.
Overview
MITS consists of five circulation and thermodynamic criteria. They are
- The low pressure system must stand upright from 850 to 400hPa and should be displaced by a ridge of high pressure at the 200hPa level.
- A core of high average column temperatures should be present in the 500 to 300 hPa layer above or near the surface low pressure system.
- Precipitable water values in the 850 to 300 hPa layer should exceed 20 mm and be in the same geographical position as the 200hPa ridge or high-pressure system and must be accompanied by upper tropospheric wind divergence.
- Average total static energy (TSE) in the 850 to 300 hPa layer should exceed 330 x 103 J*kg-1.
- Upward motion to be present from 700 to 400hPa, the atmosphere should be conditionally unstable up to 400hPa and precipitable water values should also exceed 20 mm

1. Vertical integrity of low and high-pressure systems.
A barotropic atmosphere is one in which the density is a function of pressure alone. This means that isobaric surfaces are also surfaces of constant temperature. If the horizontal gradient vector of the average column temperature is zero then the thermal wind will be zero. The thermal wind is defined as the vertical shear of the geostrophic wind. When the thermal wind is equal to zero the geostrophic wind will not change with height. This also means that in a barotropic atmosphere the horizontal component of the gradient of geopotential remains constant with height. Synoptic scale high- and low-pressure systems will in this ideal situation “stand upright” with height.
Barotrophy provides very strong constraints on the motion in a rotating fluid and is in fact never achieved in the atmosphere. Nevertheless in a tropical atmosphere the circulation will tend towards this ideal situation. The vertical integrity is also detailed up to 400 hPa, of low-pressure systems, associated with the precipitation zone of equatorial wave disturbances in the western Pacific Ocean. MITS was designed to look for a low-pressure system, which stands approximately upright with height from the surface (850hPa) up to the 400hPa level.
In the real tropical atmosphere strong surface and middle tropospheric convergence occurs in association with the "upright" low-pressure system. This convergence in turn results in upward motion and if adequate water vapor is available, convective cloud or so-called "hot towers" will develop. The process by which the hot towers act as energy tubes through which energy from the lower troposphere is transported to the upper troposphere where it is distributed horizontally by the upper air divergence. The condensation releases a large amount of latent heat, which is in turn responsible for above-normal upper tropospheric temperatures. The geopotential thickness of a layer is directly proportional to the average column temperature with the result that an upper tropospheric high-pressure system forms above the surface low. The latent heat release therefore, quickly results in a warm core (high pressure) developing above the lower level low.
This process where the latent heat release causes warm temperatures and a upper tropospheric high is only known as Convective Instability of the Second Kind (CISK). CISK is a cooperative interaction between small-scale cumulus convection and a larger-scale disturbance where:
- The large-scale convergence organizes the cumulus convection
- Condensation heating in the clouds in turn supplies energy to the larger-scale system

2. In Average column temperatures in the 500 to 300hPa layer
As detailed above latent heat release leads to above average column temperatures and an upper tropospheric high above the surface low pressure system. The average column temperatures in the 500 to 300 hPa layer are fundamental for the identification of tropical weather systems. No specific threshold is set for the average 500 to 300 hPa temperatures in a tropical circulation system but the column temperatures should be compared to the surrounding areas in order to identify a warm cored system. It should be remembered that this field alone does not identify a tropical circulation system as an upper tropospheric high pressure system will necessarily be associated with warm temperatures. In addition the absence of a horizontal temperature gradient of the 500 to 300 hPa average column temperatures indicates a barotropic atmosphere. However true barotrophy never occurs in the real atmosphere. A weak upper tropospheric temperature gradient can nevertheless be used to identify a "tropical atmosphere".
3. Moist diverging high in the upper troposphere
A fundamental component in the development of the tropical upper tropospheric high-pressure system is the release of latent heat through condensation of water vapour. Maintenance of an upper tropospheric high therefore requires a high moisture content below the upper high pressure system. Precipitable water is often used to determine atmospheric moisture content.
Precipitable water (W) is the total mass of water contained in a vertical atmospheric column if all the water vapor in the column Values of precipitable water, greater than 20 mm in the same geographical position as the 200hPa high-pressure system indicate a tropical system.
Dines compensation requires that the upper tropospheric high maintain significant horizontal wind divergence a few kilometers below the tropopause i.e. the 200 to 300hpa levels. This divergence removes air horizontally in the upper troposphere. It is because of this wind divergence that the vertical integrity of the tropical system can be maintained. Without the upper tropospheric divergence the system would fill up because of the lower level convergence and latent heat release. This process is known as the Carnot Engine and the following schematic provides an explanation for the process.
| (1) | isothermal inflow of near-surface air (A-B) |

|
| (2) | moist adiabatic ascent in the eye of the Carnot cycle - all convection and outflow just below the tropopause (B-C) | |
| (3) | sinking of cooled air in the environment far from the tropical cyclone center (C-D). To close the system | |
| (4) | the cooled air is assumed to return to the tropical cyclone environment adiabatically (D-A) |
4. Average total static energy (TSE).
In an atmosphere where higher than normal upper tropospheric temperatures occur, as is the case of an air mass with tropical characteristics, the contribution of the enthalpy will increase the TSE values. Higher geopotentials, generally found in the upper troposphere in tropical weather systems will also increase the TSE values. The high moisture content found in the lower troposphere in tropical weather systems increases the TSE values through the latent heat term. In MITS the average TSE is computed for the 850 to 300hPa layer.Experimental results indicated that TSE values greater than 330 x 103 J*kg-1 is indicative of tropical circulation over Southern Africa
5. Deep cumulus convection and vertical motion.
The interior of South Africa is approximately 1 500 m above sea level and this means that the 700hPa level is approximately 1 500 m above the land surface and can still be considered representative of the lower troposphere. The 700hPa level is also close to the summer convective cloud base level. An important function of MITS is to isolate areas where upward motion exists from 700hPa to 400hPa.
The vertical profile of TSE values is used to determine the potential instability of the atmosphere. A potentially unstable atmosphere is required for deep cumulus convection. To determine the level of potential instability (LPI) the following formula is used:
where i varies between 700hPa and 400hPa. For the atmosphere to be considered conditionally unstable up to 400hPa (a requirement of MITS) the LPI must remain positive for i = 700hPa to 400hPa.
Heavy rainfall from continental tropical weather systems is possible when:
- The precipitable water values in the troposphere should exceed 20 kg * m-2.
- Wind divergence must be present in the upper troposphere.
- Average TSE values in the troposphere should exceed 335 * 103 J * kg-1 .
- The atmosphere must also be conditionally unstable up to at least 300hPa.
- Upward motion must exist from 700hPa to 300hPa.
- Maximum upward vertical motion should occur below the 300hPa level.
Easterly lows
The African Easterly Wave, associated with the West African Monsoon has been studied extensively, and much less research results are available for the easterly waves and lows which develop over southern Africa in austral summer. Some notable exceptions are also the waves as inverted V troughs. He identified the following characteristics of these tropical waves.
- They are cool but very humid below 700 hPa
- Above 500 hPa the waves are warm cored
- The high humidity in the lower troposphere originates from the ITCZ
Furthermore, the Angola Low is a semi-permanent feature over southern Africa in summer. He explains that a confluence zone exists east of this low stretching towards the ITCZ. South of this band easterly waves develop.
Characteristics of the African Easterly Wave:
- Wavelength of 2000 to 4000 km
- Period of 3-5 days
- Move westward at speeds of 7-8 m s-1, about 6-7 degrees longitude per day
- Latitudinal extent of 10 to 15 degrees
- Maximum amplitude in the low to mid-troposphere
- Exists apart from the ITCZ, although they may extend into that area
This conceptual model will show that easterly low have similar characteristics over southern Africa with some deviations.
- Over southern Africa the low is strongest at 500 hPa
- Preferred areas of convection is to the east of the low
- The low moves only at about 3 degrees longitude per day
Intertropical Convergence Zone (ITCZ)
The Intertropical convergence zone (ITCZ) is defined as that area near the equator where the northeast and southeast trade winds converge. This area is known as the doldrums as winds can be calm for weeks trapping sail-powered boats.
Overview
The ITCZ is found in the area of low level wind convergence of the southeasterly and northeasterly trade winds close the equator. Over the oceans the large areas of convective cloud indicate the location of the ITCZ. Over Africa the position of the ITCZ ranges from 10-40 E and it extends to around 20° S in late summer (January and February) and the seasonal displacement of the ITCZ is sun-synchronous (Suzuki, 2011). However, one should be cautious to use the position of the ITCZ in short term forecast of precipitation over Africa as strong equatorial heating plays a fundamental role in the development of convection (Vasques, 2009). Nevertheless there is a good associated between the seasonal position of the ITCZ and rainfall. In order for the ITCZ to be maintained enough water vapor is required to sustain deep convection.
The ITCZ has the following characteristics
- It occurs near the equator in areas of near surface wind convergence and may be associated with large convective cloud
- The surface winds are very light
- Abundance of low and mid-level moisture
In January moths the ITCZ extends southward over the continent to about 20 S while in July the ITCZ is located over northern Africa.

|
|
Cross section of the ITCZ in January. Over the ocean the rainbelt is often associated with the position of the ITCZ but over the continent the winds and boundaries are much weaker. Blue arrows indicate relatively cool dry air from the winter hemisphere.
http://www.weatherwise.org/Archives/Back%20Issues/2009/Nov-Dec%202009/full-Intertropical-Converge.html
|

|
The ITCZ is characterized by a zone of deep convection with only shallow convection on either side. The demarcation zone lopes pole-ward with height and all convergence into the ITCZ occurs in the boundary layer in a region of strong cyclonic shear vorticity. In the middle to upper levels northerly winds blow through the (SH) ITCZ.
On a daily basis the ITCZ exhibits an amazing degree of variation. On one day it may be defined by a long east-west zone of deep convection which twenty-four hours later will have broken up into cellular clouds or may have disappeared entirely.
There is cyclonic wind shear across the ITCZ, with westerly winds on the equator side and easterly winds polewards.
Westward propagating waves may be found along the ITCZ. These synoptic and mesoscale systems have their own individual vertical circulations and zones of horizontal convergence and divergence. Consequently there are regions of intense upward motion and of downward motion all along the ITCZ on a planetary scale.
Generally there is tropical maritime air on the equatorward side of the ITCZ, while on the poleward side there is air from the higher latitudes which suffered much subsidence in descending while moving northwards and is thus relatively warm, dry and stable. Hence the air on the equator side is generally cooler. However the temperature differences between the two sides are generally too small to be easily discernible.
The ITCZ is thus usually recognized on synoptic charts through the wind discontinuity and as a trough of low pressure, or on the satellite images in terms of maximum cloudiness.
Clouds form in the moist layer on the equatorward side of the ITCZ. If the moist layer is deep, large cumulus and cumulonimbus formation is possible. Maximum cloudiness is therefore on the equatorward side of the ITCZ at a distance of 200 to 500 km from it.
Key Parameters
All the NWP products provided here were generated by using ERA-Interim reanalysis and these data are available from http://apps.ecmwf.int/datasets/. The parameters used to describe tropical lows are:
-
Equivalent potential temperature (ET)
Equivalent potential temperature is a measure of the moisture content of the surface air as well as the environmental lapse rate. The change of ET with height is sued to determine if the atmosphere is convectively (potentially) unstable. If ET decreases with height the atmopshere is convectively unstable. -
Precipitable water
Precipitable water is often used to determine atmospheric moisture content. Precipitable water (W) is the total mass of water contained in a vertical atmospheric column if all the water vapor in the column were to condense. -
Relative vorticity
Vorticity is a measure of the rotation of a fluid and is said to be the curl the wind velocity field. Relative vorticity in the isobaric coordinate system is the horizontal component of vorticity vector (a scalar). In the Southern Hemisphere low pressure systems have negative vorticity and high pressure systems positive vorticity. The advection of upper tropospheric cyclonic relative vorticity is associated with the development of surface low pressure systems. -
Total static energy (TSE)
An alternative to the equivalent potential temperatures is the total static energy (TSE) (also referred to as moist static energy). TSE is defined as the total energy in an atmospheric parcel of air, neglecting the small amount of kinetic energy. TSE is computed by:
TSE=CpT+gz+Lq
where CP is the specific heat of dry air, z is the geopotential height in meter (gpm), L the latent heat of condensation and q the water vapour mixing ratio. The first term on the right-hand side of the equation represents the enthalpy, the second term the geopotential and the third term the latent energy.
The vertical profile of TSE can also be used to investigate the potential instability of the atmosphere. In this image TSE values decrease to the mid troposphere.
A typical vertical profile of total static energy associated with deep convection. The dashed line is the upward projection of the surface energy value.
-
Wind divergence
Horizontal wind convergence describes the inflow of air while divergence describes the outflow of air. Negative values are convergence and positive values divergence -
Wind shear
Magnitude of the vector difference between the components of the wind at two pressure levels
Continental Tropical Lows
The Model for the Identification of Tropical Weather Systems (MITS) was developed with two aims in mind. First a set of criteria is proposed to identify the tropical character of the CTL and 15 January 2013 1200 UTC MSG IR 11-13 Image secondly a list of atmospheric variables are suggested which aids in the identification of heavy rainfall areas associated with these CTL. Several very heavy rainfall events over southern Africa has been associated with CTL. Some examples of these flood events are: the Free State floods in 1988, the floods over the north-eastern interior of South Africa in Mozambique in 2000 and the heavy rainfall in the Kruger National Park in January 2013.
This conceptual model deals with Continental Tropical Lows (CTL) which occur from late December to early March over the southern sub-continent of Africa. These lows are very slow moving and can exist for up to a week and may cause very heavy rainfall.
MITS consists of the 5 criteria listed below and these will be illustrated by using ERA data and by investigating a weather event which occurred from 17-22 January 2013 over southern Africa.
Criteria of MITS
- The low pressure system must stand upright from 850 to 400hPa and should be displaced by a ridge of high pressure at the 200hPa level.
- A core of high average column temperatures should be present in the 500 to 300 hPa layer above or near the surface low pressure system.
- Precipitable water values in the 850 to 300 hPa layer should exceed 20 mm and be in the same geographical position as the 200hPa ridge or high-pressure system and must be accompanied by upper tropospheric wind divergence.
- Average total static energy (TSE) in the 850 to 300 hPa layer should exceed 330 x 103 J * kg-1.
- Upward motion to be present from 700 to 400hPa, the atmosphere should be conditionally unstable up to 400hPa and precipitable water values should also exceed 20 mm.
1. Vertical integrity of low and high pressure systems
On the 19th of January 2013 the low pressure was standing upright from 850-400 hPa and above that a strong high pressure system was located. On the IR 10.8 image the cyclonic circulation into the low situated over Botswana is clearly visible but also the anticyclonic curvature of the cirrus stretching out into the Indian Ocean.
|
The 850 (shaded), 700 (dotted) and 500 (solid) hPa geopotential heights on the 19th of January 2013. The low over Botswana is clearly visible at all levels
|
19 January 2013 1200 UTC - MSG IR 10.8 Image and 700 hPa winds (in knots)
|

|
|
The 200 hPa high pressure systems is located in the same position as the low at lower levels over Botswana. Mid-level cloud (magenta shades) is visible over southeastern South Africa with a band of cirrus above that stretching into the Indian Ocean. This cirrus lies on the southern side of the upper level high. Active and high and fast developing convective cloud is present over western Zimbabwe (orange colours) with older decaying convective cells over northern South Africa.
|
The 400 (contour) and 200 (shaded) hPa geopotential heights on the 19th of January 2013. The low is visible as a trough at 400 hPa with a 200 hPa high above that.
|
19 January 2013 1200 UTC - MSG Day Microphysics RGB Image and 300 hPa winds (in knots)
|

|
|
This figure indicates that very little directional wind shear exists in and near the low and therefore the thermal wind will be close to zero indicating the barotropic nature of this low. To further illustrate this the 850-300 hPa wind shear was less than 5 knots over central Botswana. Note the large wind shear values in the band of cirrus stretching out over the Indian Ocean.
|
Longitudinal vertical cross section (15 °E to 35 °E) of relative vorticity (values multiplied by 105) at 21 °S and winds (in knots). The green shades are anticyclonic vorticity and the yellow shades cyclonic vorticity. The tropical low standing upright with height is clearly visible at 25 °E.
|
The 850-300 hPa wind shear (m/s) on the 19th of January 2013. The wind shear values was less than 5 m/s over central Botswana.
|

|

|
2. Average column temperatures in the 500 to 300 hPa layer
Due to the large amounts of latent heat release in the tropical low a warm core of temperatures exists in the 500-300 hPa layer above the surface low.
|
The average 500-300 hPa temperature field (shaded) shows a warm core in the same position of the 850 hPa low
|

|
Temperatures at 500 hPa was as warm as -2 C in the center of the low with weak temperature gradients over most of Botswana. To the west and southwest of the tropical low temperatures decrease rapidly and temperature gradients increase indicating a change in the properties of the airmass. On the Airmass RGB the brown colors to the west of the low confirms that drier air is present in the west with moist tropical air over the eastern parts.
|
The 500 hPa temperatures (contours) and the magnitude of the temperature gradient (shaded) * 105 K/m
|
19 January 2013 1200 UTC - MSG Airmass RGB Imag
|

|
|
3. Moist diverging high in the upper troposphere
Values of precipitable water, greater than 20 mm in the same geographical position as the 200hPa high-pressure system helps to indicate a tropical system in MITS. The WV 6.2 image indicates the high water vapor content of the higher levels of the Tropopause over Botswana and Zimbabwe.
|
The precipitable water (850-300hPa) shaded, 300 hPa wind divergence (dotted) and 200 hPa geopotential heights on the 19th of January 2013. A moist divergent high was present over Botswana.
|
19 January 2013 1200 UTC - MSG Airmass RGB Image and 300 hPa Geopotential heights. The upper level high over Botswana has high levels of humidity.
|

|
|
The Carnot engine is not quite visible in this vertical cross section of vertical velocity. What is evident however, is the upward motion through the entire troposphere in and east of the low and subsidence flanking the strong upward motion. In the vicinity of the low wind convergence is present from the surface to 300 hPa but this is replaced by strong divergence close to 200 hPa.
|
Longitudinal vertical cross section (15° E to 35° E) of vertical velocity at 21° S and winds (in knots). The blue shades are upward motion and the red shades downward motion.
|
Longitudinal vertical cross section (10° E to 40° E) of divergence (brown shades are divergence and magenta shades convergence) and vertical velocity (contours) at 14° S on 8 January 2013 at 0000 Z.
|

|

|
4. Average total static energy (TSE)
Values of precipitable water,In MITS the average TSE is computed for the 850 to 300hPa layer.Experimental results indicated that TSE values greater than 330 x 103 J*kg-1 is indicative of tropical circulation over Southern Africa.In this example the TSE values over Botswana is higher than 444 J/kg. The vertical profile of TSE indicates the convective instability of the atmosphere over the continent and close to the center of the low. Also note the influence of the colder drier mid-level air over Namibia causing the TSE values to decrease significantly.
|
The average column TSE values (divided by 1000) on the 19th of January 2013. Values over Botswana are higher than 440 J/kg
|
Longitudal vertical cross section (15° E to 35° E) of TSE at 21° S. The lower values in the mid troposphere is indicative of a potentially unstable atmosphere.
|

|

|
5. Deep cumulus convection and vertical motion
In an attempt to predict areas where heavy rainfall is likely from continental tropical weather systems some of the critical values of the parameters associated with MITS are isolated. MITS identifies heavy rainfall areas where the following criteria co-exist
- Precipitable water values > 20 mm
- Average TSE values > 335*103 J/kg
- Level of potential instability up to 400 hPa
- Upward motion should exist from 700-400 hPa
|
The precipitable water (850-300hPa) larger than 20 mm (shaded) and 300 hPa wind divergence on the 19th of January 2013.
|
Average column TSE values (divided by 1000) larger than 335 J/kg (shaded) and LPI up to at least 400 hPa on the 19th of Janu
|
|
|

|
|
Upward motion present in the 850-400 hPa column.
|
The shaded grids shows where heavy rainfall is predicted.
|

|

|
MITS was capable of identifying the heavy rainfall over southeastern Botswana but failed to identify the very heavy rainfall over northern South Africa. The rainfall in these areas were most likely enhanced by the topography of the area.
|
Daily TRMM rainfall for 19 January 2013. For more information on TRMM data see: Acker and Leptoukh (2007).
|

|
Typical Appearance In Vertical Cross Sections
NWP parameters that describe the vertical structure of the Conceptual Model
- ITCZ Cross Section
- ITCZ Ocean Cross Section
- Easterly Lows Cross Section
- Continental Tropical Lows Cross Section
ITCZ over the ocean
Wind divergence and vertical motion
|
Longitudinal vertical cross section of wind divergence (*105) and omega (negative values upward motion) at 3° N at 1200Z on 15 January 2013.
|
Longitudinal vertical cross section of wind divergence (*105) and omega (negative values upward motion) at 5° S at 1200Z on 15 January 2013.
|

|

|
At 3° north and west of Greenwich, lower level convergence is displaced by mid level divergence resulting in upward motion in the same area as the convective cloud. There is also large values of upward motion at around 10° E over the continent.
At 5° degrees south of the equator the upward motion is restricted to east of 10° E over the continent of Africa.
|
Latitudinal vertical cross section of wind divergence (*105) and omega (negative values upward motion) at Greenwich at 1200Z on 15 January 2013.
|
Latitudinal vertical cross section of relative vorticity (*10^5) and winds (in knots) at Greenwich at 1200Z on 15 January 2013.
|

|

|
Strong uplift exist near the equator with general upward motion present in the area north of the equator and subsidence towards the south in the vicinity of the extra-tropical high.
The lower level northeasterly winds north of the equator and southeasterly winds south of the equator results in in wind convergence at around 5° N. On the equator there is little directional wind shear but large directional shear away from the equator. The North African Jet Stream is visible in the 300-200 hPa layer.
Total Static Energy
|
Longitudinal vertical cross section of TSE at 3° N at 1200Z on 15 January 2013.
|
Longitudinal vertical cross section of TSE at 5° S at 1200Z on 15 January 2013.
|

|

|
In the vicinity of the ITCZ the TSE values at the surface approaches 350 J/kg. The atmosphere is convectively unstable west of Greenwich with minimum TSE values at around 800 hPa. Over the continent of Africa at 15 E, the surface values of TSE are lower and the atmosphere remains convectively unstable but minimum values now occur at 600 hPa.
Away from the equator at 5° S surface values of TSE remain high but the atmosphere is not as convectively unstable as further north close to the African continent. West of Greenwich over the Atlantic Ocean the atmosphere remains convectively unstable.
ITCZ over the continent
Total Static Energy
|
Longitudinal vertical cross section of TSE at 15° S at 1200Z on 15 January 2013.
|

|
High values of TSE is present over the continent and although the atmosphere is convectively unstable the minimum values in the mid-troposphere are much higher than the example over the ocean.
Easterly Lows
|
Longitudinal vertical cross section (10° E to 40° E) of vertical velocity at 20° S and winds (in knots). The blue shades are upward motion and the red shades downward motion.
|
Longitudinal vertical cross section (10° E to 40° E) of divergence (brown shades are divergence and magenta shades convergence) and vertical velocity (contours) at 14° S on 8 January 2013 at 0000 Z.
|

|
|
The largest values of omega occurred in the mid and upper troposphere in the vicinity of the convective development.
Continental Tropical Lows
|
Longitudinal vertical cross section (15° E to 35° E) of relative vorticity (values multiplied by 105) at 21° S and winds (in knots). The green shades are anticyclonic vorticity and the yellow shades cyclonic vorticity.
|
Longitudinal vertical cross section (15° E to 35° E) of vertical velocity at 21° S and winds (in knots). The blue shades are upward motion and the red shades downward motion.
|
|
|
|
The tropical low standing upright with height is clearly visible at 25° E.
|
Longitudinal vertical cross section (15° E to 35° E) of divergence (brown shades are divergence and magenta shades convergence) and vertical velocity (contours) at 21° S.
|
Longitudinal vertical cross section (15° E to 35° E) of TSE at 21° S.
|

|
|
Weather Events
Significant weather events associated with tropical weather systems over the continent of Africa is predominantly heavy rainfall.
ITCZ over the ocean
| Parameter | Description |
|---|---|
| Precipitation |
|
| Wind (incl. gusts) |
|
| Lightning |
|
ITCZ over the Continent
| Parameter | Description |
|---|---|
| Precipitation |
|
| Wind (incl. gusts) |
|
| Lightning |
|
Easterly lows
| Parameter | Description |
|---|---|
| Precipitation |
|
| Lightning |
|
| Other relevant information |
|
Continental tropical lows
| Parameter | Description |
|---|---|
| Precipitation |
|
References
- J. G. Acker and G. Leptoukh, "Online Analysis Enhances Use of NASA Earth Science Data", Eos, Trans. AGU, Vol. 88, No. 2 (9 January 2007), pages 14 and 17.
- Collier AB and Hughes ARW (2011). Lightning and the African ITCZ. Journal of Atmospheric and Solar-Terrestrial Physics, Volume 73, p. 2392-2398.
- DYSON LL and VAN HEERDEN J (2001). The heavy rainfall and floods over the northeastern interior of South Africa during February 2000. South African Journal of Science, 97, 80-86p.
- Emanuel, K. A., 1986: An air-sea interaction theory for tropical cyclones. Part I: Steady-state maintenance. J. Atmos. Sci., 43, 585-605.
- HOLTON JR (1992) An Introduction to Dynamic Meteorology. Academic Press. San Diago. 511 pp.
- HUSCHKE RE (1959) Glossary of Meteorology. Am. Meteorol. Soc. Boston. 638 pp.
- Jackson, Brian, Sharon E. Nicholson, Douglas Klotter, 2009: Mesoscale Convective Systems over Western Equatorial Africa and Their Relationship to Large-Scale Circulation. Mon. Wea. Rev., 137, 1272-1294.
- KAROLY DJ and VINCENT DG (1998) Meteorology of the Southern Hemisphere. 27 (49). Am. Met. Soc. Boston. 410 pp
- Reason, C. J. C., W. Landman, W. Tennant, 2006: Seasonal to Decadal Prediction of Southern African Climate and Its Links with Variability of the Atlantic Ocean. Bull. Amer. Meteor. Soc., 87, 941-955.doi: http://dx.doi.org/10.1175/BAMS-87-7-941
- RIEHL H (1979) Climate and Weather in the Tropics. Academic Press. 611 pp.
- TALJAARD JJ (1985) Cut-off lows in the South African region. S. Afr. Wea. Serv. Tech. Pap. 14, 153 pp. S. Afr. Weath. Serv., Private Bag X097, Pretoria, 0001
- TALJAARD JJ (1994) Atmospheric Circulation Systems, Synoptic Climatology and Weather Phenomena of South Africa. Part 1: Controls of the weather and climate of South Africa. S. Afr. Weath. Serv. Tech. Pap. 27, 45pp. S. Afr. Weath. Serv., Private Bag X097, Pretoria, 0001
- TRIEGAARDT DO, VAN HEERDEN J and STEYN PCL (1991) Anomalous precipitation and floods during February 1988. S. Afr.Weath. Serv. Tech. Paper 23, 25 pp. S. Afr. Weath. Serv., Private Bag X097, Pretoria 0001.