Key Parameters
The key NWP parameters for this Conceptual Model were determined from commonly used parameters in the forecasting environment. Previous studies dating back to the 1980's only made use of parameters such as pressure fields and thicknesses. These fields were never combined into a "typical overview" and were only used in isolated case studies. For this reason, the NWP key parameters that follow, are more modern fields that can be used to determine the position, intensity and movement of the COL systems. A future project would be to create a more statistically viable overview of the NWP parameters listed below, over a 20-30 year period.
The key NWP parameters that are considered with COL pressure systems are:
-
Vertical Velocity
Vertical uplift is very important when locating areas where the COL is intensifying, particularly when it coincides with areas of negative potential vorticity in the upper levels. -
Divergence
Areas of convergence (Negative divergence). in the lower and mid levels of the atmosphere will promote uplift in the lower and mid atmosphere as well, which will enhance the negative potential voticity in the upper atmosphere. -
Potential vorticity
Negative potential vorticity in the upper air is an indicator of the development and possible intensification of a low pressure system. -
Geopotential heights
The geopential heights at various levels depict the synoptic flow -
Wind fields
Wind fields at corresponding geopotential heights are very helpful in identifying when a COL begins to tear off from the main westerly flow.
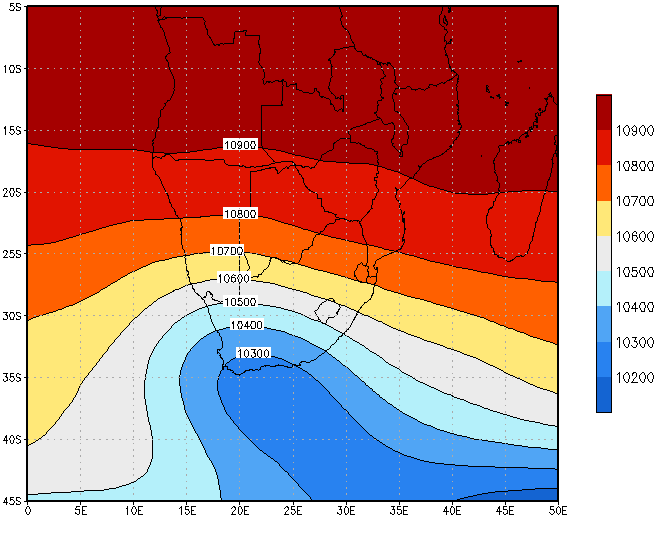
Surface (MSLP) and 500hPa synoptic scale flow
The imagery below gives insight to the NWP parameters measured on the 13th of July 2012. The MSLP and 500hPa height overlays are an introduction to the large scale synoptic flow patterns dominating at this time.
|
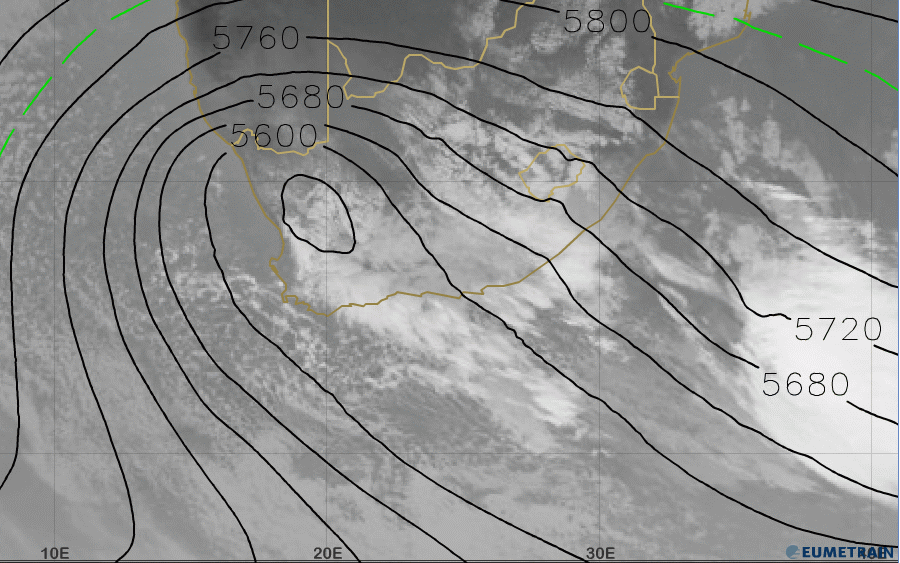
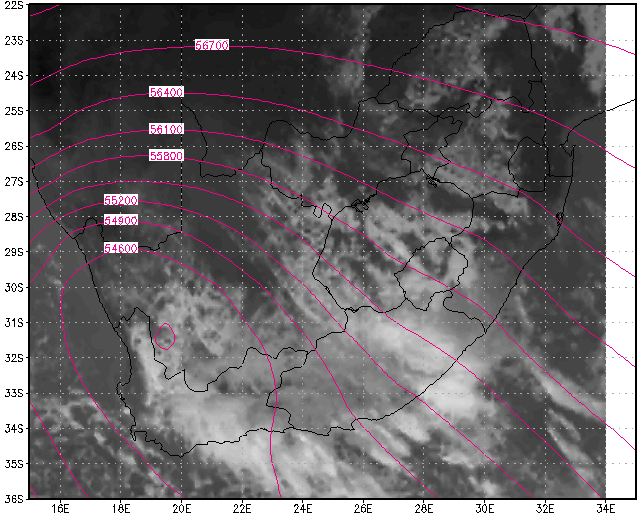
IR10.8 Satellite image overlaid with 500hPa Geopotential heights (gpm) valid for 13 July 2012 at 1200UTC
|
|
|
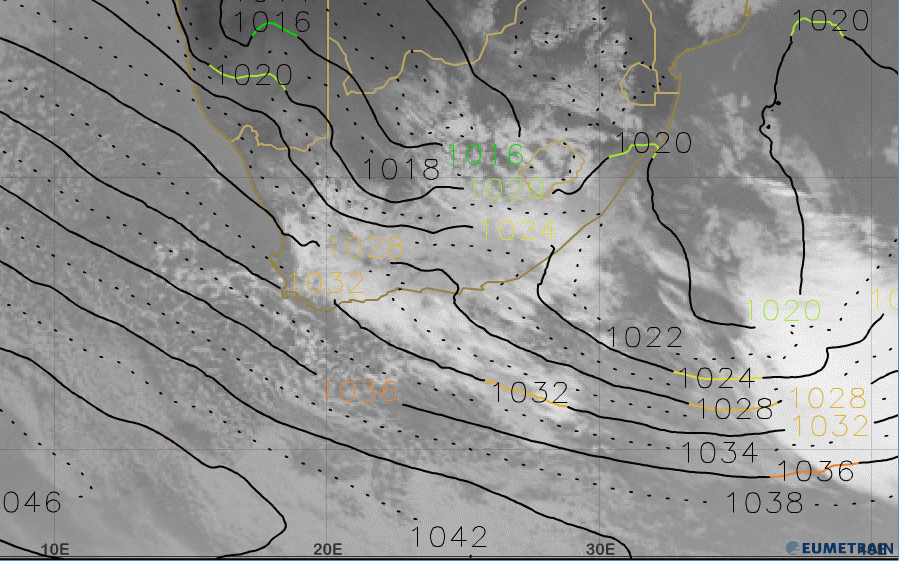
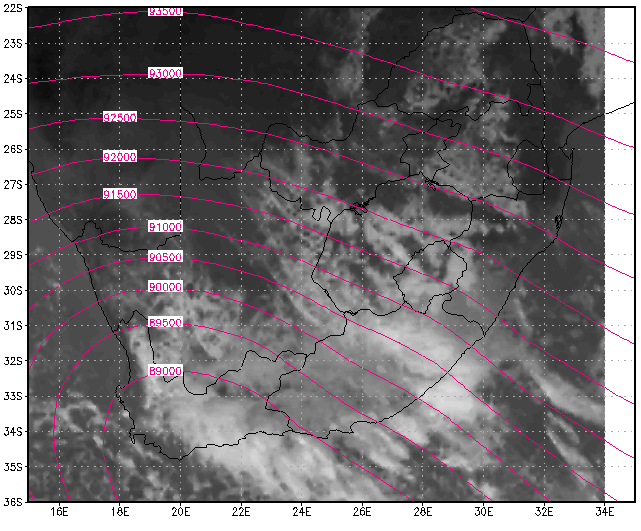
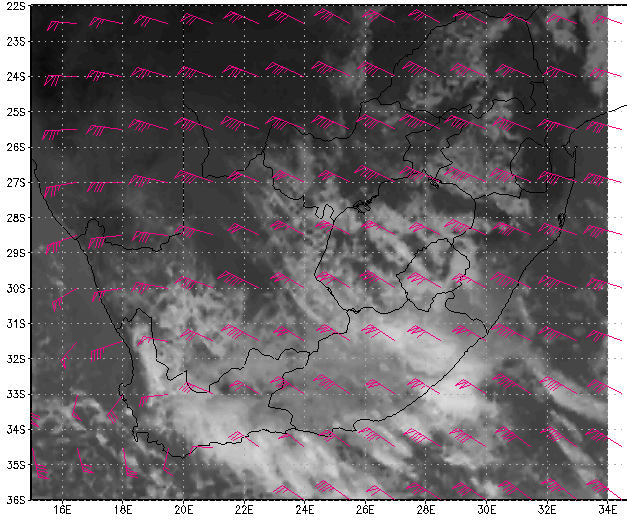
Looking at he MSLP on the 13th July 2012 at 1200UTC, there was a trough system dominating over the central parts of South Africa, extending to a cold front east of the country. the Atlantic high pressure system was ridging along the southern coastal belt, resulting in an onshore flow along the coastline behind the cold front. the central pressure of the High is in the region of 1046hPa, which is extremely intense. |
|
IR10.8 Satellite image overlaid with Mean Sea Level Pressure (MSLP) valid for 13 July 2012 at 1200UTC
|
|
|
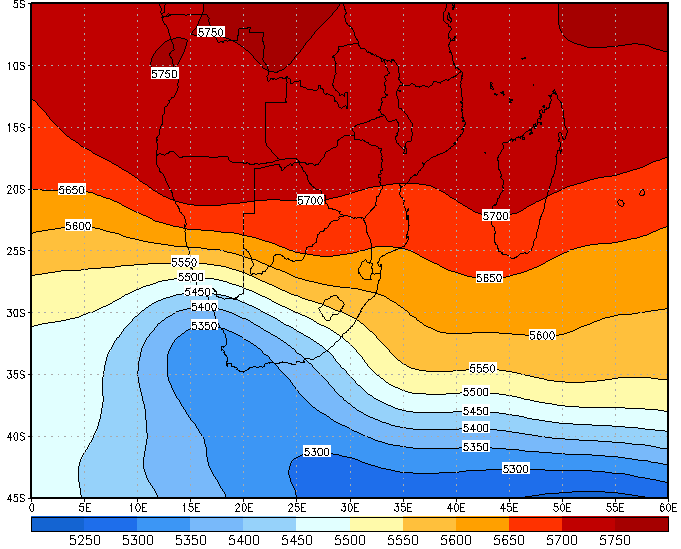
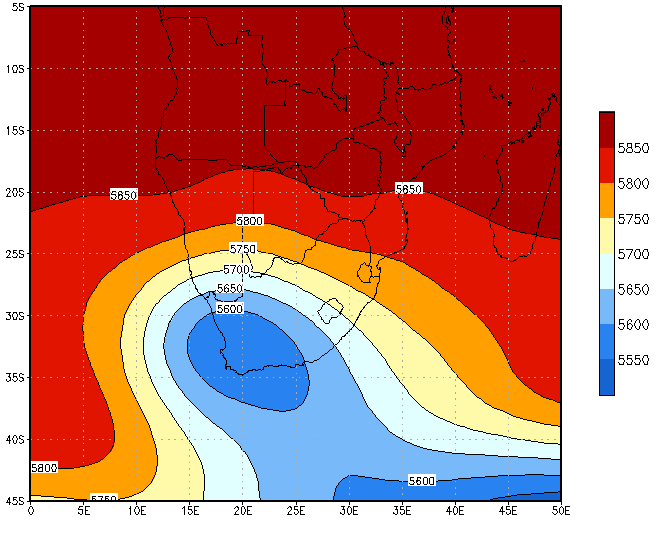
At 500hPa, the COL is situated over the western interior of South Africa, with the 500hPa trough extending over most of the central and eastern parts of the country. This upper trough extends south and south-east of South Africa as well. |
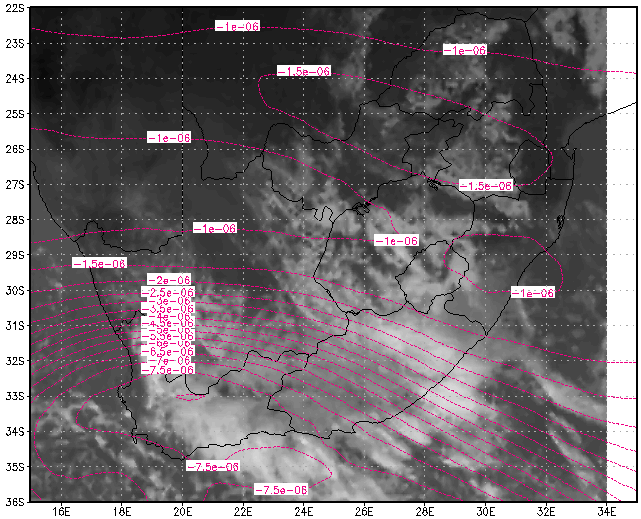
Vertical Velocity (omega)
|
NCEP reanalysis data: Vertical velocity (omega) [Pa/s] at 500hPa, valid for 13 July 2012 at 12Z
|
IR10.8 Satellite image overlaid with Vertical velocity (omega) at 500hPa valid for 13 July 2012
|
|
|
1000 - 500 hPa Thickness
|
NCEP reanalysis data: 1000 - 500hPa thickness (gpm), valid for 13 July 2012 at 12Z
|
Airmass RGB valid for 13July 2012 at 1200UTC
|
|
.gif)
|
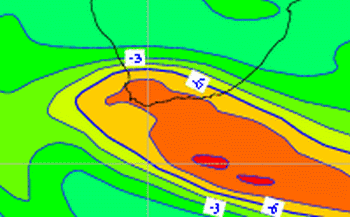
Potential vorticity
|
ECMWF reanalysis data: Potential vorticity at 200 hPa , valid for 13 July 2012 at 12Z
|
IR10.8 Satellite image overlaid with Potential vorticity at 200hPa valid for 13 July 2012
|
|
|
Geopotential Heights
|
NCEP reanalysis data: 300 hPa geopotential Height (gpm), valid for 13 July 2012 at 1200UTC
|
IR10.8 Satellite image overlaid with 300hPa geopotential Heights (gpm) valid for 13 July 2012 at 1200UTC
|
|
|
|
NCEP reanalysis data: 500 hPa Geopotential height (gpm), valid for 13 July 2012 at 12Z
|
IR10.8 Satellite image overlaid with 300hPa geopotential Heights (gpm) valid for 13 July 2012 at 1200UTC
|
|
|
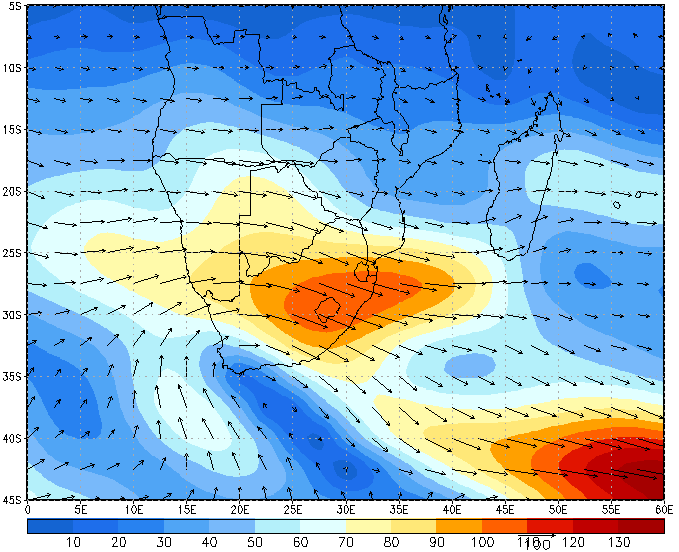
Wind fields
|
NCEP reanalysis data: 300 hPA winds (kt), valid for 13 July 2012 at 12Z
|
IR10.8 Satellite image overlaid with 300hPa winds (kt) valid for 13 July 2012 at 1200UTC
|
|
|