Cloud Structure In Satellite Images
The typical cloud patterns associated with COL system can be investigated by using the following single channels and RGB's either by themselves or in combination with each other:
- Water Vapour Imagery (WV)
- Airmass RGB
- Infra Red (IR) 10.8 with a colour enhanced palette to view Cloud Top Temperatures (CTT).
Of course, any of the visible (VIS) or IR channels can be used to view the structure, movement and position of the COL. Depending on time of day and the cloud type you are trying to identify, use the most appropriate channels and channel combinations to visualize the situation.
Looking at the Satellite imagery
Airmass RGB
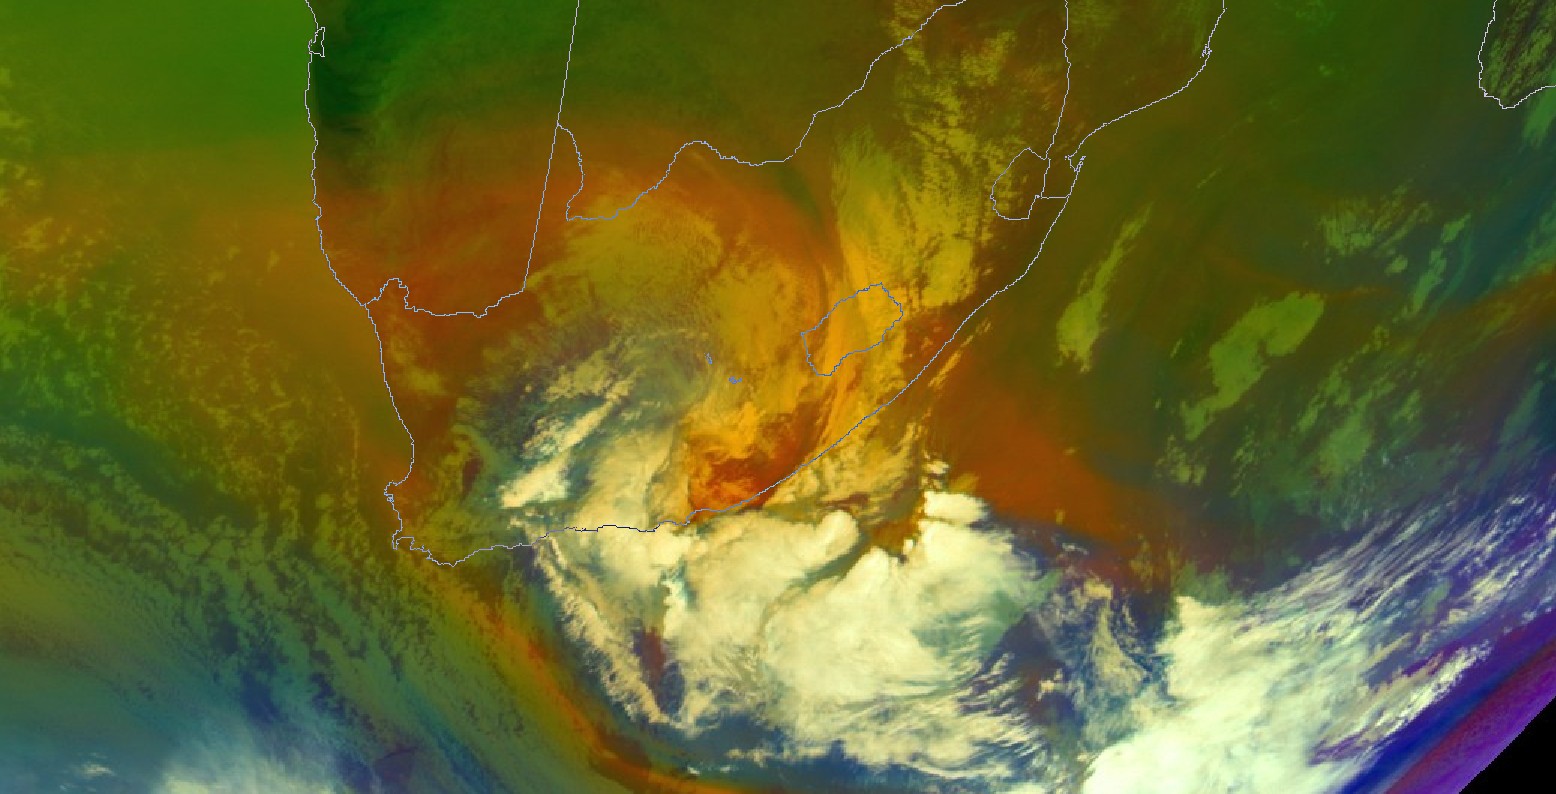
Considering that COL's are mid-latitude systems, where one is dealing with warm, cold, dry and moist airmasses, the Airmass RGB is a perfect channel combination to use when investigating such a system, whether in real time or as part of a case study. One the most important aspects of using satellite imagery in COL cases, is to identify the areas of convection, the areas of cold air at the surface, as well as the area of negative potential vorticity. Convective clouds are the "clumpy", bright white cloud formations seen over the southern parts of South Africa, as well as over the ocean south of the country. The areas where the deep convection is seen, is where the heaviest rainfall can be expected. By looping such an image, one would get a good impression as to how fast the COL is moving and in which direction it is moving. The Airmass RGB is also extremely helpful with locating the areas where dry stratospheric air had descended from the upper troposphere, into the lower levels, identified by dark red/brown colours. This is important when looking for the exact position of the COL and associated surface low.
IR 10.8 with colour enhancement
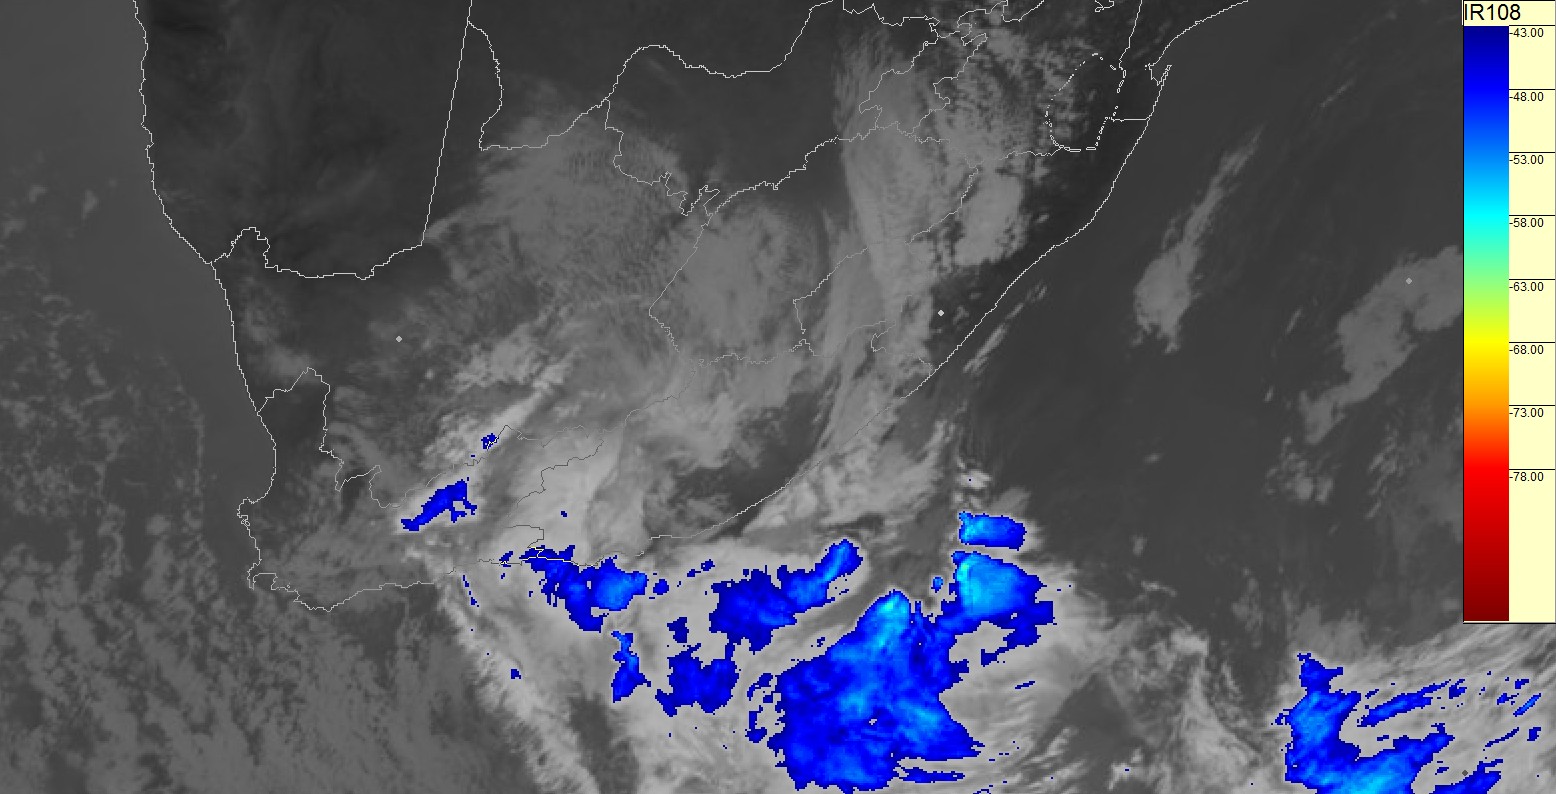
The IR 10.8 imagery is used to find cold cloud top temperatures, which might be indicative of convection and therefore precipitation. The IR imagery can be viewed day and night and is very useful in tracking the movement and development of the COL system. By overlaying a colour enhancement palette for CTT's, the coldest clouds are immediately accentuated and their intensity can be visibly evaluated. the cloud free area over the south-eastern part of South Africa cooincides well with the area of dry air and negative potential vorticity seen on the Airmass RGB.
|
14 July 2012 12UTC MSG Airmass RGB
|
14 July 2012 12UTC MSG IR10.8i with colour enhancement
|
|
|
WV 6.2 Imagery
The WV 6.2 image was used to evaluate the upper atmospheric horizontal moisture/humidity profile. dark areas represent a dry upper atmosphere, while white or grey areas represent a more moist upper atmosphere. Maximum moisture can be seen in the areas depicted as brightest white, found over the southern parts of South Africa, and to the south-east of the country. With the exception of a band of dry air intruding from southern Botswana, through the central parts of South Africa and curving in to the area of negative potential vorticity identified on the Airmass RGB, the upper atmosphere over South Africa is fairly moist. the availability of upper air moisture in such a wide band is a typical pattern associated with COL weather systems over South Africa, where mid level and upper level cloud accompany the system to the east and west.
VIS 0.6 Imagery
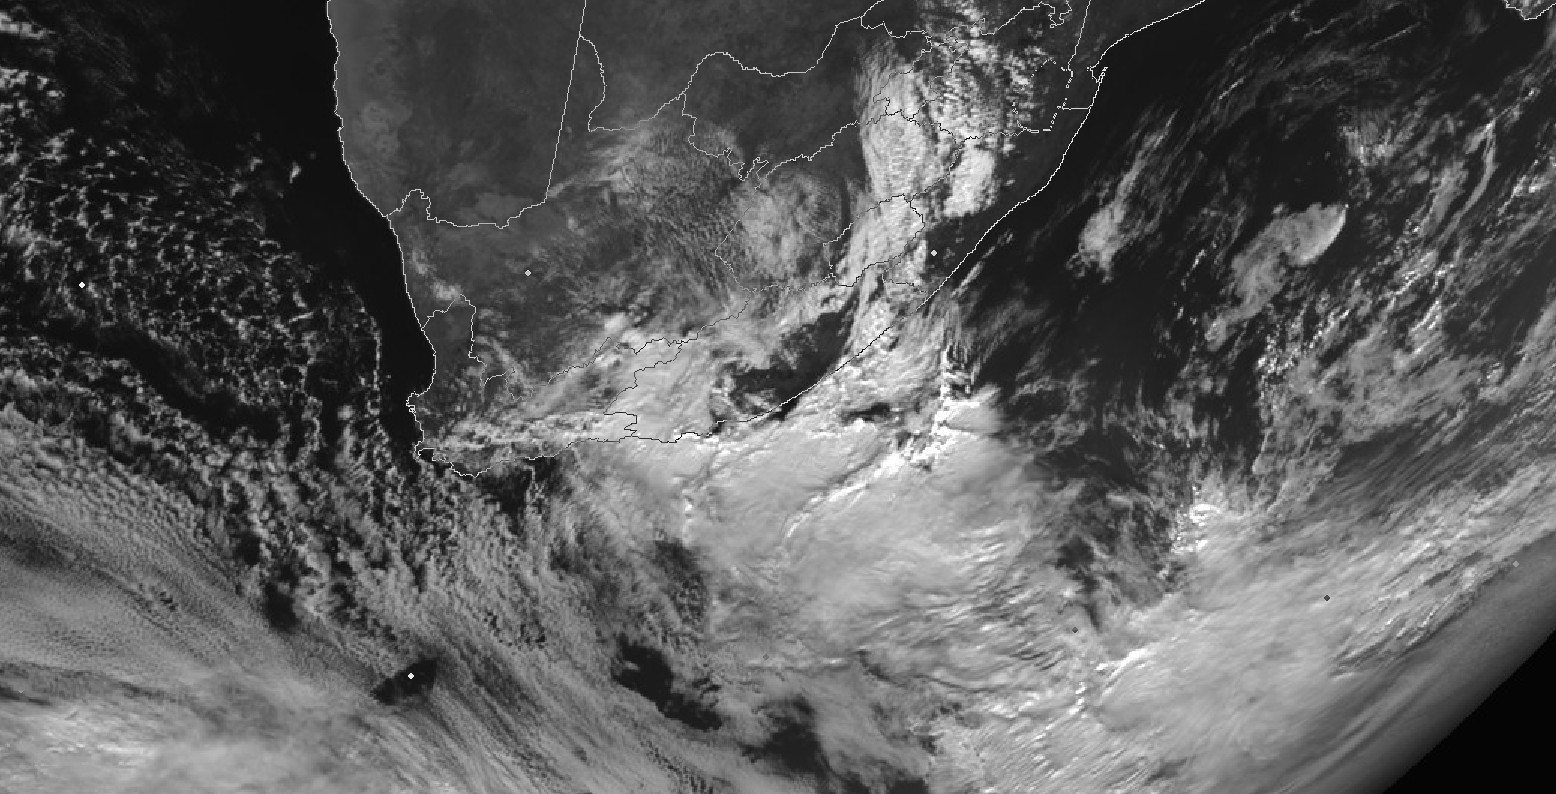
The VI S0.6 channel was used to identify where the thickest clouds were found, as can be seen by the brightest white color on the image. Thick clouds with a clumpy/irregular shape are generally convective clouds, which in COL cases, can result in persistent and possibly heavy precipitation. Snowfall on the higher mountain peaks can also result from thick cloud associated with the COL. on the VIS 0.6 image, there are not many clouds which are depicted as bight white, although the brightest/thickest clouds are evident over the southern and south-eastern parts of South Africa, which coincides with the areas of coldest CTT and highest humidity values seen on the WV6.2 and IR10.8 images.
|
14 July 2012 12UTC MSG WV6.2
|
14 July 2012 12UTC MSG VIS0.6
|

|
|
The video loop below is valid from the 13th July 2012 at 12UTC until the 14th July at 12UTC, in 3 hourly time steps. this video shows the clear rotation of the COL as it progresses from west to east, over the southern parts of South Africa. The deep convective clouds can be seen on the south-eastern, southern and south-western parts of the COL, and this is where the heaviest precipitation would be expected. On the Airmass RGB, the red colour indicates the intrusion of dry stratospheric air and (negative) potential vorticity. this coincides with where the rotation can be seen in the video. The dry air is being drawn cyclonically into the center of the COL and results in a cloud-free area.

|
Press "Play Button" for MSG Airmass RGB 13 July 2012 12UTC - 14 July 2012 12UTC. |
Typical synoptic pattern and cloud features
The four images below are depicting the 500Hpa geopotential (gpm) heights and typical cloud features as observed on satellite imagery during the 4 stages of development of a typical COL pressure system. These four images were derived from looking at 4 separate COL case studies over South Africa, and combining these features into a conceptual model.
In the first stage, it is clear that the bands of cirrus and cumulonimbus (CB) clouds have formed east of the upper trough, while the low level cold air cumulus clouds are found below the center and to the west of the upper trough. In the second, tear-off stage, the CB and thin cirrus cloud to the east of the upper trough have started to form an inverted comma shape, following the cyclonic circulation pattern around the eastern and southern part of the upper low which has begun to tear away from the main westerly flow.
By the time a COL has formed, stage 3, there are low level stratiform clouds found to the south and west of the upper trough and also beneath the band of cirrus and CB clouds in the east. The inverted comma shape cloud start developing during the tear-off stage becomes more clear and distinct in the cut-off stage of the system.
During the final stage of the system, the upper air flow is no longer showing a closed circulation and a more zonal flow returns. The low level col air cumulus cloud can still be seen below the position of the upper trough, while the CB cloud and low level stratiform cloud no long form and inverted comma shape, and begin to thin out and dissipate.
|
Stage 1
|
Stage 2
|
|
|
|
Stage 3
|
Stage 4
|
|
|