Table of Contents
Cloud Structure In Satellite Images
The typical cloud patterns associated with COL system can be investigated by using the following single channels and RGB's either by themselves or in combination with each other:
- Water Vapour Imagery (WV)
- Airmass RGB
- Infra Red (IR) 10.8 with a colour enhanced palette to view Cloud Top Temperatures (CTT).
Of course, any of the visible (VIS) or IR channels can be used to view the structure, movement and position of the COL. Depending on time of day and the cloud type you are trying to identify, use the most appropriate channels and channel combinations to visualize the situation.
Looking at the Satellite imagery
Airmass RGB
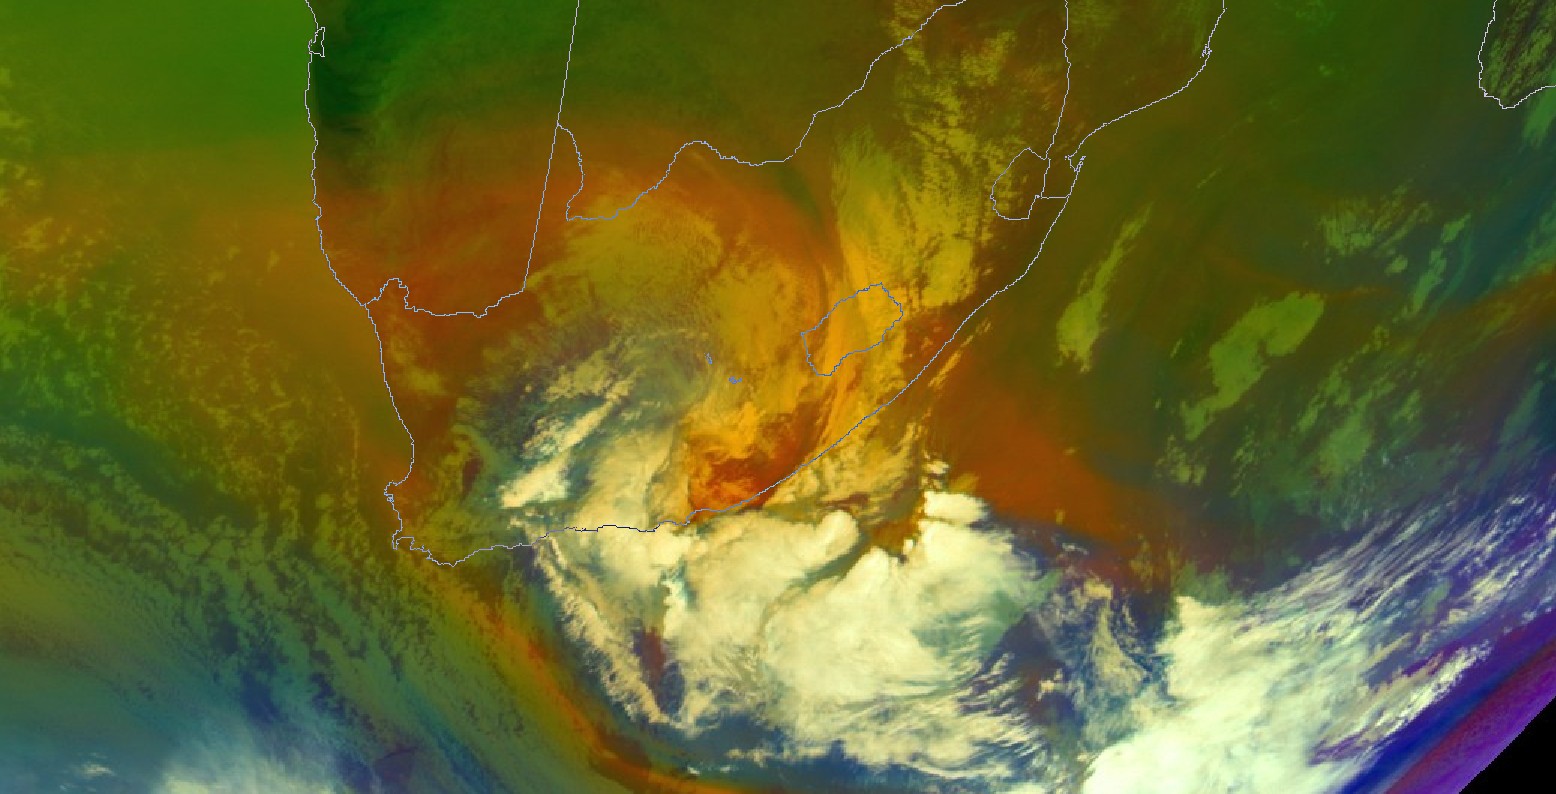
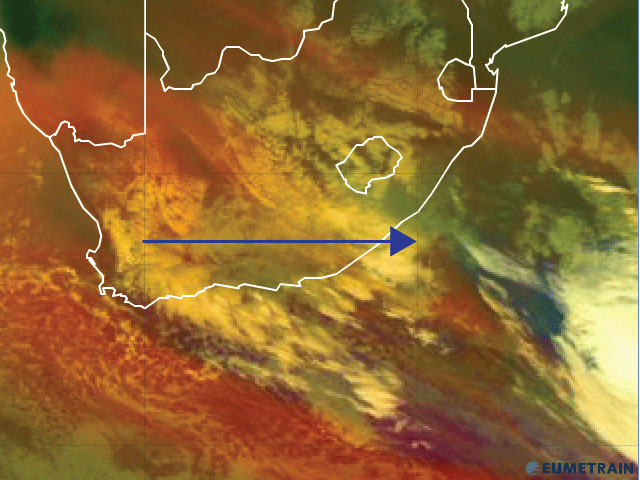
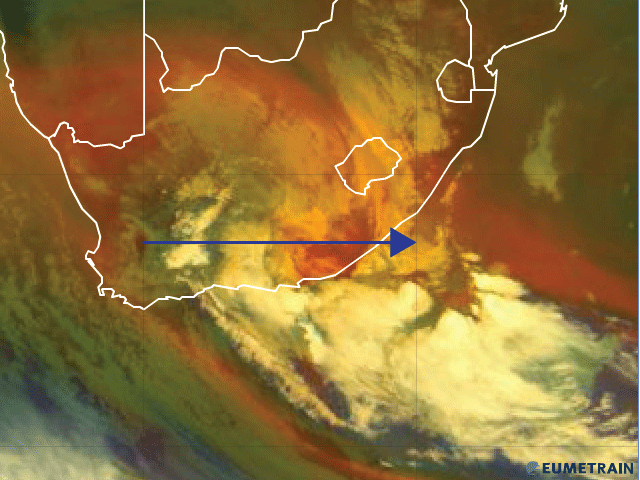
Considering that COL's are mid-latitude systems, where one is dealing with warm, cold, dry and moist airmasses, the Airmass RGB is a perfect channel combination to use when investigating such a system, whether in real time or as part of a case study. One the most important aspects of using satellite imagery in COL cases, is to identify the areas of convection, the areas of cold air at the surface, as well as the area of negative potential vorticity. Convective clouds are the "clumpy", bright white cloud formations seen over the southern parts of South Africa, as well as over the ocean south of the country. The areas where the deep convection is seen, is where the heaviest rainfall can be expected. By looping such an image, one would get a good impression as to how fast the COL is moving and in which direction it is moving. The Airmass RGB is also extremely helpful with locating the areas where dry stratospheric air had descended from the upper troposphere, into the lower levels, identified by dark red/brown colours. This is important when looking for the exact position of the COL and associated surface low.
IR 10.8 with colour enhancement
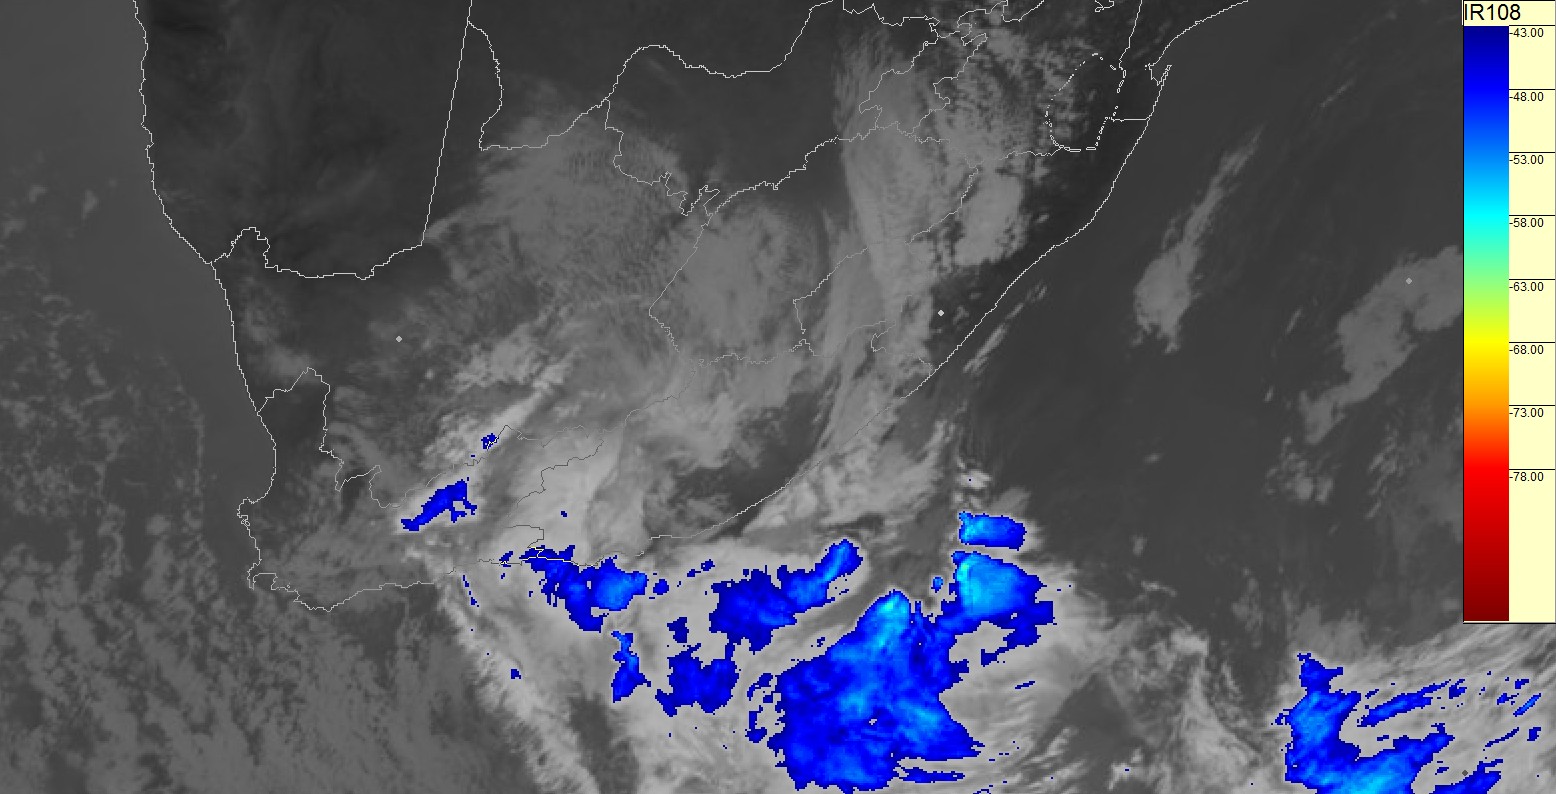
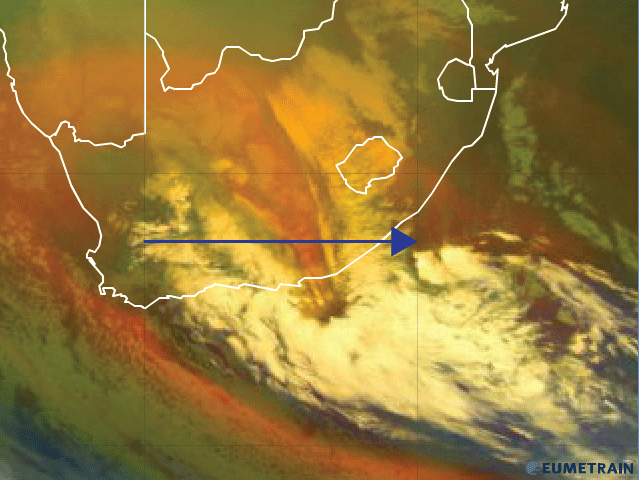
The IR 10.8 imagery is used to find cold cloud top temperatures, which might be indicative of convection and therefore precipitation. The IR imagery can be viewed day and night and is very useful in tracking the movement and development of the COL system. By overlaying a colour enhancement palette for CTT's, the coldest clouds are immediately accentuated and their intensity can be visibly evaluated. the cloud free area over the south-eastern part of South Africa cooincides well with the area of dry air and negative potential vorticity seen on the Airmass RGB.
|
14 July 2012 12UTC MSG Airmass RGB
|
14 July 2012 12UTC MSG IR10.8i with colour enhancement
|
|
|
WV 6.2 Imagery
The WV 6.2 image was used to evaluate the upper atmospheric horizontal moisture/humidity profile. dark areas represent a dry upper atmosphere, while white or grey areas represent a more moist upper atmosphere. Maximum moisture can be seen in the areas depicted as brightest white, found over the southern parts of South Africa, and to the south-east of the country. With the exception of a band of dry air intruding from southern Botswana, through the central parts of South Africa and curving in to the area of negative potential vorticity identified on the Airmass RGB, the upper atmosphere over South Africa is fairly moist. the availability of upper air moisture in such a wide band is a typical pattern associated with COL weather systems over South Africa, where mid level and upper level cloud accompany the system to the east and west.
VIS 0.6 Imagery
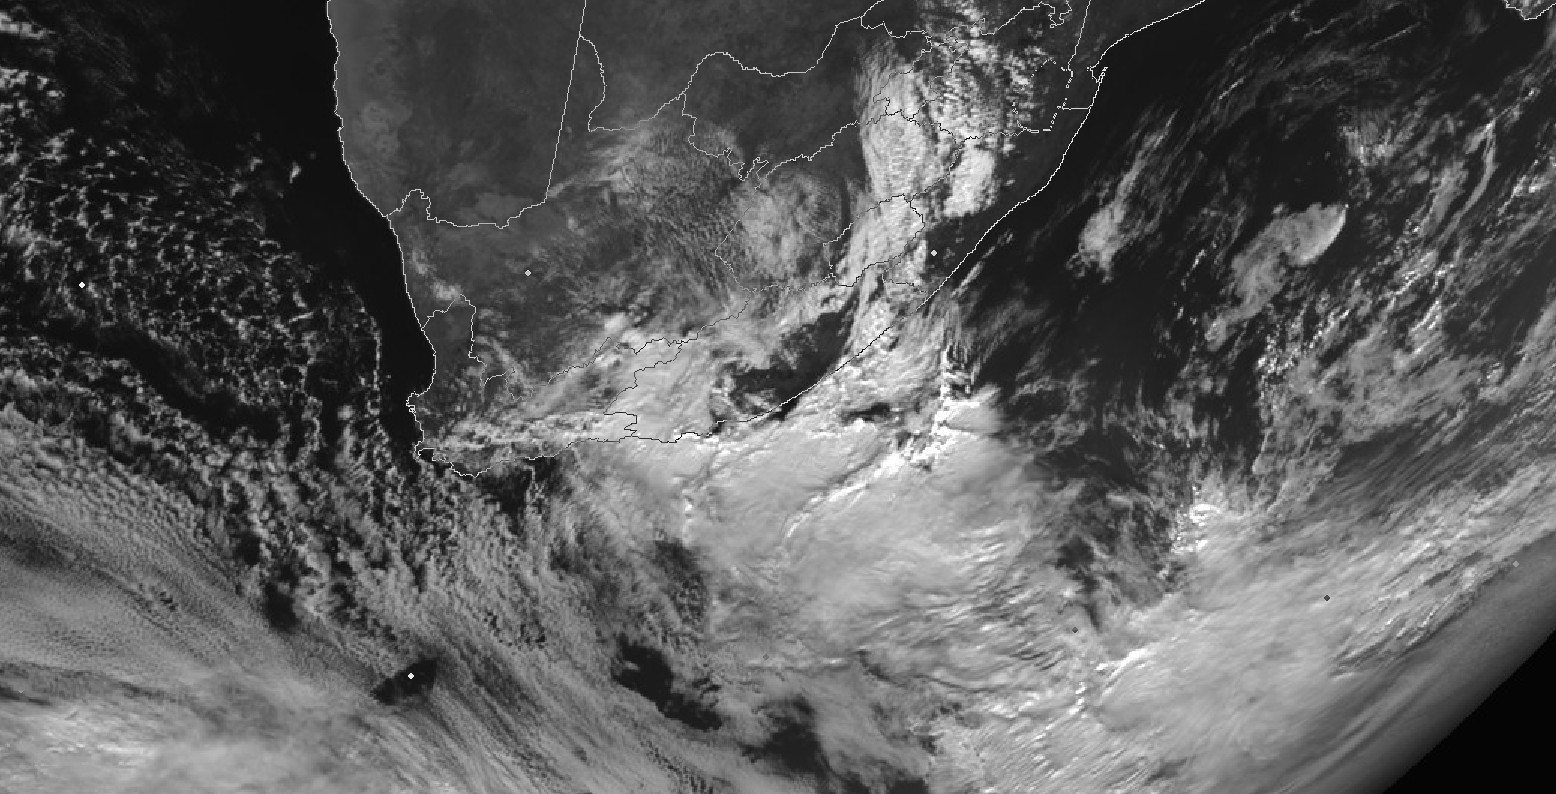
The VI S0.6 channel was used to identify where the thickest clouds were found, as can be seen by the brightest white color on the image. Thick clouds with a clumpy/irregular shape are generally convective clouds, which in COL cases, can result in persistent and possibly heavy precipitation. Snowfall on the higher mountain peaks can also result from thick cloud associated with the COL. on the VIS 0.6 image, there are not many clouds which are depicted as bight white, although the brightest/thickest clouds are evident over the southern and south-eastern parts of South Africa, which coincides with the areas of coldest CTT and highest humidity values seen on the WV6.2 and IR10.8 images.
|
14 July 2012 12UTC MSG WV6.2
|
14 July 2012 12UTC MSG VIS0.6
|

|
|
The video loop below is valid from the 13th July 2012 at 12UTC until the 14th July at 12UTC, in 3 hourly time steps. this video shows the clear rotation of the COL as it progresses from west to east, over the southern parts of South Africa. The deep convective clouds can be seen on the south-eastern, southern and south-western parts of the COL, and this is where the heaviest precipitation would be expected. On the Airmass RGB, the red colour indicates the intrusion of dry stratospheric air and (negative) potential vorticity. this coincides with where the rotation can be seen in the video. The dry air is being drawn cyclonically into the center of the COL and results in a cloud-free area.

|
Press "Play Button" for MSG Airmass RGB 13 July 2012 12UTC - 14 July 2012 12UTC. |
Typical synoptic pattern and cloud features
The four images below are depicting the 500Hpa geopotential (gpm) heights and typical cloud features as observed on satellite imagery during the 4 stages of development of a typical COL pressure system. These four images were derived from looking at 4 separate COL case studies over South Africa, and combining these features into a conceptual model.
In the first stage, it is clear that the bands of cirrus and cumulonimbus (CB) clouds have formed east of the upper trough, while the low level cold air cumulus clouds are found below the center and to the west of the upper trough. In the second, tear-off stage, the CB and thin cirrus cloud to the east of the upper trough have started to form an inverted comma shape, following the cyclonic circulation pattern around the eastern and southern part of the upper low which has begun to tear away from the main westerly flow.
By the time a COL has formed, stage 3, there are low level stratiform clouds found to the south and west of the upper trough and also beneath the band of cirrus and CB clouds in the east. The inverted comma shape cloud start developing during the tear-off stage becomes more clear and distinct in the cut-off stage of the system.
During the final stage of the system, the upper air flow is no longer showing a closed circulation and a more zonal flow returns. The low level col air cumulus cloud can still be seen below the position of the upper trough, while the CB cloud and low level stratiform cloud no long form and inverted comma shape, and begin to thin out and dissipate.
|
Stage 1
|
Stage 2
|
|
|
|
Stage 3
|
Stage 4
|
|
|
Meteorological Physical Background
Introduction
A Cut-Off Low (COL) is a low pressure system that develops south of South Africa, stemming from the main westerly trough systems of cold air. As the COL develops, it deepens into a defined closed system that extends to the surface and which also becomes displaced equator-ward of the main westerly flow . A COL system usually prevails over an area for more than a day , and can last up to 6 days. The COL moves slowly over a confined region leading to heavy rainfall. COL's are unstable, baroclinic systems that slope to the west with height and are associated with strong convergence and upward motion, particularly while they are deepening. The source of major divergence necessary to act together with the surface convergence to produce deep uplift that is observed in COL's occurs at a level which is much higher than 500hPa.
|
Areas of convergence, divergence and uplift associated with COL systems, at the surface and 500hPa
|

|
Broad Overview
The Conceptual model has been developed in order to create a visual model that depicts the theory of COLs as we know it. The CM is build around the use of MSG satellite imagery and NWP fields to clearly depict the characteristics, movement and intensity of the systems.
The occurrence of COL pressure systems is not limited to the southern hemisphere and much research has been conducted for northern hemispheric COLs, with the addition of a CM already available.
| Characteristic traits of COLs | Southern Hemisphere | Northern Hemisphere |
|---|---|---|
| Occurrence season | Common over South Africa, Namibia, South America and Australia. | Common regions of occurrence are over Europe, China-Siberian regions, North Pacific, Northeast of United States and the northeast Atlantic. |
| Latitude of occurrence | Mid-latitudes between 20° and 45° South. | Mid-latitudes between 25° and 45.5° North. |
| Depth of systems | Extend from upper levels down to the lower levels of the atmosphere, 200hPa - 850 hPa. | Stretch from the high to the mid-levels of the atmosphere. |
| Associated low level systems | Surface low and/or cold front. It is possible to have a ridging high pressure system as well. | Not always associated with a surface low. |
| Average number COL per annum | 40 | 32 |
| The general movement of COLs is from west to east, although an east-to-west propagation is possible (retrograde) | ||
| They are cold cored systems, with the central air originating from the higher (colder) latitudes. | ||
Geographical Location
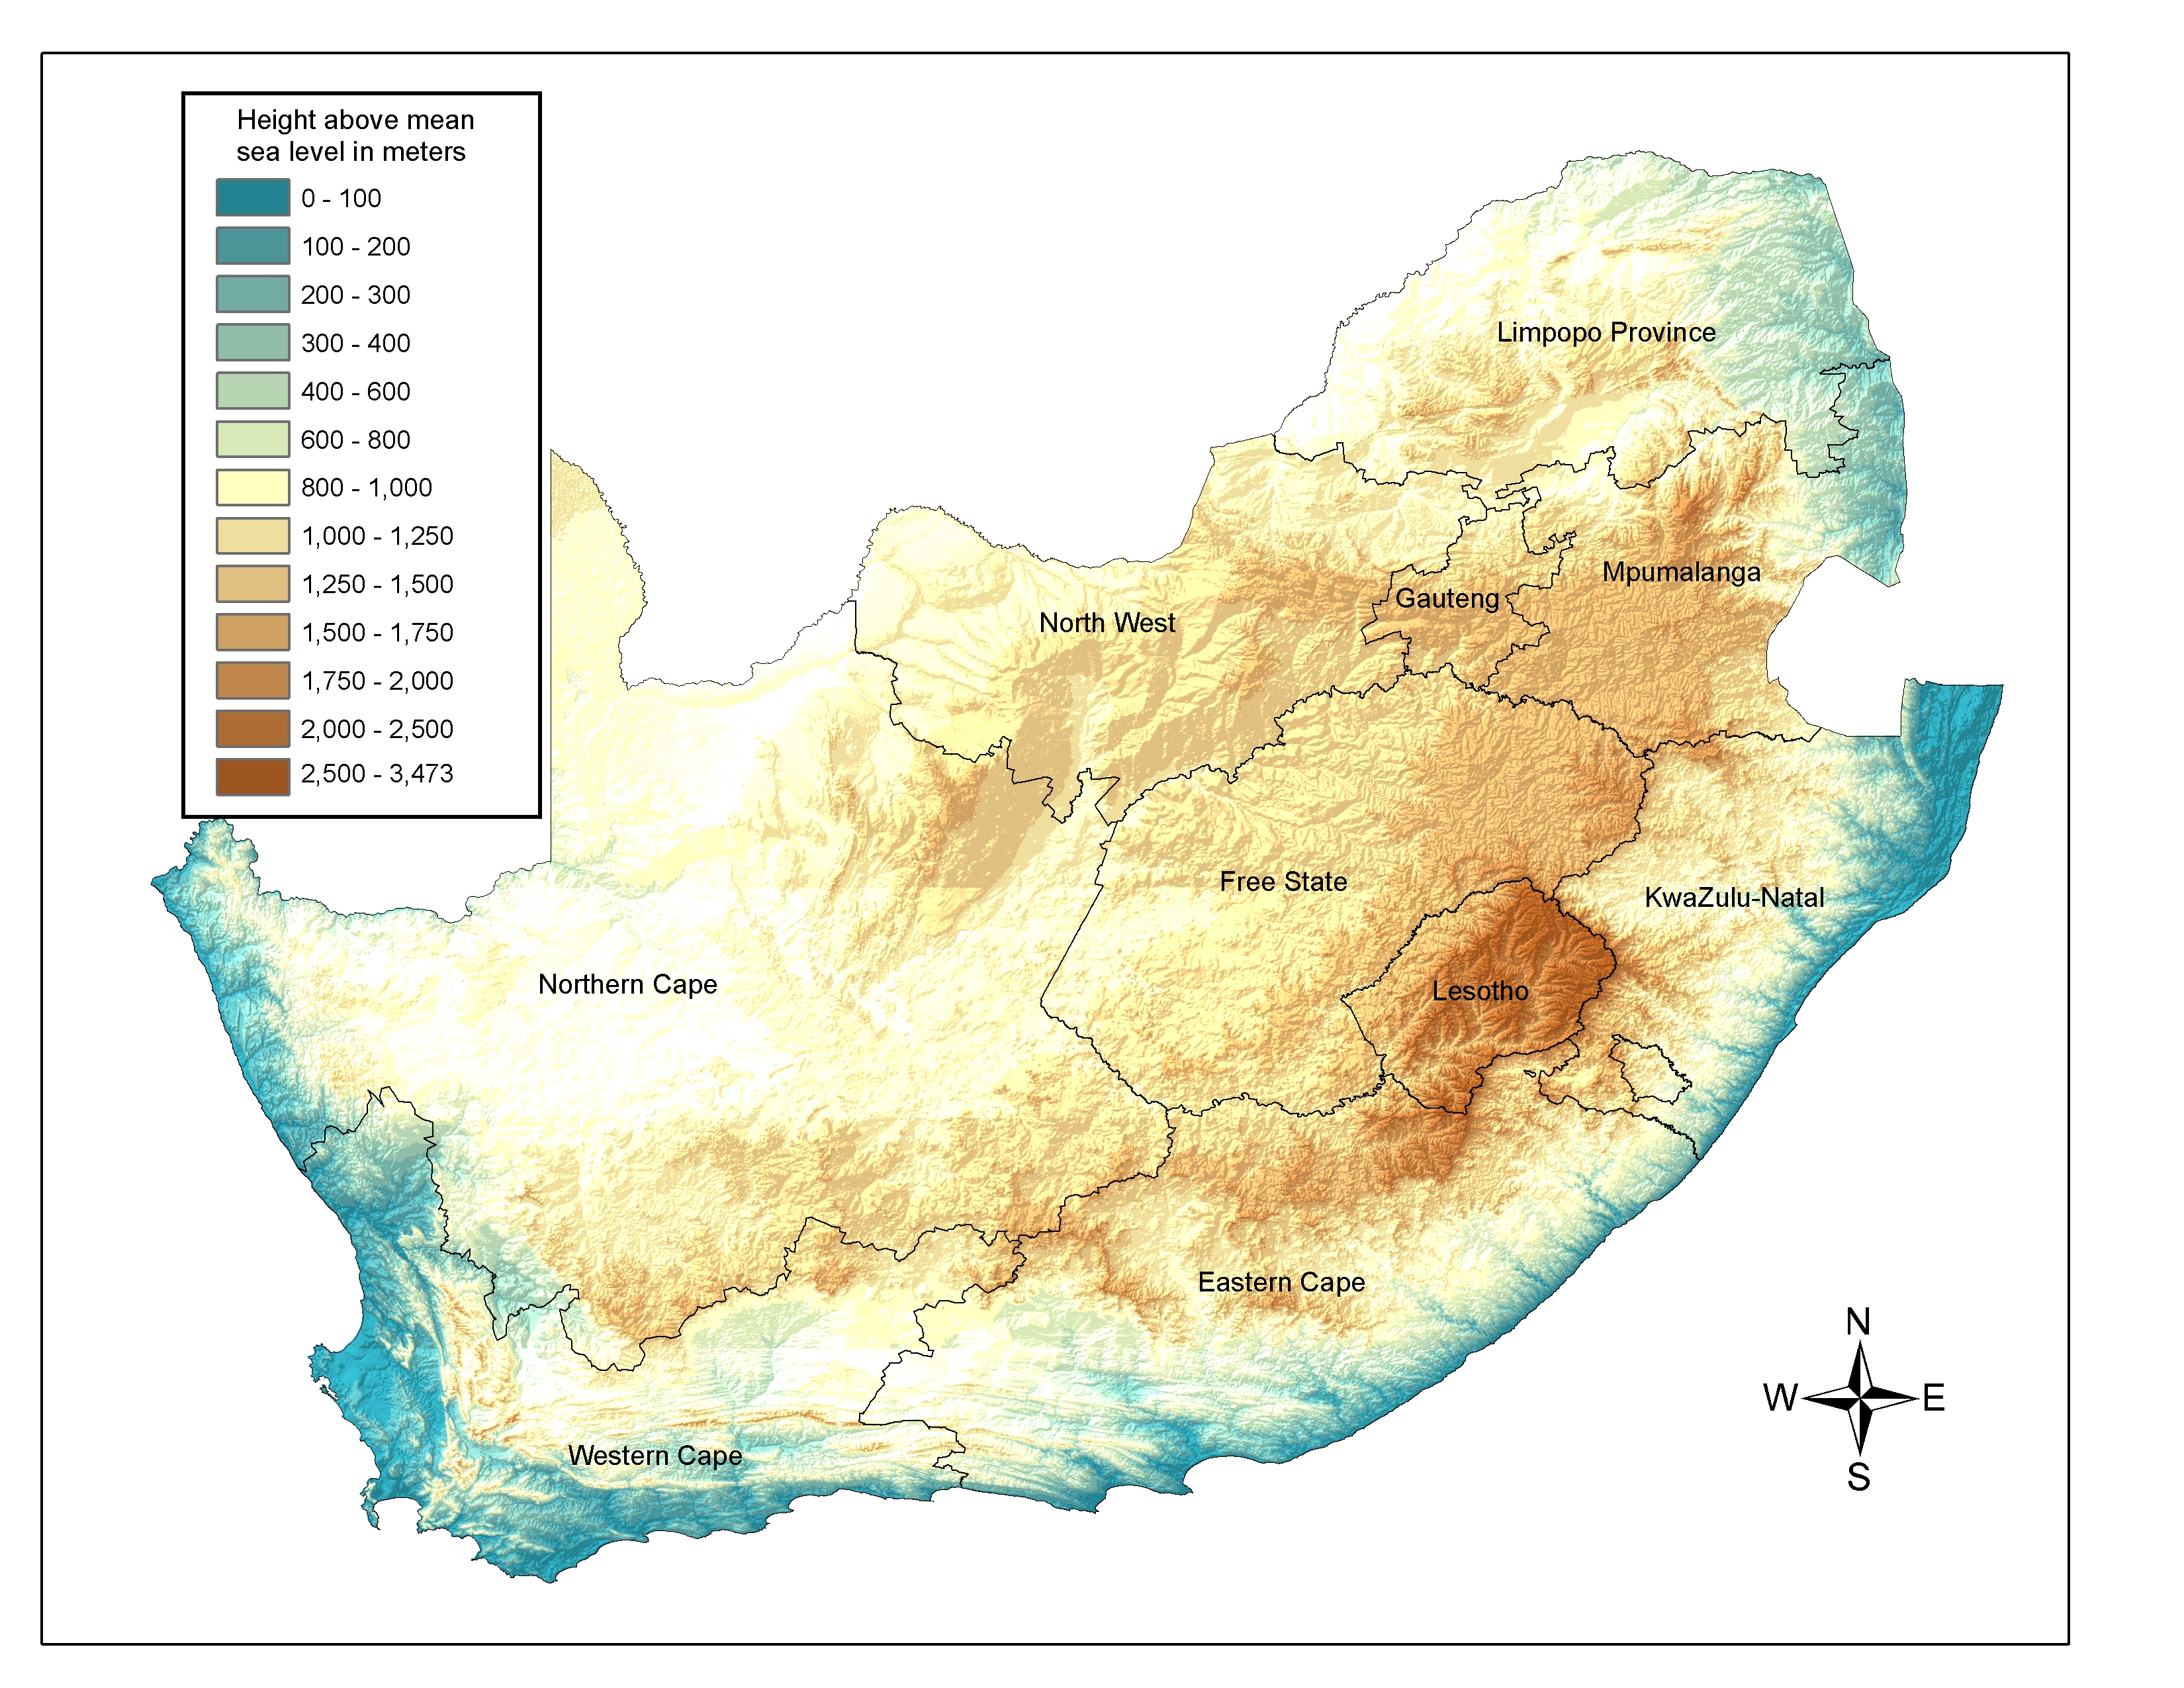
The topographical map of South Africa given below, shows just how close the mountain ranges are to the South African coastline, a feature which has a large effect on the amount and location of rainfall over the southern, south-western and south-eastern parts of the country, when dealing with COL systems. The locations of the COL systems themselves, vary from season to season, however, the distribution of the systems zonally in both hemispheres is mostly between latitudes 20 and 45 ° north and south of the equator, extending to 45.5 ° in the northern hemisphere. Along the longitudes the distribution is variable, with the maximum density around 38 ° East.
|
Topographical Map of South Africa
|
|
Seasonal variety
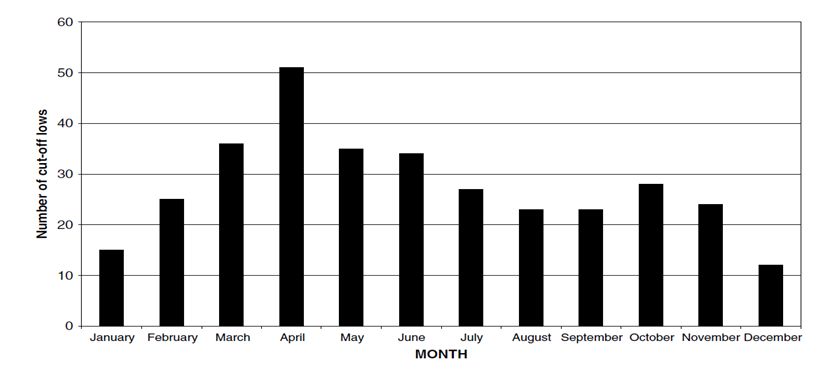
It is shown in the graph below that the COLs are most frequent during the autumn season in South Africa (March, April and May), with the highest frequency during April. Severe weather conditions are associated with the least frequency of COL systems whereas the low winds in the upper air and dry conditions in the lower troposphere are associated with the highest frequency of the system. But nevertheless, states that one out of ten COLs produces severe conditions and leads to flash flooding. From the 31 year climatology in which looked at, they identified a total of 1253 events, 40 COLs per year which is one COL system per week in the southern hemisphere. Out of the total number of systems that form in the southern hemisphere, they found only 126 of them developed over Southern Africa.
Life Cycle
The life cycle of the COL in the Southern Hemisphere has been divided into four stages, namely: Upper Trough Stage, Tear-off stage, Cut-off stage and the final stage. These four stages can occur over a period of up to 6 days. An idealized schematic representation for the life cycle of the COL over a six day period is shown in the imagery below.
Key Parameters
The key NWP parameters for this Conceptual Model were determined from commonly used parameters in the forecasting environment. Previous studies dating back to the 1980's only made use of parameters such as pressure fields and thicknesses. These fields were never combined into a "typical overview" and were only used in isolated case studies. For this reason, the NWP key parameters that follow, are more modern fields that can be used to determine the position, intensity and movement of the COL systems. A future project would be to create a more statistically viable overview of the NWP parameters listed below, over a 20-30 year period.
The key NWP parameters that are considered with COL pressure systems are:
-
Vertical Velocity
Vertical uplift is very important when locating areas where the COL is intensifying, particularly when it coincides with areas of negative potential vorticity in the upper levels. -
Divergence
Areas of convergence (Negative divergence). in the lower and mid levels of the atmosphere will promote uplift in the lower and mid atmosphere as well, which will enhance the negative potential voticity in the upper atmosphere. -
Potential vorticity
Negative potential vorticity in the upper air is an indicator of the development and possible intensification of a low pressure system. -
Geopotential heights
The geopential heights at various levels depict the synoptic flow -
Wind fields
Wind fields at corresponding geopotential heights are very helpful in identifying when a COL begins to tear off from the main westerly flow.
Surface (MSLP) and 500hPa synoptic scale flow
The imagery below gives insight to the NWP parameters measured on the 13th of July 2012. The MSLP and 500hPa height overlays are an introduction to the large scale synoptic flow patterns dominating at this time.
|
IR10.8 Satellite image overlaid with 500hPa Geopotential heights (gpm) valid for 13 July 2012 at 1200UTC
|
|
|
Looking at he MSLP on the 13th July 2012 at 1200UTC, there was a trough system dominating over the central parts of South Africa, extending to a cold front east of the country. the Atlantic high pressure system was ridging along the southern coastal belt, resulting in an onshore flow along the coastline behind the cold front. the central pressure of the High is in the region of 1046hPa, which is extremely intense. |
|
IR10.8 Satellite image overlaid with Mean Sea Level Pressure (MSLP) valid for 13 July 2012 at 1200UTC
|
|
|
At 500hPa, the COL is situated over the western interior of South Africa, with the 500hPa trough extending over most of the central and eastern parts of the country. This upper trough extends south and south-east of South Africa as well. |
Vertical Velocity (omega)
|
NCEP reanalysis data: Vertical velocity (omega) [Pa/s] at 500hPa, valid for 13 July 2012 at 12Z
|
IR10.8 Satellite image overlaid with Vertical velocity (omega) at 500hPa valid for 13 July 2012
|
|
|
1000 - 500 hPa Thickness
|
NCEP reanalysis data: 1000 - 500hPa thickness (gpm), valid for 13 July 2012 at 12Z
|
Airmass RGB valid for 13July 2012 at 1200UTC
|
|
.gif)
|
Potential vorticity
|
ECMWF reanalysis data: Potential vorticity at 200 hPa , valid for 13 July 2012 at 12Z
|
IR10.8 Satellite image overlaid with Potential vorticity at 200hPa valid for 13 July 2012
|
|
|
Geopotential Heights
|
NCEP reanalysis data: 300 hPa geopotential Height (gpm), valid for 13 July 2012 at 1200UTC
|
IR10.8 Satellite image overlaid with 300hPa geopotential Heights (gpm) valid for 13 July 2012 at 1200UTC
|
|
|
|
NCEP reanalysis data: 500 hPa Geopotential height (gpm), valid for 13 July 2012 at 12Z
|
IR10.8 Satellite image overlaid with 300hPa geopotential Heights (gpm) valid for 13 July 2012 at 1200UTC
|
|
|
Wind fields
|
NCEP reanalysis data: 300 hPA winds (kt), valid for 13 July 2012 at 12Z
|
IR10.8 Satellite image overlaid with 300hPa winds (kt) valid for 13 July 2012 at 1200UTC
|
|
|
Typical Appearance In Vertical Cross Sections
The NWP parameters that describe the vertical structure of the Conceptual Model:
-
Potential vorticity
You will be looking for times when you start to see values of negative PV in the upper atmosphere, and then descending towards the surface. This will indicate the depth and vertical extent of the COL. -
Relative humidity
The highest relative humidity values should be coincident with where the deepest convection is occurring, as well as where the thickest stratiform cloud is occurring. Such cloudy areas are important to locate in order to understand where the highest risk of heavy precipitation is located. -
Vertical Velocity (Omega)
Negative values of Omega are indicative of where uplift is occurring, which is an important factor when locating ares of convective development and potentially heavy falls of precipitation.
An important point to note, would be that the NWP products should be viewed along side one another and not in isolation. The coincidence of areas with high relative humidity, vertical uplift and negative values of potential vorticity, will be the areas favoured for the most active convective precipitation.
All vertical cross sections below were done on a constant latitude line of 33deg south, and between 20deg East and 30deg East in longitude. an example is given below.
Potential Vorticity 13 July 2012 12UTC
|
A vertical cross section of ECMWF Equivalent potential temperature overlaid with Potential vorticity along a constant line of latitude at 33° South valid for 13 July 2012 at 12UTC.
|
|
|
On the 13th July at 12UTC, the lowest values of PV were found between 22 and 23deg longitude, which is over the south-western interior of South Africa. the lowest values are observed at approximately 250hPa, which is a typical pattern for COL pressure systems, as the low pressure originates in the upper atmosphere and extends toward the surface over time.
|
|
Potential Vorticity 14 July 2012 06UTC
|
A vertical cross section of ECMWF Equivalent potential temperature overlaid with Potential vorticity along a constant line of latitude at 33° South valid for 14 July 2012 at 06UTC.
|
|
|
18 hours later, at 06UTC on the 14th July, negative PV is extending from the upper levels towards the surface, and is evident as low as 600hPa at a longitude of 25.5°. This is evidence of the COL intensifying while over land, and progressing eastward with time. Lowest values of PV are still found between 21 and 22° East, around 200hPa. considering that COL pressure systems are baroclinic systems, this orientation of a westward displacement of a low pressure system with height, is consistent with what is expected.
|
|
Relative Humidity 14 July 2012 12UTC
|
A vertical cross section of ECMWF Equivalent potential temperature overlaid with Relative Humidity (%) along a constant line of latitude at 33° South valid for 14 July 2012 at 12UTC.
|
|
|
The depth of highest values of Relative humidity is found between 23 and 24° East, extending from the surface until nearly 300hPa. this area of deep moisture is located west of where the COL is extending to the mid levels of the atmosphere, as seen in the potential vorticity field above. The dry area seen in the relative humidity field, between 26 and 28° East, is coincident with where the surface low pressure system is located in the satellite imagery.
|
Potential Vorticity 14 July 2012 06UTC
|
A vertical cross section of ECMWF Equivalent potential temperature overlaid with Vertical Velocity (Omega) along a constant line of latitude at 33° South valid for 14 July 2012 at 12UTC.
|
|
|
Maximum uplift is found between 500hPa and 600hPa at a longitude of 22° east. in this area, the uplift extends from the surface, vertically to above 300hPa. such a deep zone of uplift is very favourable for convective development. a similarly deep zone of uplift is fund off the east coast of South Africa, at 31deg East, and is coincident with the broad band of convective cloud seen on the satellite imagery, east of the COL. the zone of uplift coincides well with where the deepest layer of relative humidity is found, as well as being east of the zone of negative values of PV which are extending to the surface, over the eastern parts of South Africa.
|
|
Weather Events
The importance of recognizing and forecasting the development, intensification and movement of COL systems over and around South Africa is based on the fact that there are several severe impacts on the public with the passage of such a system.
| Parameter | Description |
|---|---|
| Precipitation |
|
| Temperature |
|
| Wind (incl. gusts) |
|
| Other relevant information |
|
References
- Fuenzalida, H.A, Sánchez, R and Gerreaud, R.D., 2005: A climatology of cut-off lows in the Southern Hemisphere. Department of Geophysics, Universidad de Chile, Santiago: Chile, Volume. 110, pp. 1 - 10
- Nieto, R, Gimeno, L , de la Torre, L, Ribera, P, Gallego, D, García-Herrera, R, García, J.A, Nunez, M, Redano, A and Lorente, J., 2005: Climatological features of Cut-off low Systems in the Southern Hemisphere. Journal of climate, Volume 18, pp. 3085 - 3103
- Taljaard, J.J., 1985: Cut-Off Lows in the South Africa Region. S. Afr. Weath. Bur. Technical Pap. 14, 153pp. S. Afr. Weather Service., Pretoria, South Africa.
- Tyson, P.D, and R.A Preston-Whyte, 2000: The weather and climate of South Africa. Oxford University Press South Africa: Cape Town, Edition. 2, pp 196 - 197
Special Investigation:
Weather Event of the 13th -15th July 2012
A COL that occurred over the southern parts of South Africa during this time, resulted in heavy rainfall that damaged property over the south-eastern parts of South Africa (Eastern Cape Province), the department of health stated that a number of houses collapsed due to the heavy rainfall and that three people died after a housing structure collapsed during a flood which occurred about 2.5km outside the town of Umtata. A local newspaper also reported that it snowed in the south-western parts of South Africa (Western Cape Province) in and around the town of Oudtshoorn.
| 24 hour rainfall totals from 12-13 July 2012 | 24 hour rainfall totals from 13-14 July 2012 |
|
|
| 24 hour rainfall totals from 14-15 July 2012 | |
|
The rainfall totals measured by the South African Weather Service (SAWS) for this COL event, clearly show that the southern coastal and adjacent interior regions of South Africa were the areas affected by the COL from a precipitation perspective, with the south-eastern parts of South Africa also receiving up to 30mm of rain between the 13th and 14th of July 2012. The southern coastal belt received over 60mm of rainfall during this period, and 24 hours later, on the 15th, measured over 100mm rain. The areas of heaviest precipitation coincide well with the areas of deepest convection seen to the east and the southern parts of the COL in the satellite imagery and NWP fields. The areas also correspond to where the maximum uplift was seen in the vertical cross sections, and to where deepest moisture was found.
|
|
The skew-T gram show to the left, represents the vertical profile of the atmosphere at Port Elizabeth, on the south-east of South Africa. the profile is very moist from the surface up to 450hPa. Speed and directional wind shear is evident between the surface and 850hPa, with winds shifting from light south-westerly to strong north-easterly in a matter of a few thousand feet. The upper Jet is present between 150hPa and 200hPa, where wind speeds are above 80Kt, from the north-west. The freezing level is located at 800hPa, which is low enough for snowfalls to be expected on the higher topography over the southern parts of South Africa.
|
Typical Synoptic sequence and weather associated with COLs around South Africa
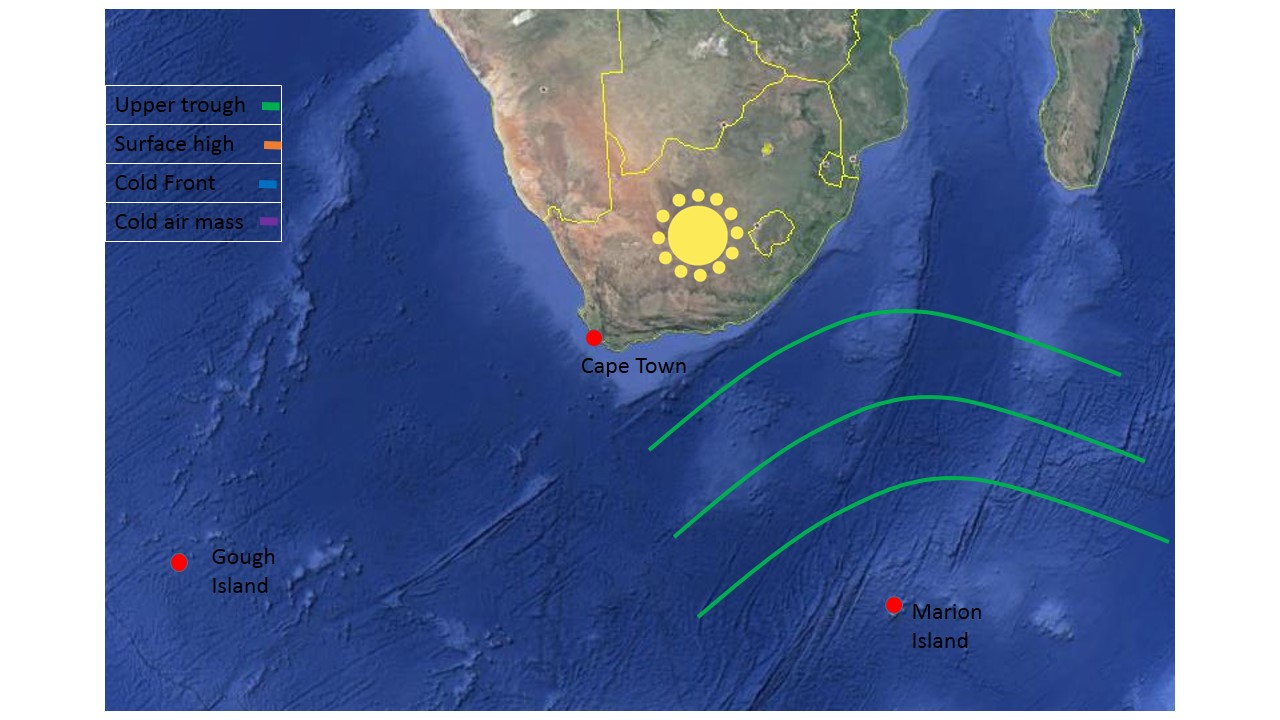
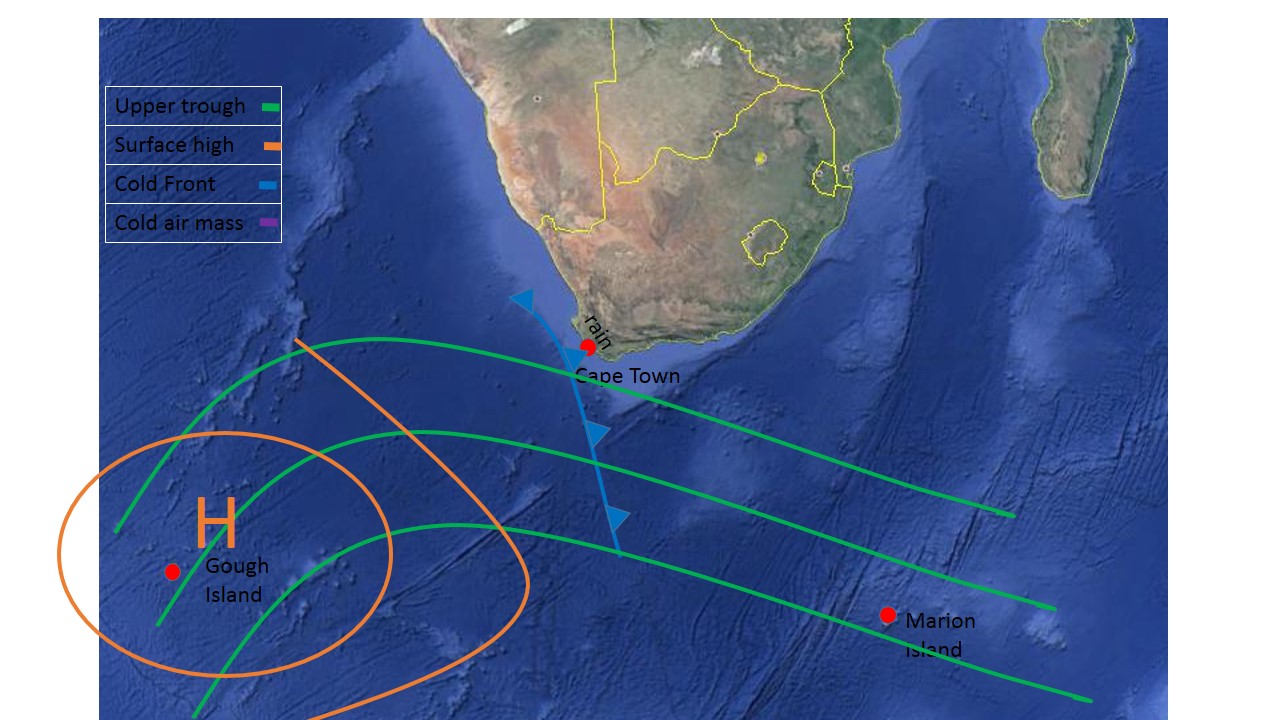
The map below depicts the Gough Island, Cape Town, Marion Island triangle which will be referred to in the following text. .
Stage 1
During the Upper trough stage of the COL development, one can expect an upper tropospheric long-wave trough located south-west of South Africa, in a triangular area formed between Gough Island, Cape Town and Marion island. A stronger than usual surface high pressure system can be expected near Gough Island and a cold front should be approaching Cape Town. Pressure would be falling rapidly ahead of the approaching Front at Cape Town, and rising behind the front.
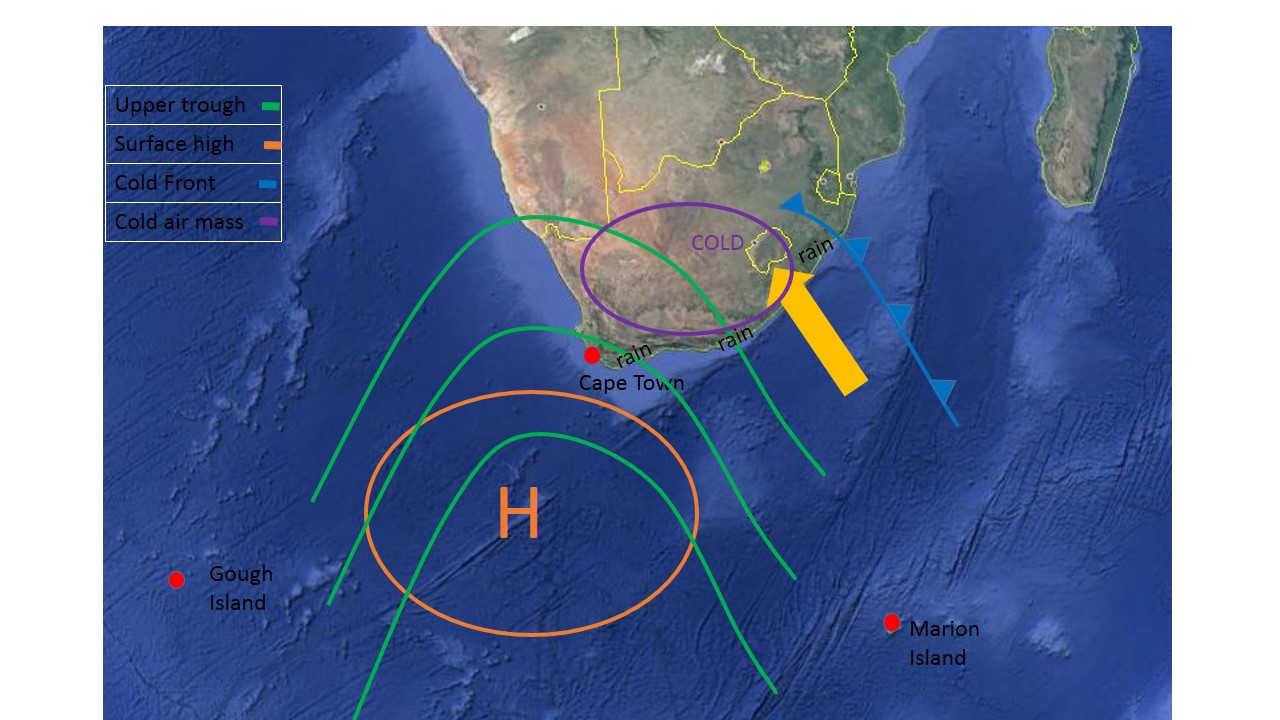
Stage 2
The second stage as when the amplitude of the upper atmospheric trough increases and becomes more "pointed". at the surface, the anticyclone (high pressure) moves south-eastwards and the onshore flow component of the wind increases over the South African east and south coast regions. At the surface, the cold front will be positioned over the eastern parts of South Africa, with the post-frontal cold air having spread over the southern and south-western parts of the country.
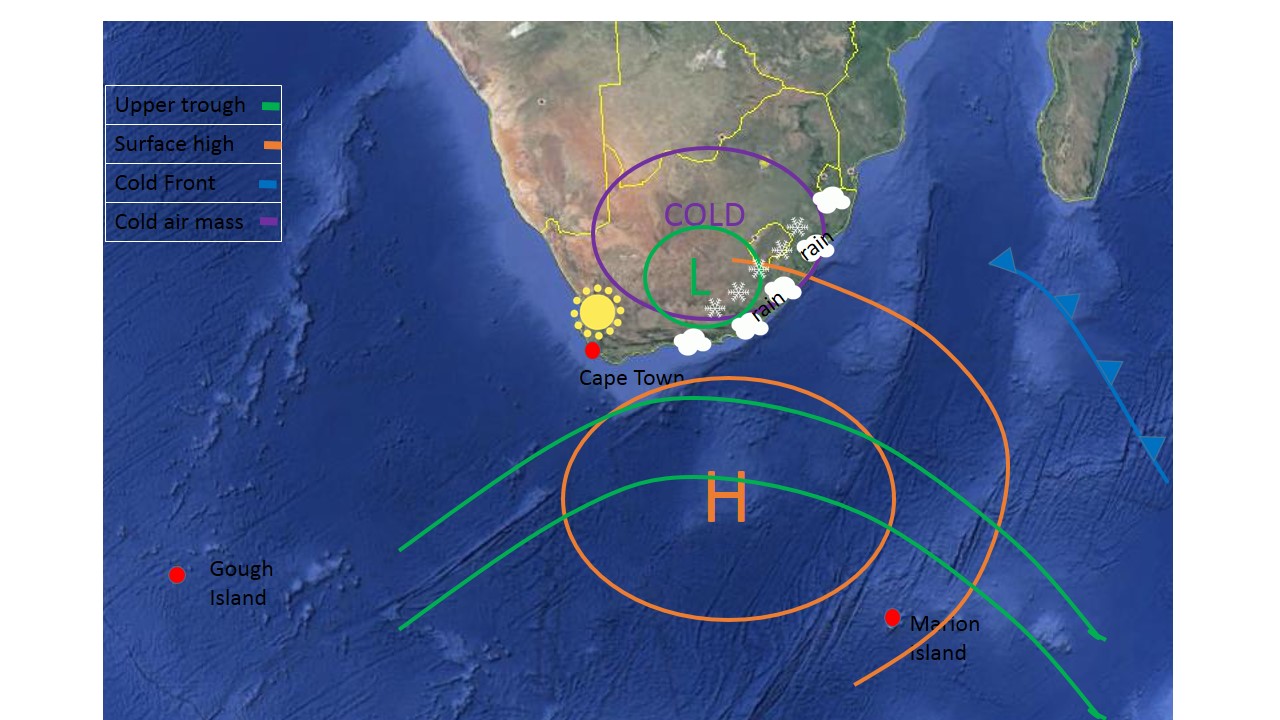
Stage 3
By this stage the COL has developed in the upper troposphere. The surface high pressure system continues to move eastwards but maintains its intensity and the onshore flow along the east coast of South Africa remains. By this stage, cold air would have advanced over most of South Africa. If the surface high remains strong and potentially intensifies, COL can essentially move very slowly eastwards.
Stage 4
It is during this final stage that the COL will collapse. This process can happen very rapidly and often catch forecasters off guard. during this stage, the upper air high which was trailing the COL, will weaken into a ridge at this point as well.