Typical Appearance In Vertical Cross Sections
-
Vertical Uplift:
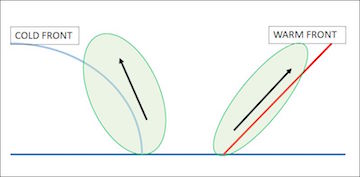
Negative values of omega (uplift) occurs along the boundary of the cold front, as the cold, more dense air behind the cold front forces the warm, less dense air to rise as the front moves into the relatively warmer air on its path eastwards.
-
Horizontal wind Convergence:
The eastward propagation of the cold front results in the cold, dense air west of the cold front boundary converging with the more stable warm air to the east of the cold front boundary as the front moves. This convergence in the lower levels helps to drive the resultant vertical uplift in the region of the cold front boundary.
-
Temperature advection:
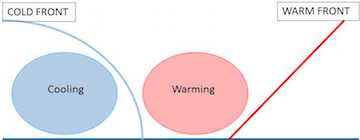
To the west and south-west of the cold front boundary, cold polar air is advected northwards and north-eastwards into a relatively warmer region of air ahead of the cold front. Similarly, the air between the cold front and warm front boundary is relatively warmer than the cooler air to the south of the warm front boundary and hence warm air advection is expected in this zone to the east of the cold front.
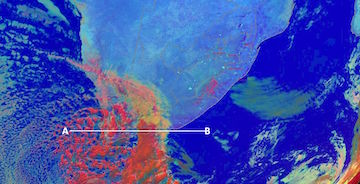
Two examples are shown here. The one over the Atlantic Ocean with all the typical features of a cold front and the other over is a sub-tropical example typical of fronts over South Africa.
Areas used for vertical cross sections
|
Classical exampleAirmass RGB valid for 29 August 2013 at 0600UTC
|
Sub-tropical example
Day Microphysical RGB valid for the 11 August 2012 at 1200UTC |
Vertical Uplift and Equivalent Potential Temperature
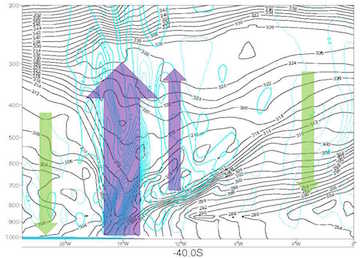
In the classical example over the ocean the vertical uplift occurs above the surface cold front with subsidence further west. In the subtropics a deep layer of vertical uplift is also present above the surface cold front but with more significant subsidence west of it. Over the ocean the vertical orientation of the cold front is visible in the tight gradients of equivalent potential temperatures and the uplift is mainly confined to the east of this boundary. The warm front is also clearly evident in the eastward slant of the tight potential temperature gradients and the uplift above the warm front. This boundary is absent in the sub-tropical example.
|
Conceptual model
The solid blue contours are upward motion and the dotted contours downward motion. The black contours are potential temperatures. |
Classical example
The solid blue contours are upward motion and the dotted contours downward motion. The black contours are potential temperatures. |
Horizontal wind Convergence
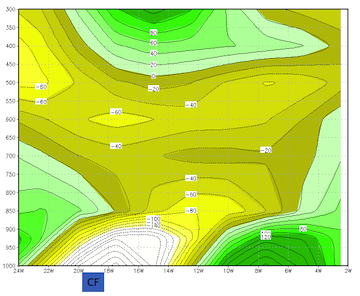
In the classical example over the ocean strong surface convergence occurs in the and directly to the east of the cold front. The convergence stretches to close to the tropopause although this happens further west of the surface cold front. Above the surface cold front, close to the tropopause divergence occurs. In the sub-tropical example it is apparent how the land mass changes the convergence field with the surface convergence not confined to the cold front but occurring all along the south coast. In the upper layers the convergence field above the surface cold front appears similar to the classical example with a deep layer of convergence but with divergence close to the tropopause.
|
Conceptual model
|
Classical example
Yellow shades are convergence and green shades divergence. Values multiplied by 10ES. CF indicates the position of the cold front at the surface. |
Temperature Advection
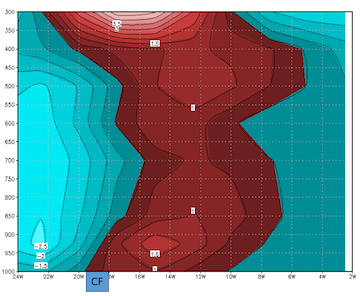
In the classical example over the ocean the cold air advection occurs to from the surface to the tropopause with warm air advection east of the front. The subtropical example the cold air advection occurs to close to 400 hPa with a layer of warm air advection above that.
|
Conceptual model
|
Classical example
Red shades are warm air advection and blue shades cold air advection. Values multiplied by 10E3. CF indicates the position of the cold front at the surface. |

