Key Parameters
-
Temperature:
As the cold front approaches South Africa, surface temperatures along the coastline increase due to the dry, off-shore northwesterly flow. If this flow is significantly strong berg winds develop. When the cold front makes landfall and progresses eastwards, surface temperatures west of the frontal boundary decrease along the coast and adjacent interior of South Africa. Depending on the position and strength of the Atlantic high pressure system behind the front, the colder temperatures may spill over the escarpment into the interior of South Africa. In general, it is not possible to identify the location of the surface front by temperature on infra red imagery alone, due to the masking effect of clouds. However, the cloud band associated with the cold front should be located ahead of the coldest surface temperatures.
-
Barometric Pressure:
The sea level pressure falls as the cold front approaches and rise sharply behind it. The rise in pressure is a combination of the frontal trough moving eastwards and the Atlantic Ocean High pressure which ridges behind the cold front. The coastal low which precedes the cold front by a few hundred kilometers will cause a pressure rise to its west and this increasing pressure may mask the approach of the cold front. Along the south and east coasts of South Africa, the coastal low will always precede the cold front and it is advisable to scrutinize all available information in order to distinguish these systems. The cold frontal cloud band will generally lie ahead of the largest pressure rise.
-
Wind Speed:
Wind speeds at the surface increase close to the frontal boundary with gale force (>35kt) winds possible along the South African coastline as the cold front progresses eastwards. The westerly to south-westerly gale behind the cold front can extend over a large area, depending on the positioning and intensity of the Atlantic high pressure ridging behind the front. The cloud band associated with the cold front will normally be found in the area where the wind shifts from a north-westerly to a south-westerly. Over the interior of South Africa, the gusty winds associated with the approach and passage of the surface front, can pick up dry sand, which may result in reduced visibility and more rarely, dust storms or blowing dust. Veld and bush fires also occur under these conditions.
-
Wind Direction:
Ahead of the cold front, one would anticipate a dominantly north-westerly wind and a south-westerly wind to the rear/west of the cold front. If a secondary low develops behind the front, the wind direction behind the front remain westerly and can even become north-westerly. Over the interior of South Africa it is more difficult to use wind direction to place the cold front, as the effects of friction and topography alter the wind direction at the surface. The cloud band associated with the cold front will normally be found in the area where the wind speeds are fairly strong and gusty.
-
Relative Humidity:
Along the coastal belt maximum values of relative humidity occur close to and coincident with the position of the cold front, from the surface to approximately 10000ft (700hPa). Highest values of relative humidity is therefore found in the frontal cloud band (as identified on satellite imagery). Cold fronts over the interior of South Africa are associated with very dry air behind the front.
-
Equivalent potential temperature:
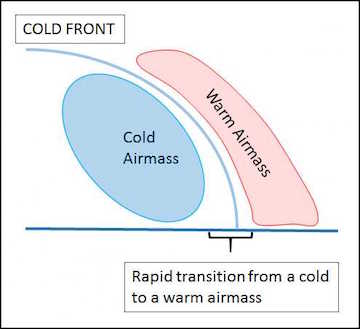
The equivalent potential temperatures (EPT) indicate the airmass boundary between the the warmer (east of the front) and colder (west of the front) temperatures associated with the front. The cold front is normally situated where the gradient of EPT are the highest and there should be at least a 3 degree change from east to west. The vertical profile of EPT is used to identify the convective instability of the airmass behind the cold front. When comparing the location of the cloud band associated with the cold front, it will generally be found behind/west of where there is a rapid transition from warm to cold airmasses. Due to the unique topography in South Africa, it is also possible that the low features of the cold front will become modified as the cold front moves over land. For this reason the tightest EPT gradient can also be found coincident with the low level cloud band associated with the cold front and not always ahead of it.
-
Wind Convergence and Divergence:
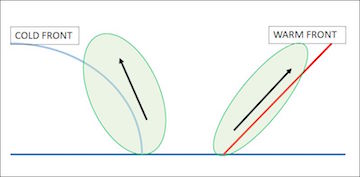
Due to the nature of a cold front progressing from west to east, the heavier more dense air behind the cold front will move into an area of warmer and less dense air. Along the boundary of the cold front in the lower levels horizontal wind convergence occurs from the surface to at least 700hPa. The cloud band associated with the cold front will be found in the region of strong surface, low and mid level wind convergence.
-
Vertical Velocity (Omega):
Due to the cold air behind the cold front being more dense than the warm air ahead of the cold front, as the cold air encounters the warm air mass, the cold air will undercut the warm air, forcing it to rise. The low level horizontal wind convergence will also result in air being forced to rise in the lower and mid levels of the atmosphere, close to and along the cold frontal boundary. The maximum values of vertical uplift in the low and mid levels will be found coincident with the cloud band associated with the cold front, when comparing the NWP field to the satellite image.
-
Temperature Advection:
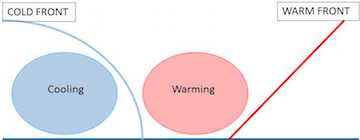
Temperature advection can be described as being the wind induced horizontal temperature change at a specific location. When applying this definition to the passage of a cold front over an area, one would expect to see areas of cold air advection slightly ahead, coincident with and behind the cold front. Warm air advection occur ahead of the cold front. Cold air advection occurs slightly ahead, underneath and behind the cold frontal cloud band.
|
Cape Town Meteogram on 29 August 2013
The cold front moved through Cape Town between 0500 and 0700 as the wind turns southwesterly during this period and the air dries, typical weather behind a front over the Peninsula. |
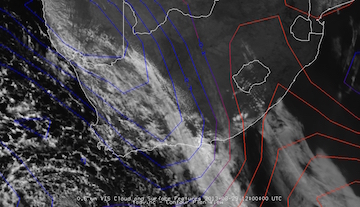
VIS0.6 overlay with 2m temperature 1200UTC on 29 August 2013
In general, it is not possible to identify the location of the surface front by temperature on infra red imagery alone, due to the presence of cloud, the cloud band associated with the cold front should however be located ahead of the area of where the lowest surface temperatures are being recorded. |
|
Port Elizabeth Meteogram on 29 August 2013
The cold front moved through Port Elizabeth between 1500 and 1700. The pressure starts to increase, temperatures drop and dew point depression fall. Note the southwesterly winds at Port Elizabeth before the passing of the front. This is due to the coastal low which moved through earlier. |
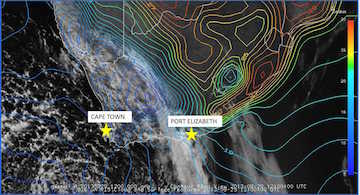
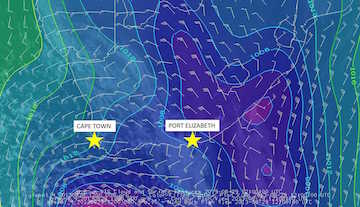
VIS0.6 overlay with mean Sea level pressure and 10m Wind on 29 August 2013
The cloud band associated with the front will generally lie ahead of where the greatest pressure rise occurs and where the surface trough is located. |
Surface temperature
|
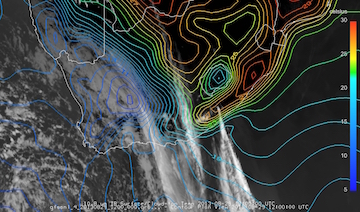
IR10.8 overlay with 2m temperatures on 29 August 2013 at 1200UTC
In general, it is not possible to identify the location of the surface front by temperature on infra red imagery alone, due to the presence of cloud, the cloud band associated with the cold front should however be located ahead of the area of where the lowest surface temperatures are being recorded. |
|
Relative Humidity
|
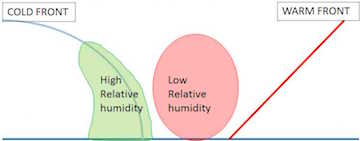
VIS0.6 overlay with relative Humidity at 850hPa on 29 August 2013 at 1200 UTC
The relative humidity will be highest in the region of the cloud band band associated with the cold front on the satellite image. |
|
Equivalent potential temperature
Typical Vertical cross section of equivalent potential temperature for Port Elizabeth on 30 August 2013 at 1200UTC
|
Equivalent Potential temperature for 30 August 2013
|
|
IR10.8 overlay with Equivalent Potential temperature and 10m wind on 11 August 2012 at 0600UTC
When comparing the location of the cloud band associated with the cold front, it will generally be found behind/west of where there is a rapid transition from cold to warm airmasses. |
|
Wind Convergence
Only negative values of divergence are displayed on the satellite overlay, where the areas of blue/green depict where most convergence is occurring.
|
Schematic depiction of convergence associated with a cold front.
|
IR10.8 Overlay with wind convergence (negative divergence) at 700Hpa on 11 August 2012 at 0600UTC
The cloud band associated with the cold front will be found in the region of strong surface, low and mid level wind convergence. |
Vertical Velocity
Only negative values of omega (uplift) are displayed with the satellite overlay, where the blue/green area depict where most uplift is occurring.
|
Schematic depiction of Vertical velocity associated with a cold front.
|
Day Natural Colour overlay with Vertical Velocity at 850hPa on 29 August 2013 at 1200UTC
|
|
Day Natural Colour overlay with Vertical Velocity at 700hPa on 29 August 2013 at 1200UTC
|
|
|
Day Natural Colour overlay with Vertical Velocity at 600hPa on 29 August 2013 at 1200UTC
The maximum values of vertical uplift in the low and mid levels will be found coincident with the cloud band associated with the cold front, when comparing the NWP field to the satellite image |
|
Temperature Advection
Blue indicates cold air advection and red warm air advection.
|
Schematic depiction of Temperature Advection associated with a cold front.
|
VIS0.6 with Surface Temperature Advection valid on 29 August 2013 at 1200UTC
When comparing the temperature advection NWP to the cloud band associated with the cold front, the cooling will happen slightly ahead, underneath and behind the cold front in the area of cold air cumulus. This indicates that the temperatures are decreasing in these areas with the passage of time. |
k.gif)
k.gif)

k.gif)
k.jpg)


