Key Parameters
|
|
| Surface pressure and 850 hPa wind | |
|
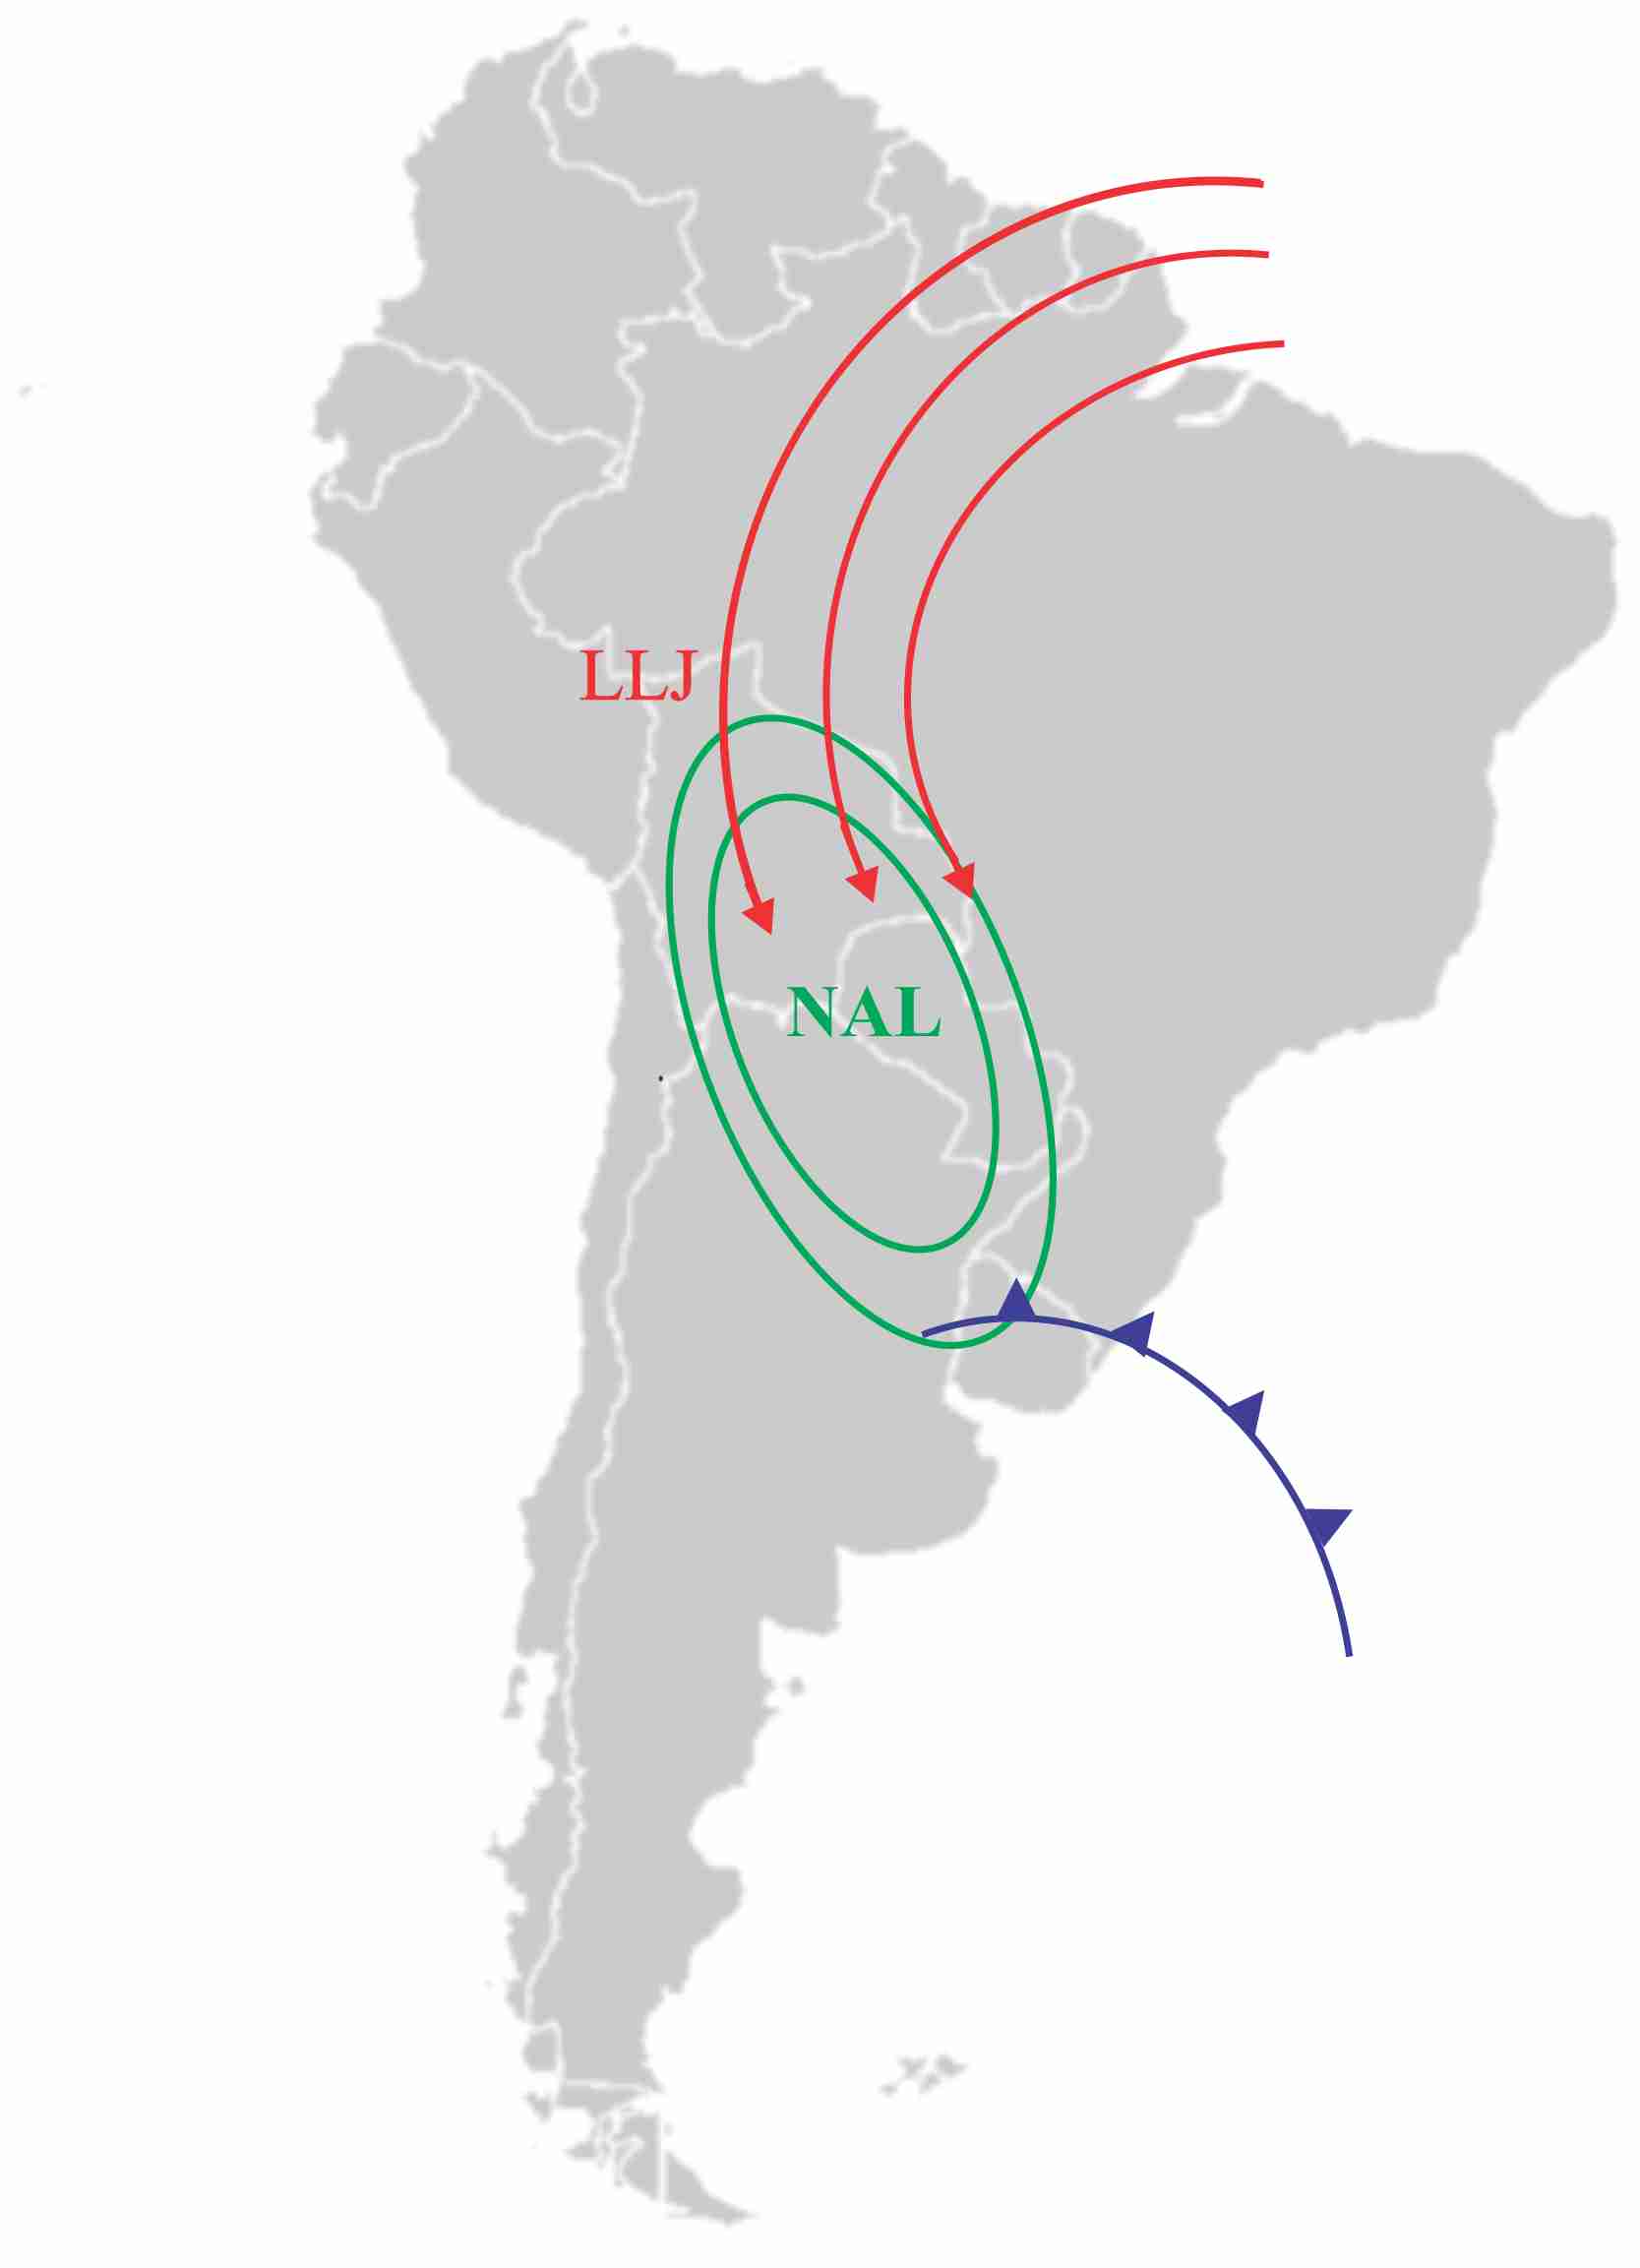
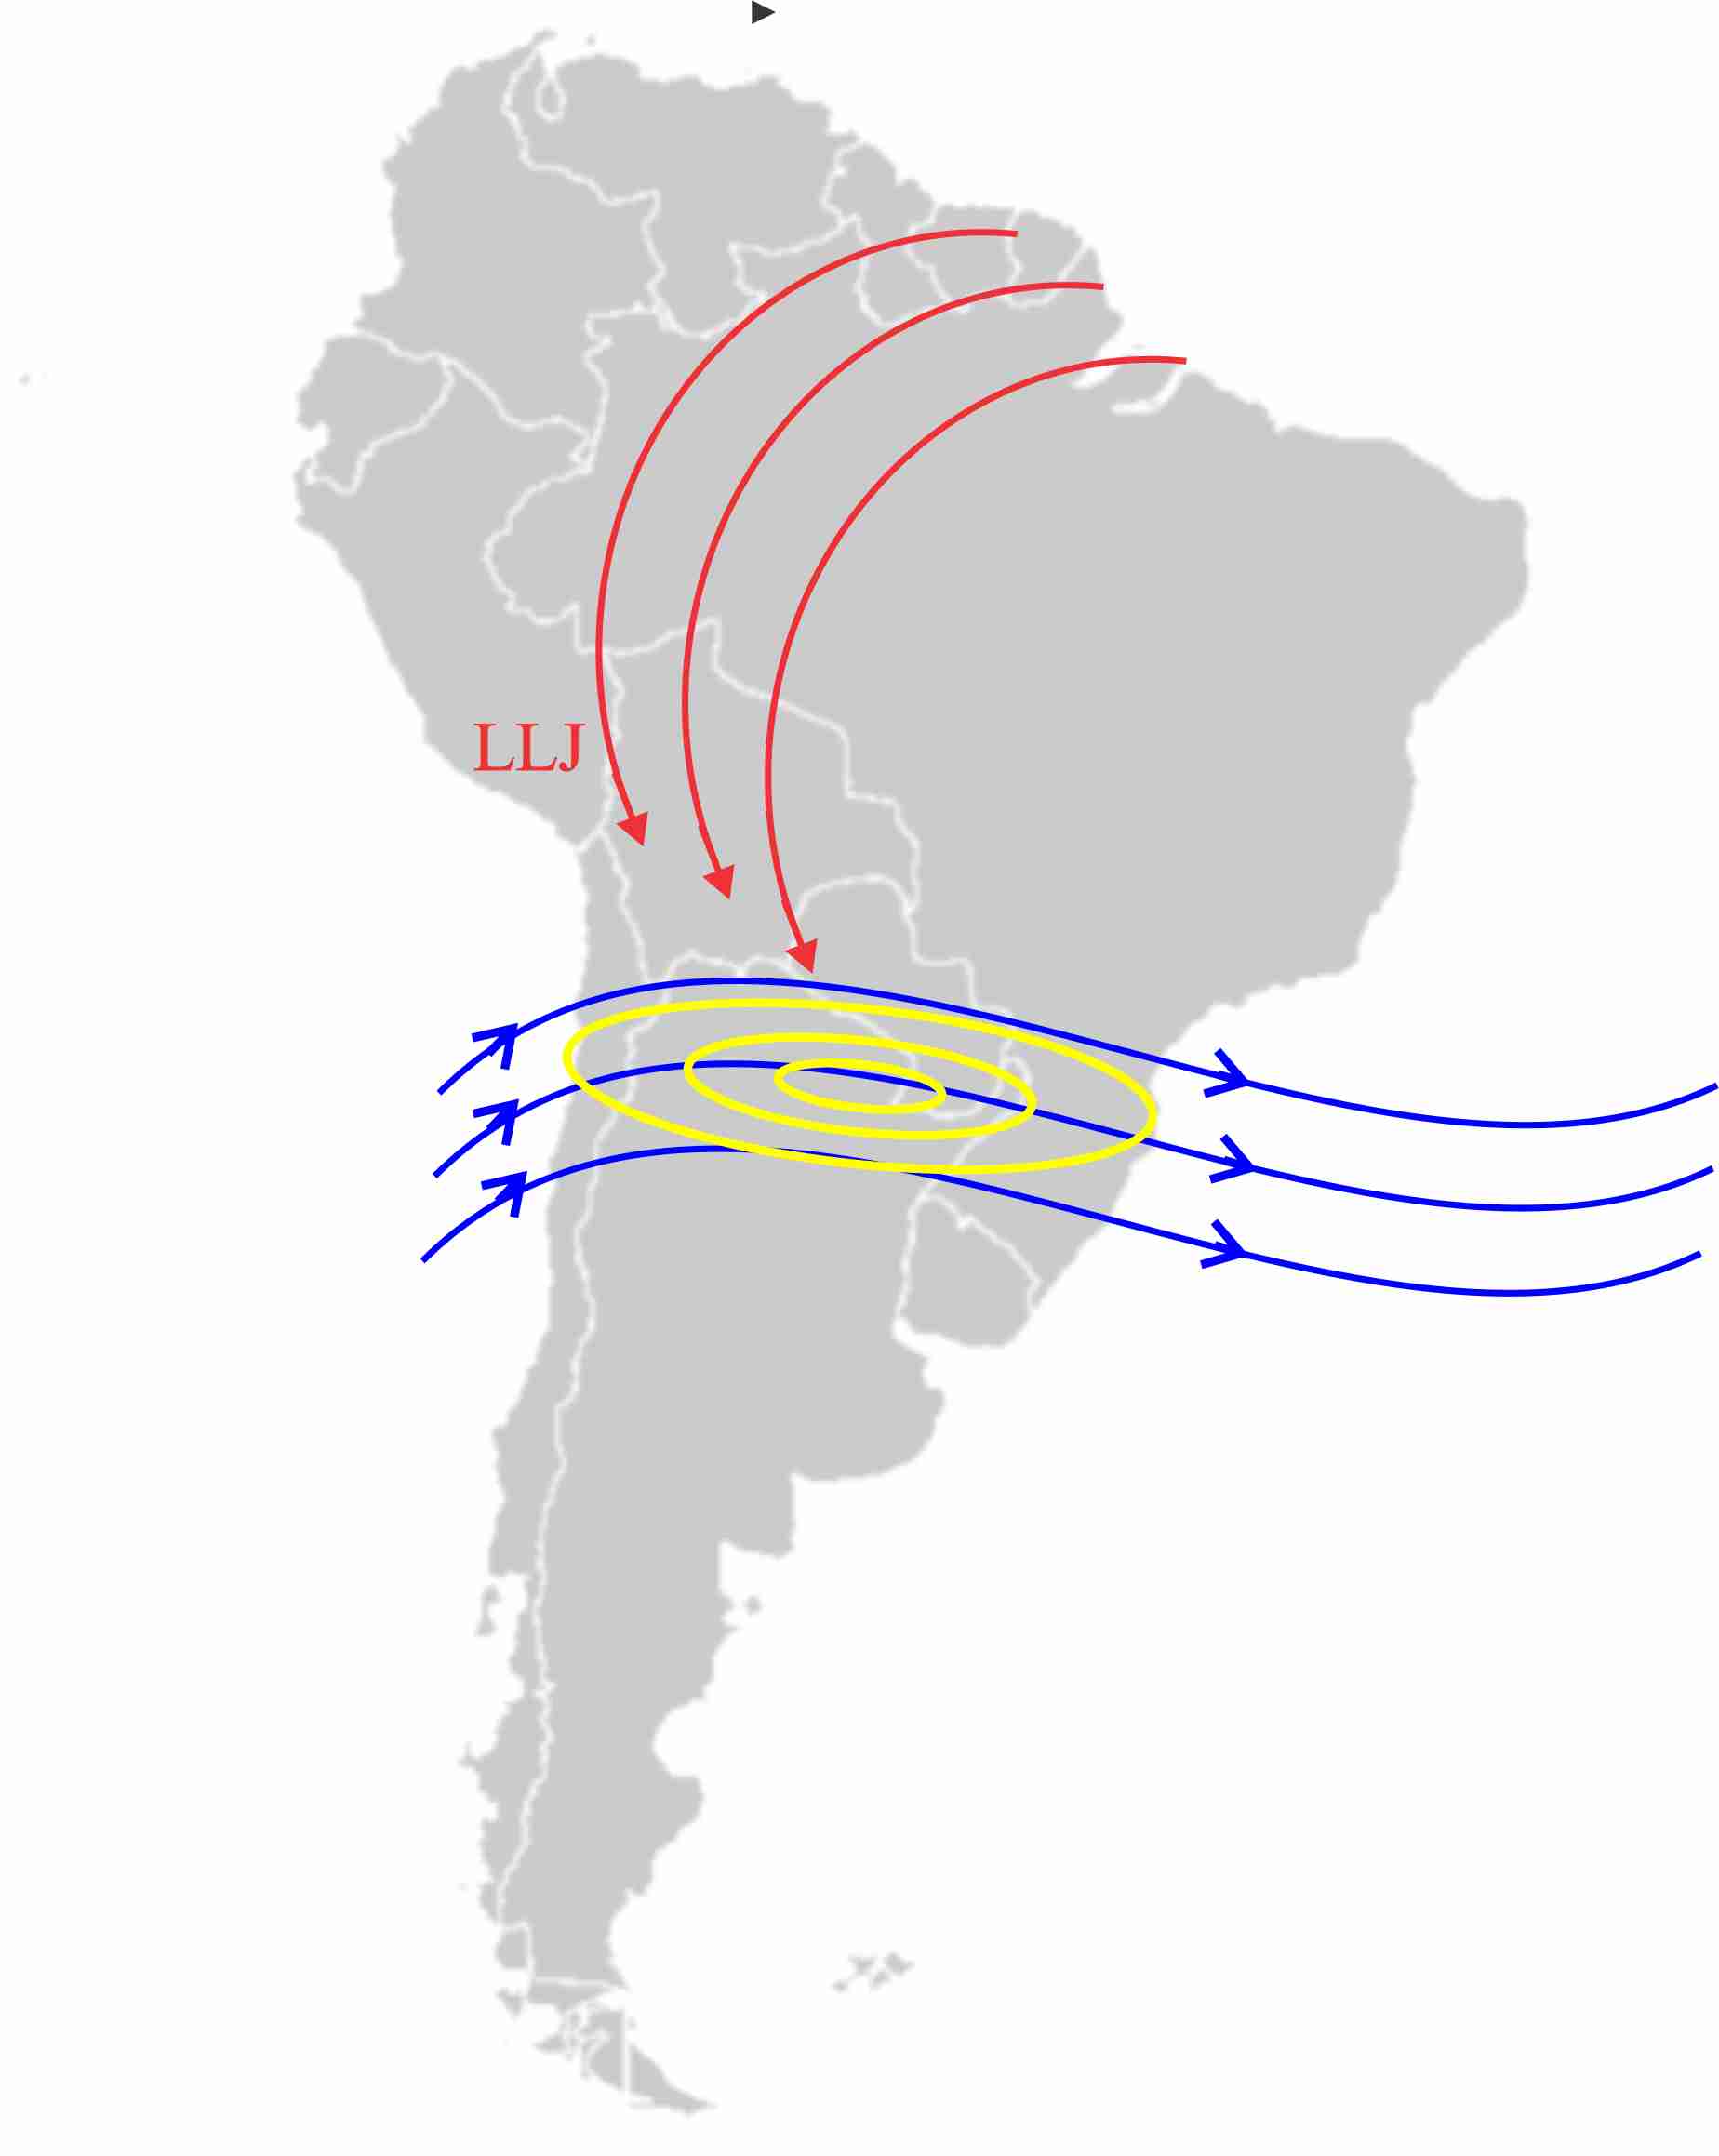
Schematic of the synoptic situation for the formation and development of MCCs. Low-level jet (LLJ), Northeast Argentinan Low (NAL) and a cold front passing southern South America.
|
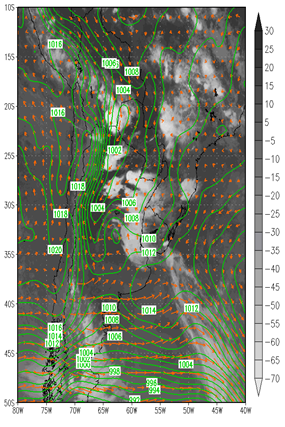
Mean sea level pressure (hPa) and wind 850 hPa (m/s) overlayed on a GOES 11.0 IR image on 9 November 2008 at 06:00 UTC
|
|
|
| Temperature Advection at 850hPa and Thickness (500hPa/1000hPa) | |
|
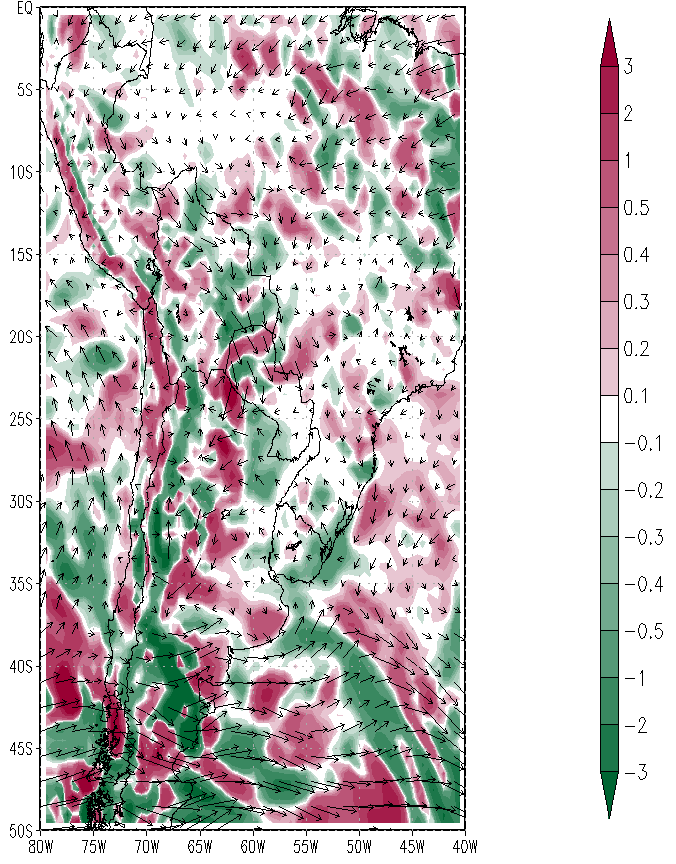
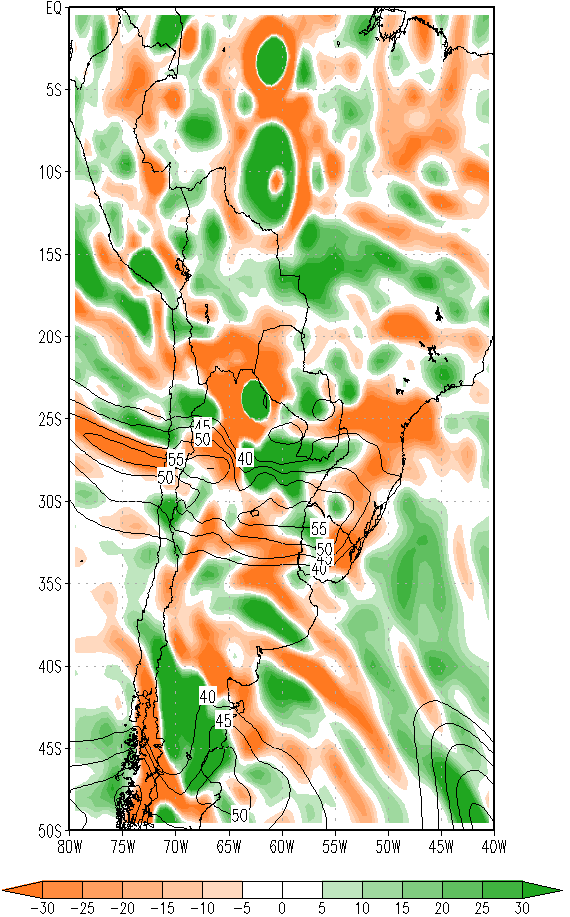
Temperature advection at 850 hPa (K/s) on 9 November 2008 at 06:00 UTC.
|
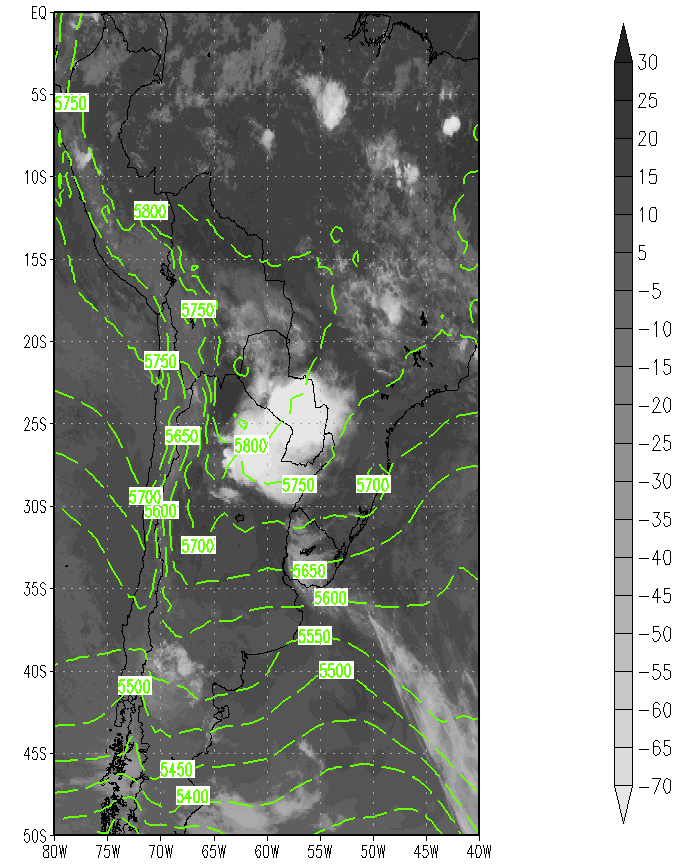
Thickness (500 hPa/1000 hPa) overlayed on a GOES 11.0 IR image on 9 November 2008 at 06:00 UTC.
|
|
|
| Convective Available Potential Energy and Enhanced IR channel | |
|
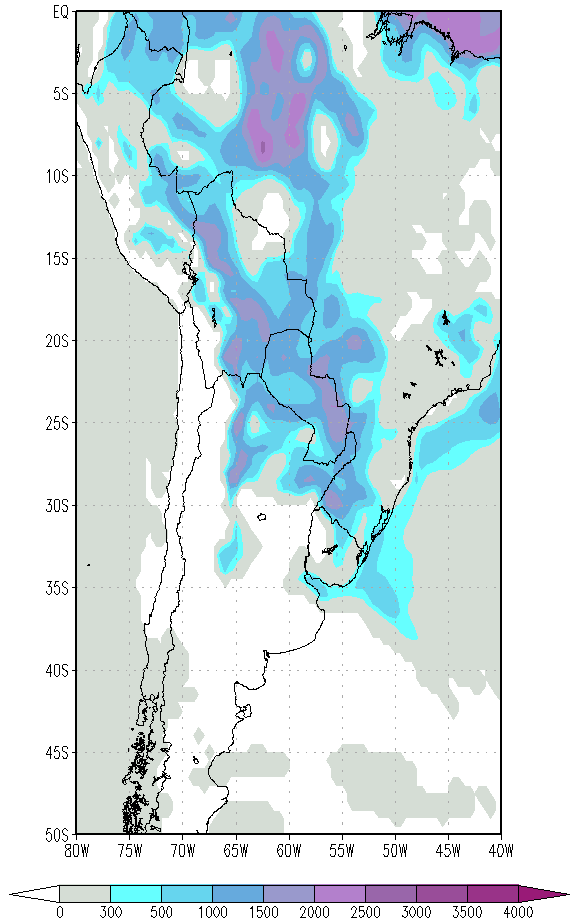
CAPE - Convective available potential energy (J/kg) on 9 November 2008 at 06:00 UTC.
|
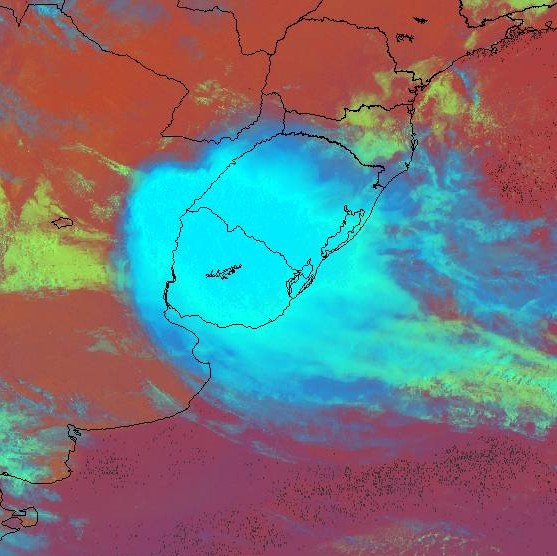
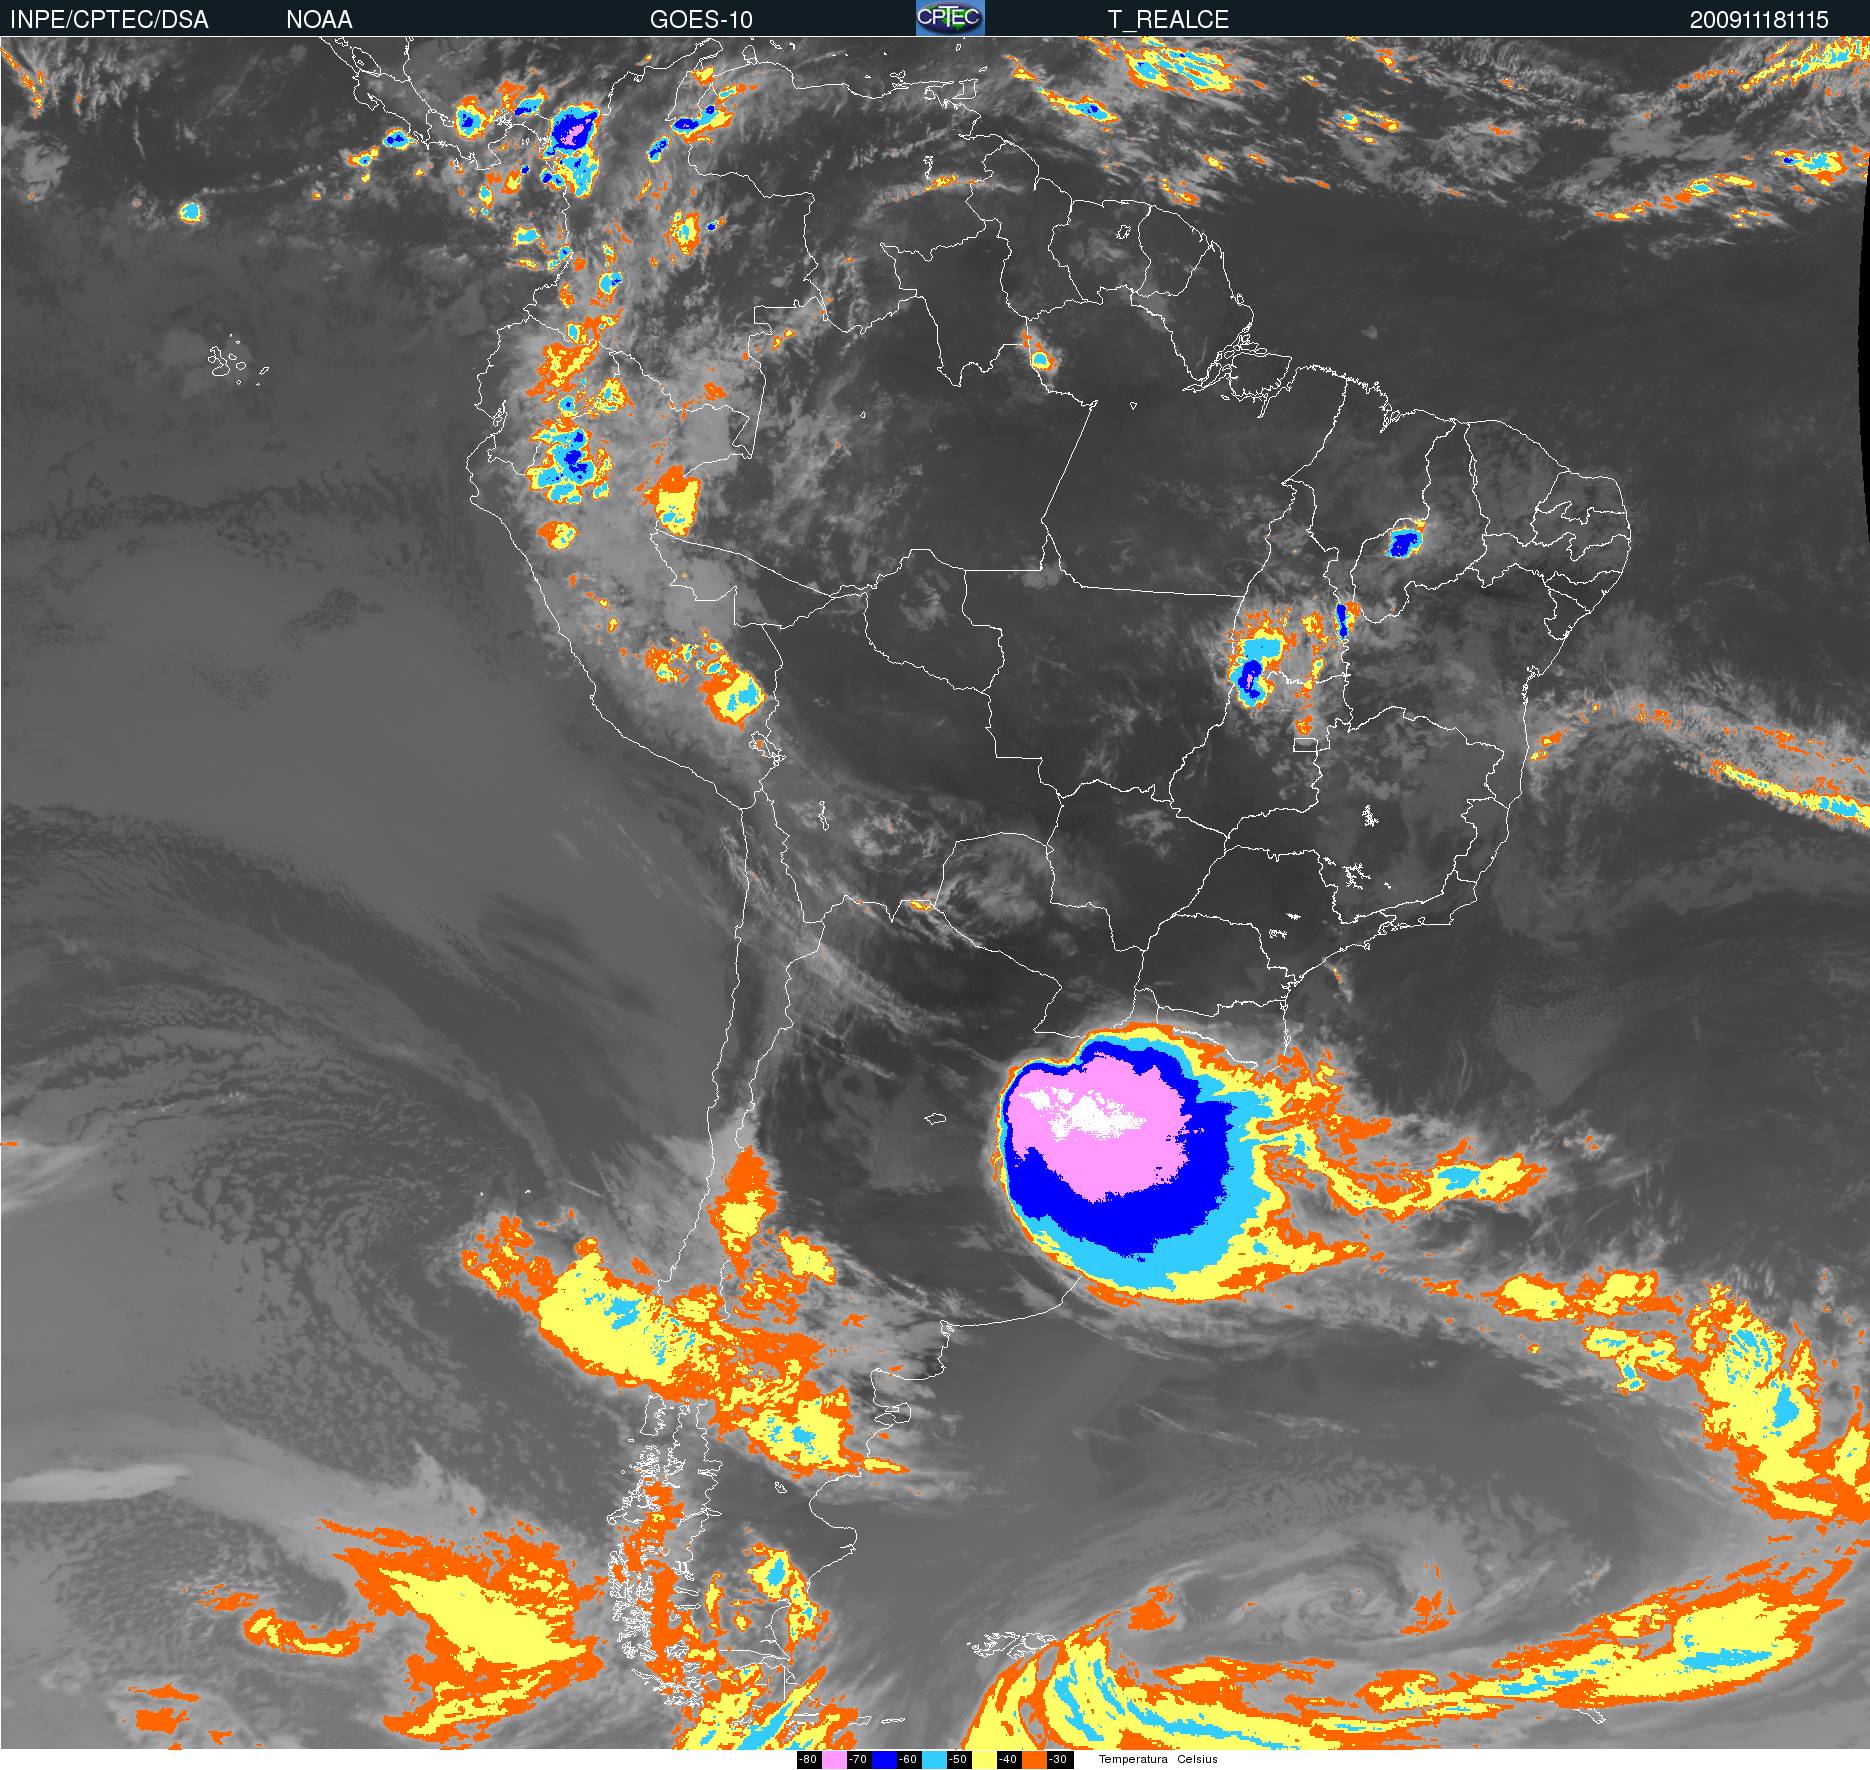
Enhanced infrared image from GOES 10 on 9 November 2008 at 06:00 UTC.
|
|
|
| Divergence and isotachs - 200hPa | Streamlines and isotachs at 200 hPa |
|
Divergence (10-5 s-1) and isotachs at 200 hPa.
|
Streamlines (blue) and isotachs (yellow) at 200 hPa, presented together with LLJ (red).
|
|
|