Cloud Structure In Satellite Images
The identification and analysis of mescoscale convective complexes (MCC) can be done by combining satellite images from different channels. RGB combinations, such as from MSG, are useful in the interpretation of convective systems. MSG's field of view over western South America is limited, but RGBs on the eastern coast of South America and Brazil are very useful. An example of this use is shown for South Atlantic Convergence Zone (SACZ). It is also possible to analyze many aspects with the help of geostationary satellite such as GOES.
The channels from GOES Imager are presented in the table below:
| Channel Number | Wavelength Range (μm) | Range of Measurement | Meteorological Objective |
|---|---|---|---|
| 1 | 0.52 to 0.71 | 0 to 100% albedo | Cloud cover |
| 2 | 3.73 to 4.07 | 4 to 335K | Nighttime clouds |
| 3 | 13.00 to 13.70 | 4 to 320K | Cloud cover and height |
| 4 | 10.20 to 11.20 | 4 to 320K | Sea surface temperature and water vapor |
| 5 | 5.80 to 7.30 | 4 to 320K | Water Vapor |
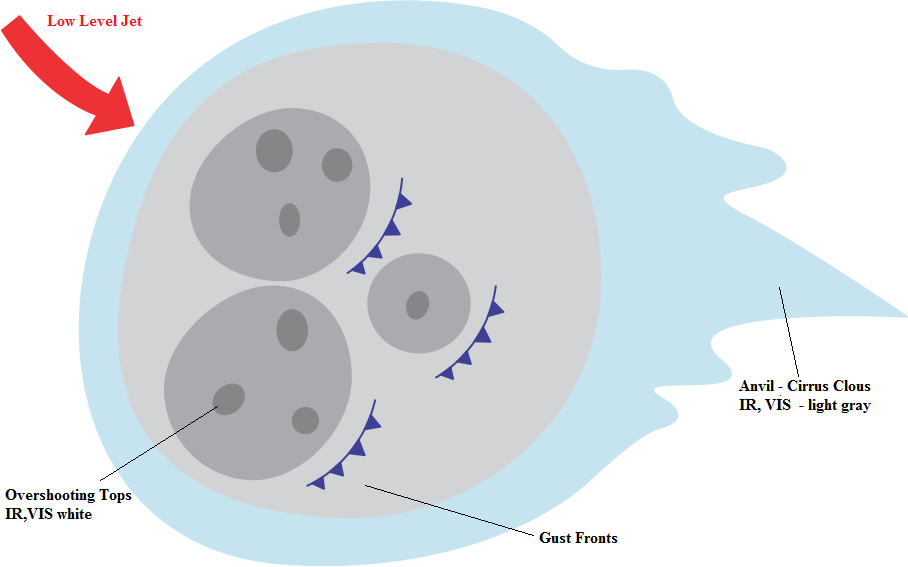
Features often associated with MCCs in satellite images:
- 1. Mesoscale convective complexes (MCC):
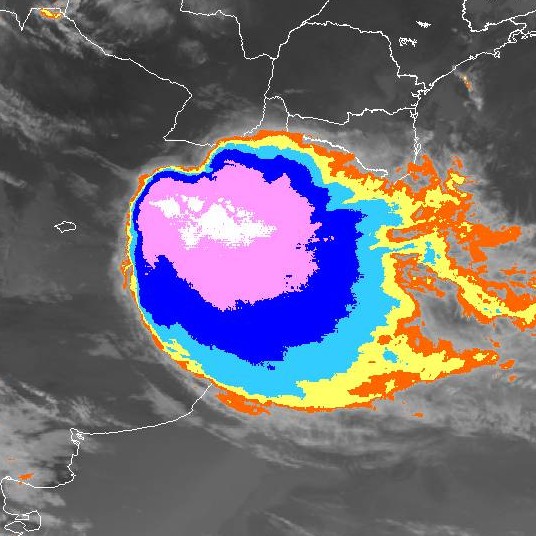
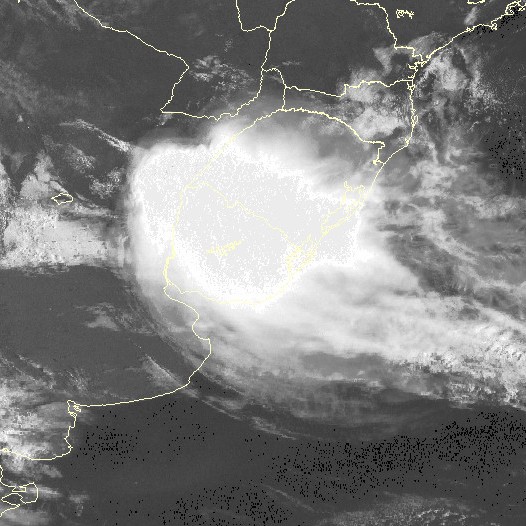
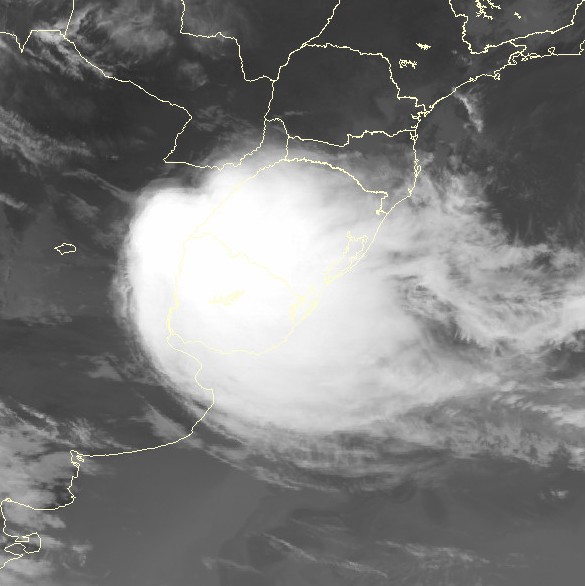
these systems are organized clusters of deep convective clouds. They typically have a circular shape and cover an extensive area. They have a low brightness temperature and a high temperature gradient at the edges, which are visible in enhanced IR imagery. Due to deep convection, MCC have bright cold cloud tops in IR and WV and high albedo in VIS images. VIS images often reveal overshooting tops in the MCC, which, when seen in combination with enhanced IR images, makes it possible to identify the most convective and active parts of the MCC. - 2. Connection with low-level jets (LLJ):
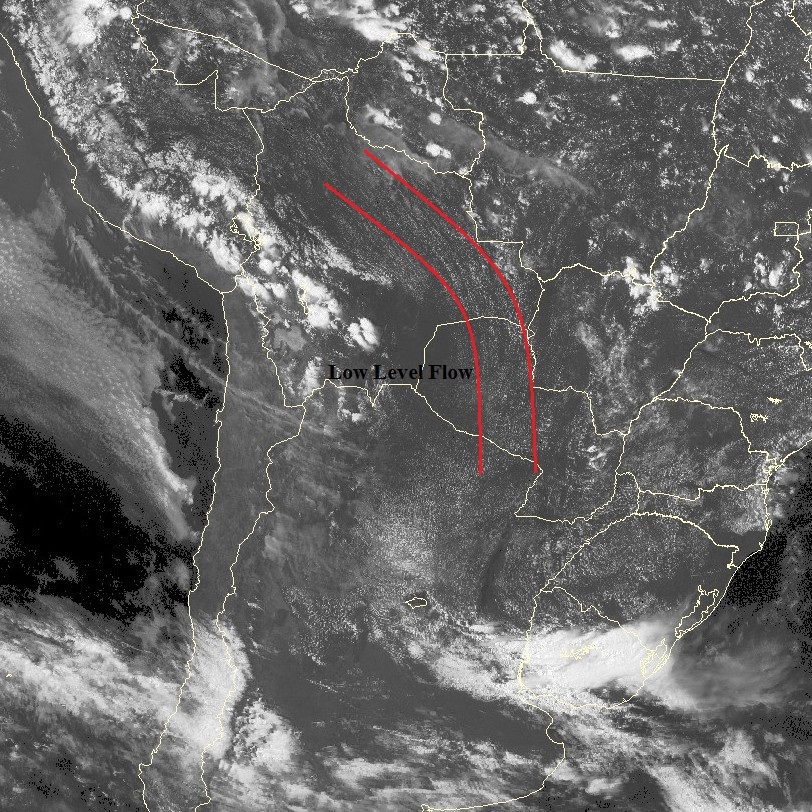
MCC are generally accompanied by a LLJ. The presence of a LLJ can be seen in VIS images on the day (or hours) before the MCC forms. As explained in the SALLJ conceptual models made by CoE Argentina, there are cloud streets organized into lines parallel to the low-level wind resulting from convective rolls within SALLJ.
|
17 November 2009, 18:00 UTC - GOES 10 - Channel 1 (0.65 μm) Visible Image - SALLJ identification.
|
18 November 2009, 11:15 UTC - GOES 10 - Channel 4 (11.0 μm) Enhanced IR image.
|
|
|
|
18 November 2009, 11:15 UTC - GOES 10 - Channel 1 (0.65 μm) Visible image.
|
18 November 2009, 11:15 UTC - GOES 10 - Channel 5 (6.0 μm) WV image.
|
|
|
|
General Schematic MCC Top View
|
|
The loop shows the development of a MCC that took place from the night of 9 November until late afternoon on 10 November, 2008. During its initial stages, the development of the MCC is mainly caused by the presence of an intense LLJ. In its later stages, organized deep convection moves northward due to an approaching cold front.

|
Press "Play Button" for 9 November 2008, 14:21 UTC GOES 10 11.0 enhanced infrared loop image. 
|
MCC features using TRMM
Using the multiple-sensor satellite products of TRMM (Tropical Rainfall Measuring Mission), it is possible to analyze important features of convective systems. Due to the temporal resolution of TRMM, this product can be used for complementary diagnostic analysis, but not for operational use.
The following example is from a MCC that occurred on 9 November 2008 over northern Argentina and Paraguay.
An overpassing satellite detected a MCC in its dissipation stage. The MCC maturation occurred around 09:45 UTC and the satellite overpass over the area took place at 14:21 UTC. Nevertheless, intense convective activity was still present.
It is possible to analyze the reflectivity from the PR on board the TRMM. Reflectivity (designated by the letter Z) is the amount of transmitted power returning to the radar. It covers a wide range of signals. The dBZ values (decibels of Z) increase as the strength of the signal received by the radar increases.
The scale of dBZ values is related to the intensity of rainfall. Typically, dBZ values of 20 signify light rain, and the higher the dBZ, the stronger the rainfall.
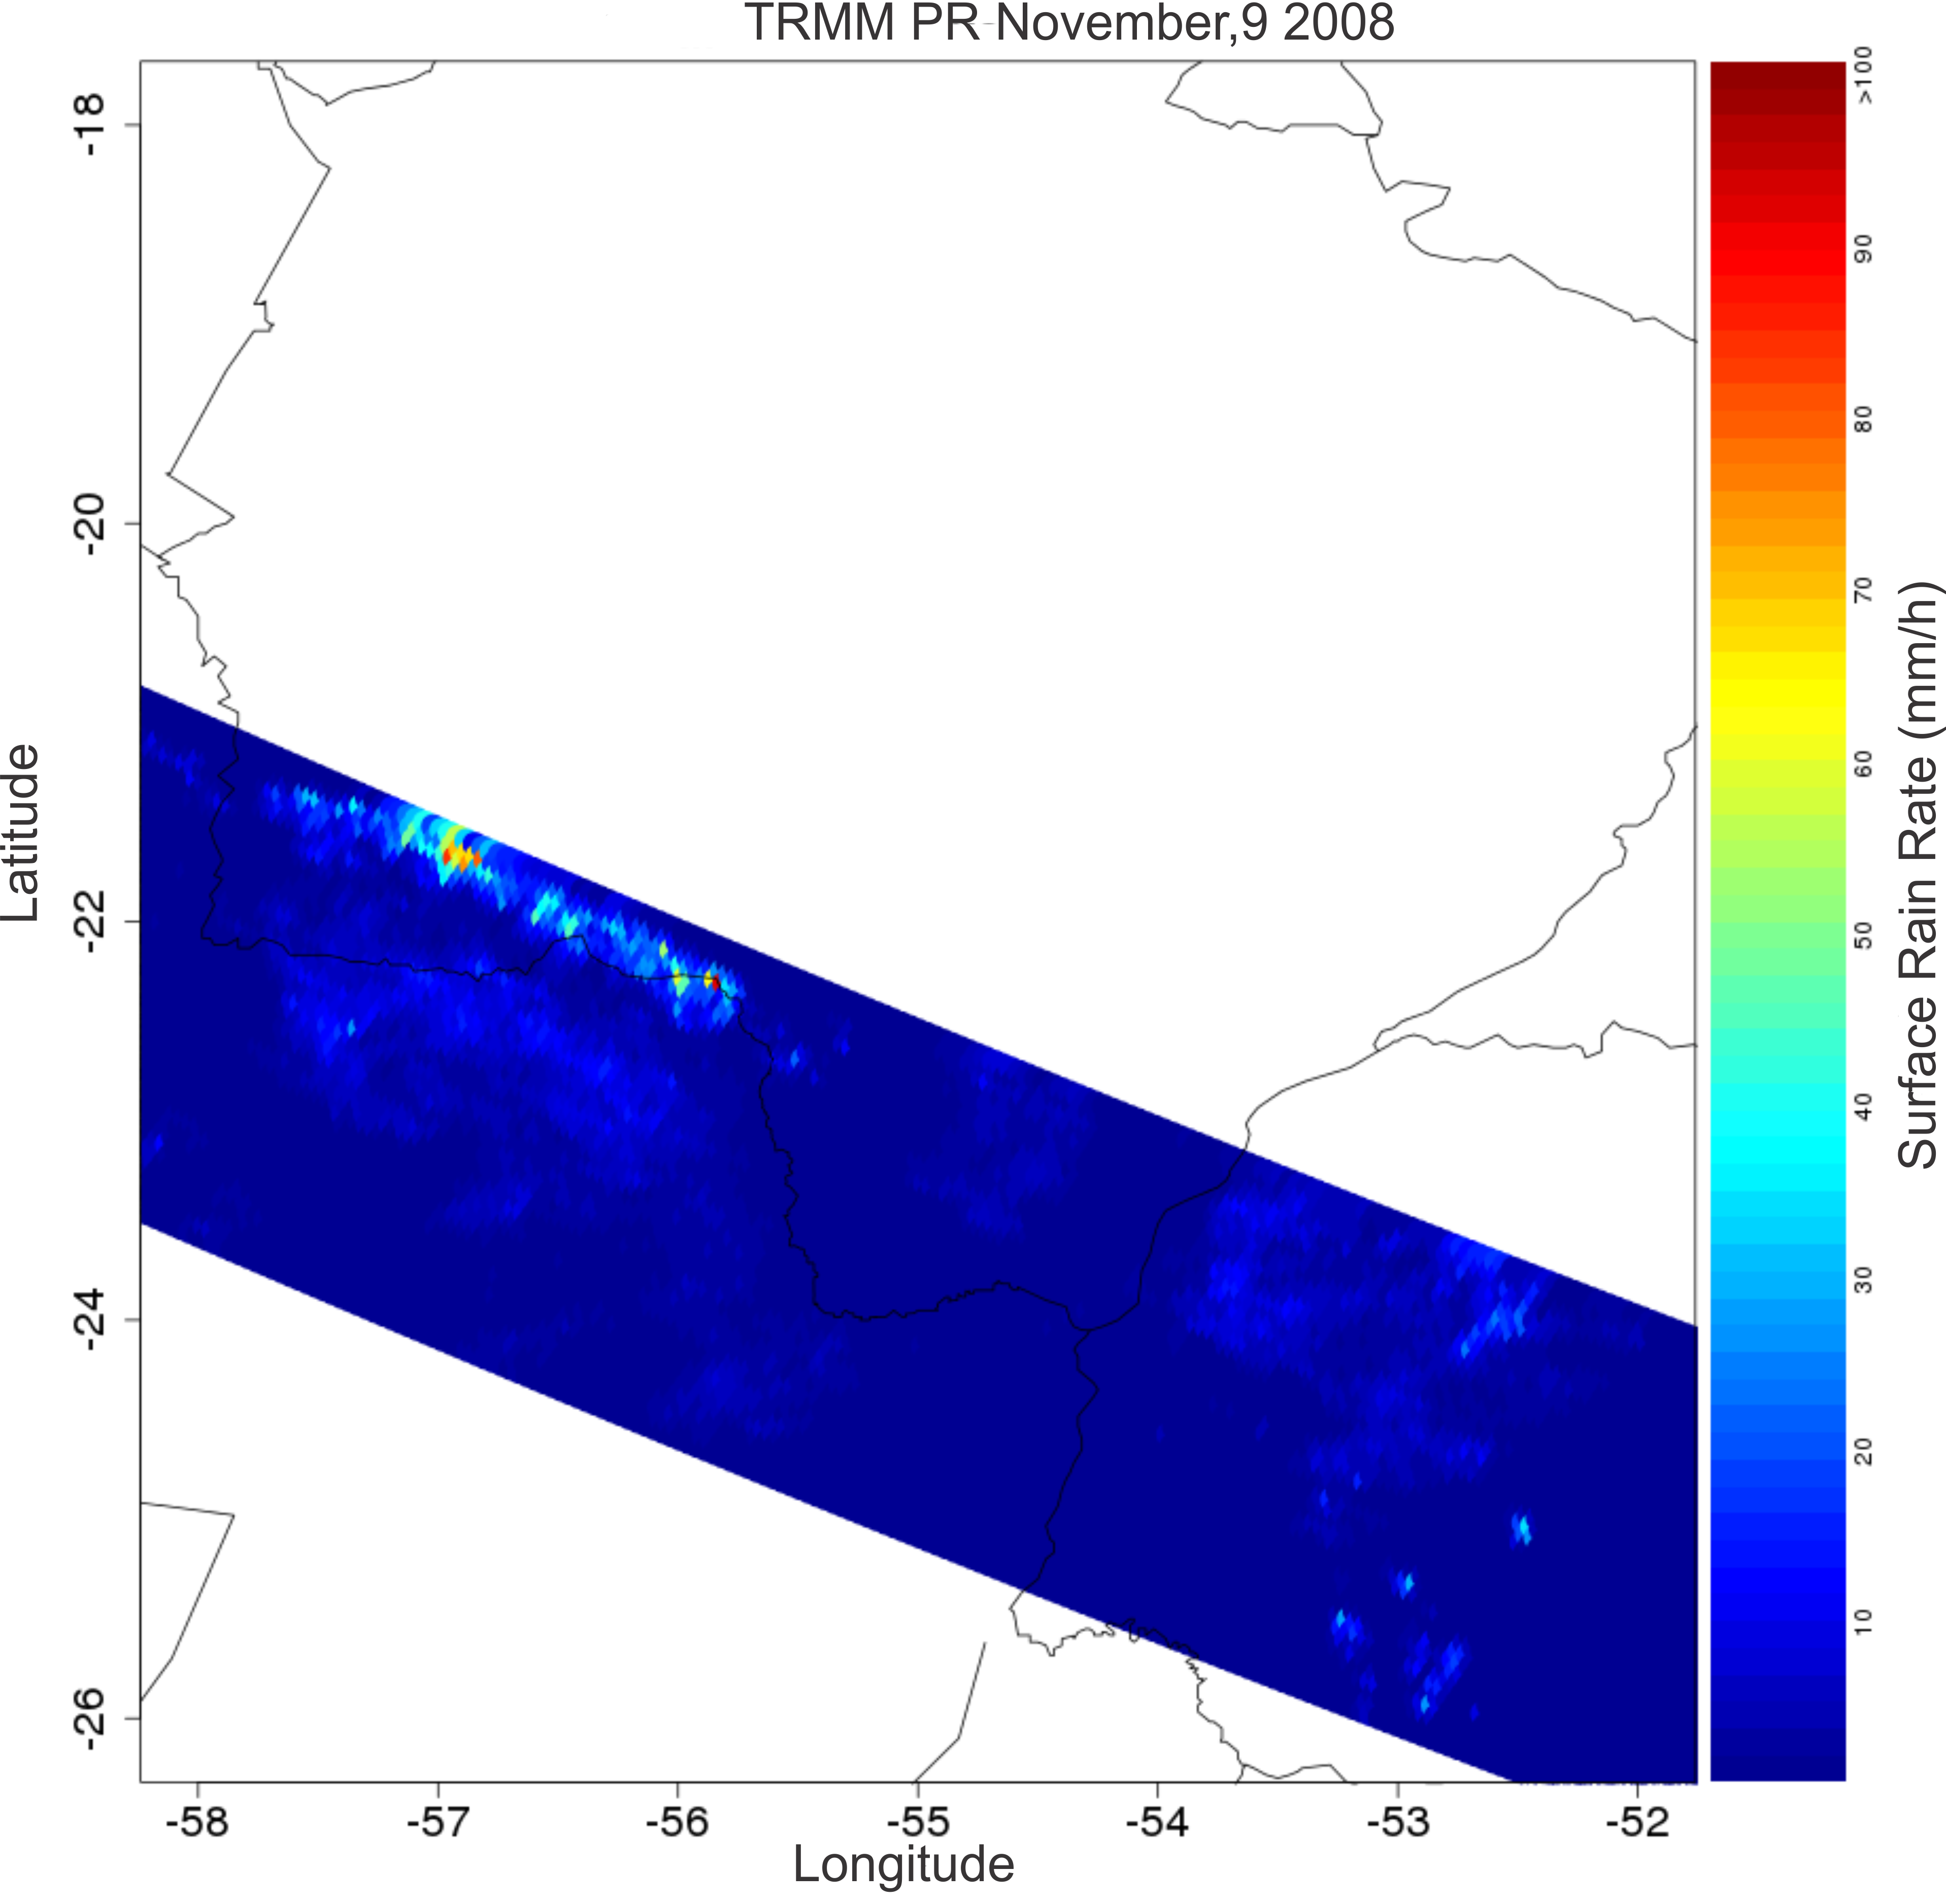
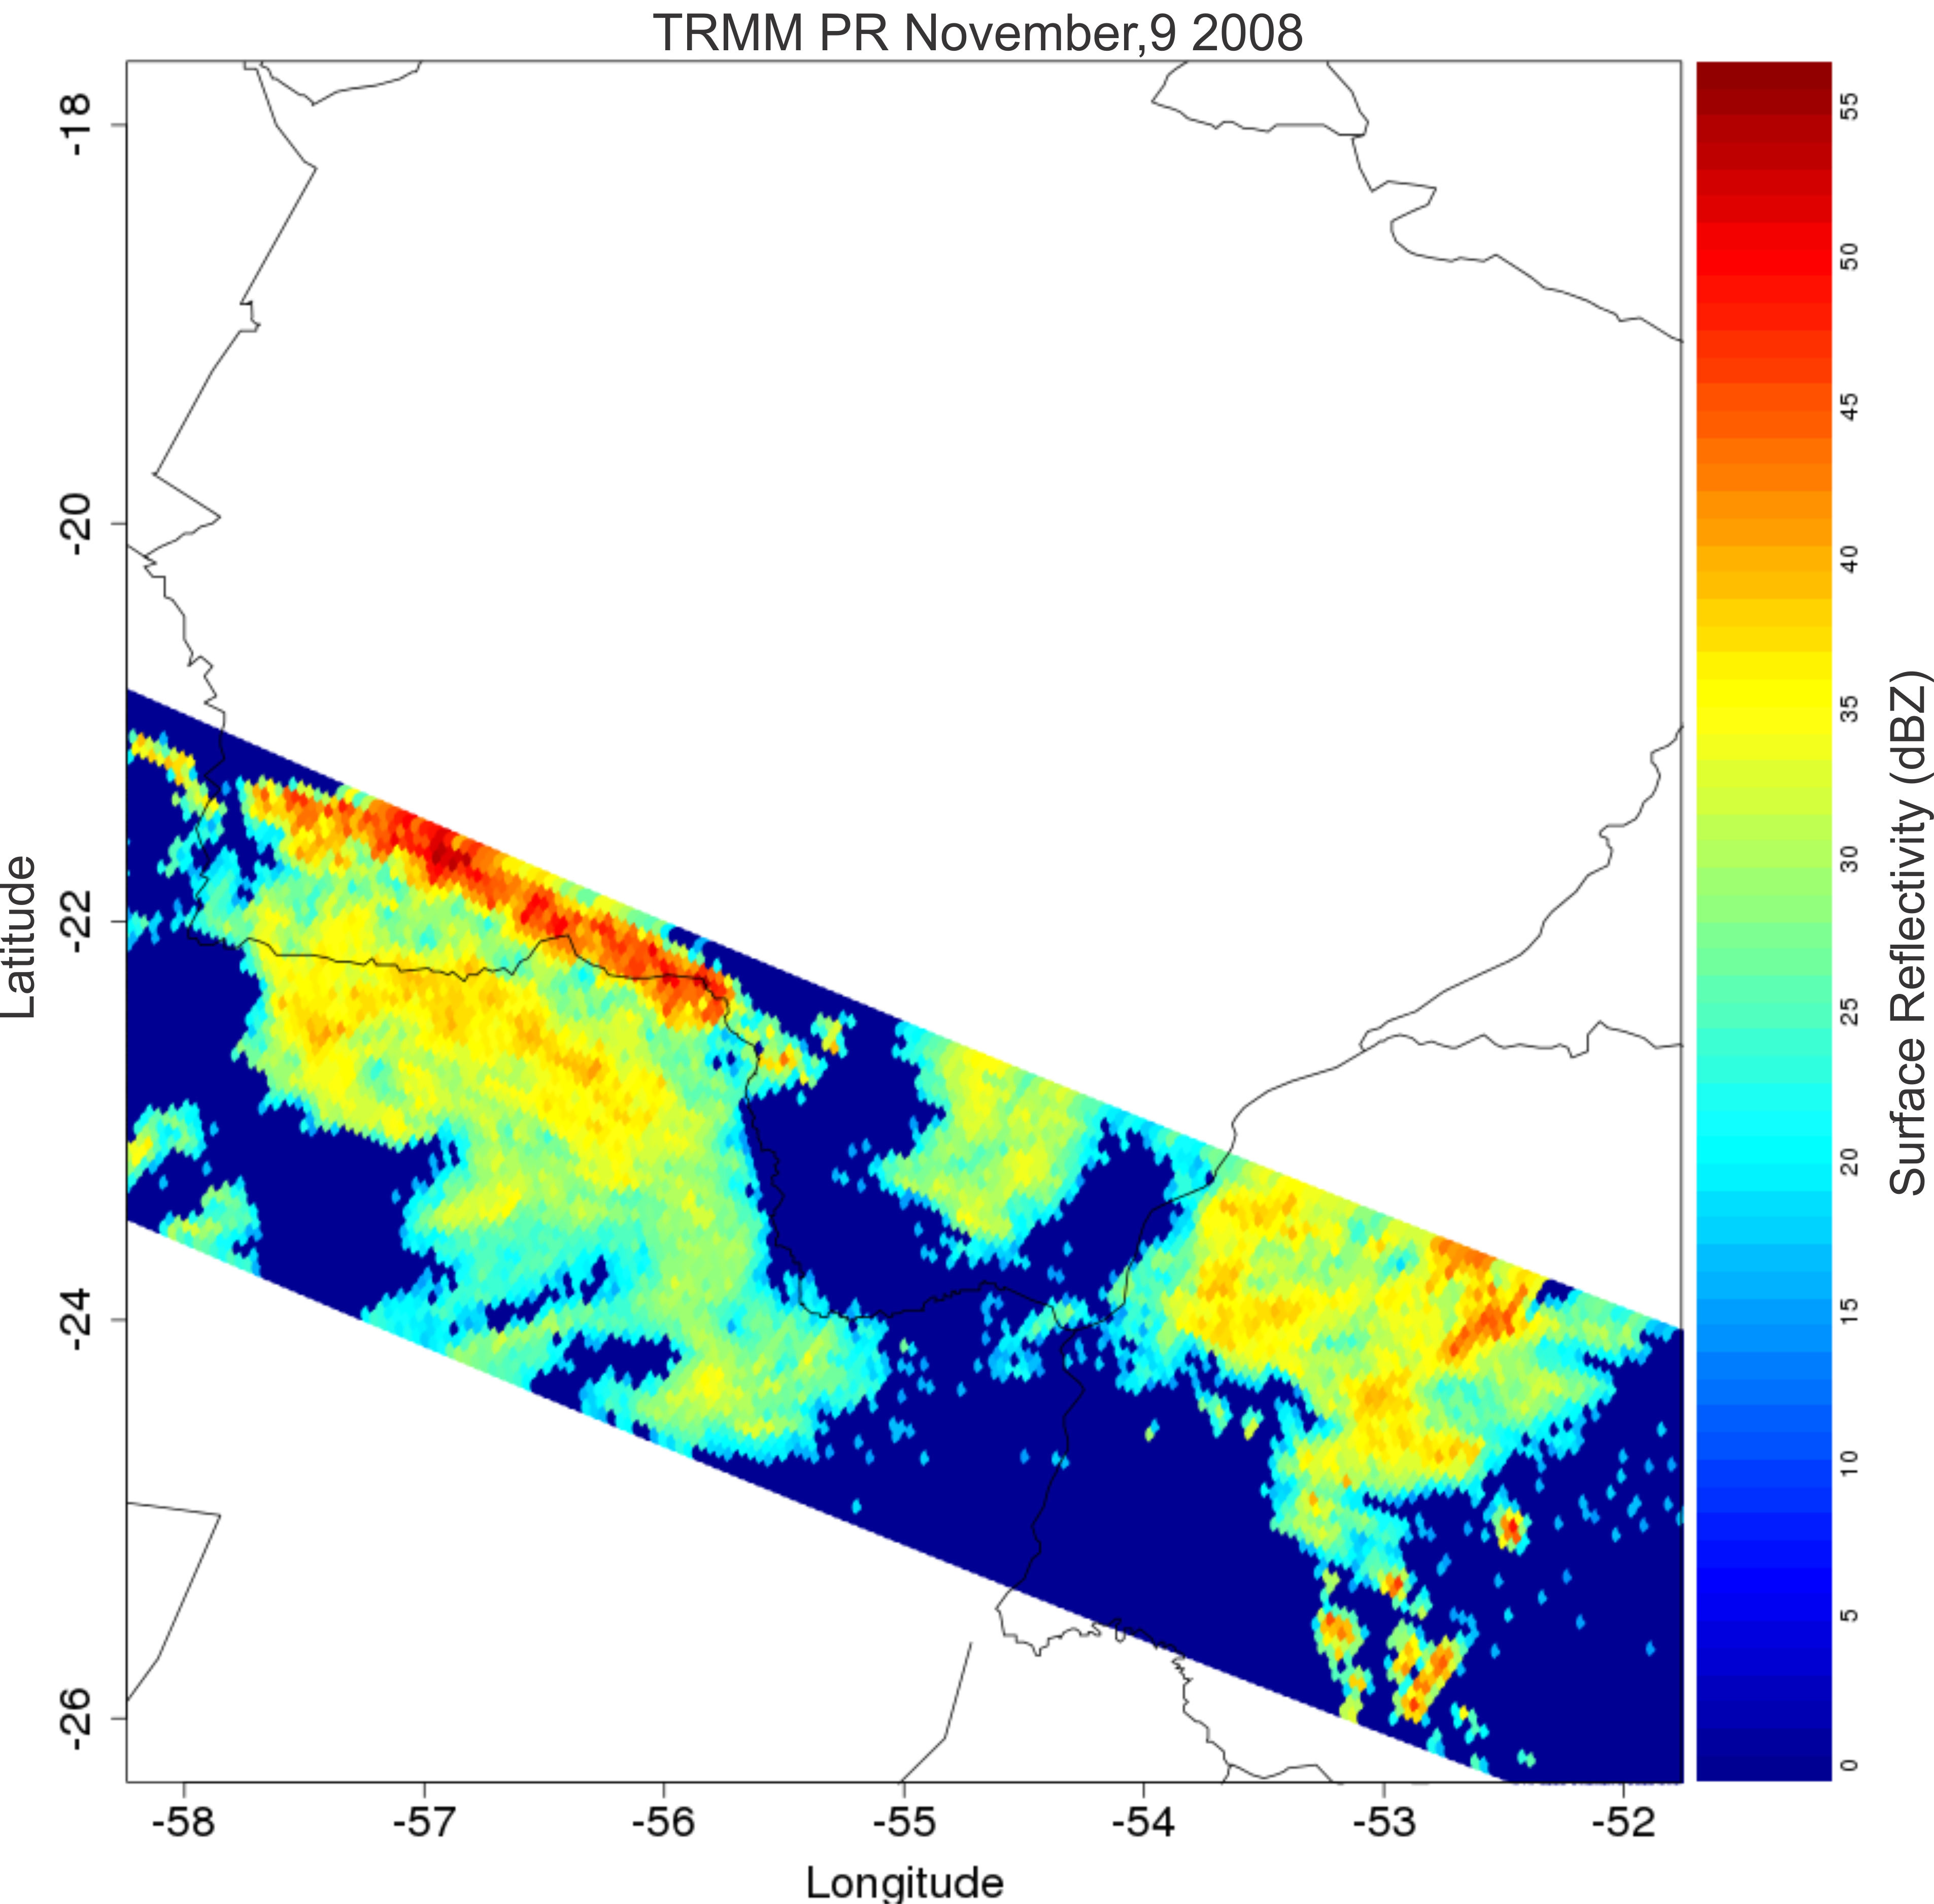
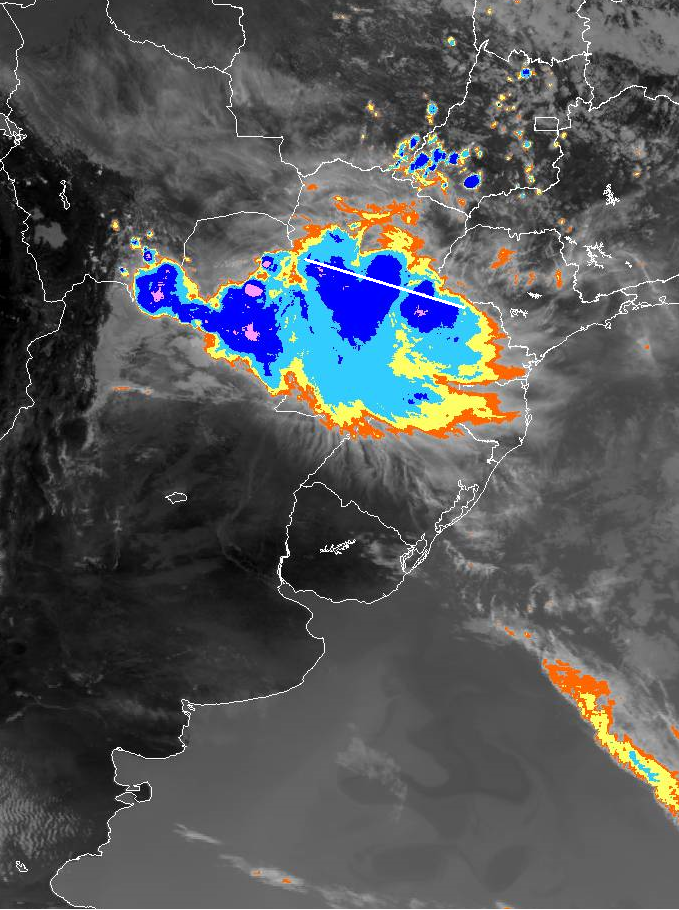
Rain rates of 40 mm/h were observed over the northern part of the satellite swath. By analyzing surface reflectivity, cloud coverage and the presumed distribution of particles within the cloud, the cluster can be seen clearly. The cluster has reflectivity values ranging from 20 dBZ in the southern parts to 35 dBZ in the middle and 50 dBZ in the north.
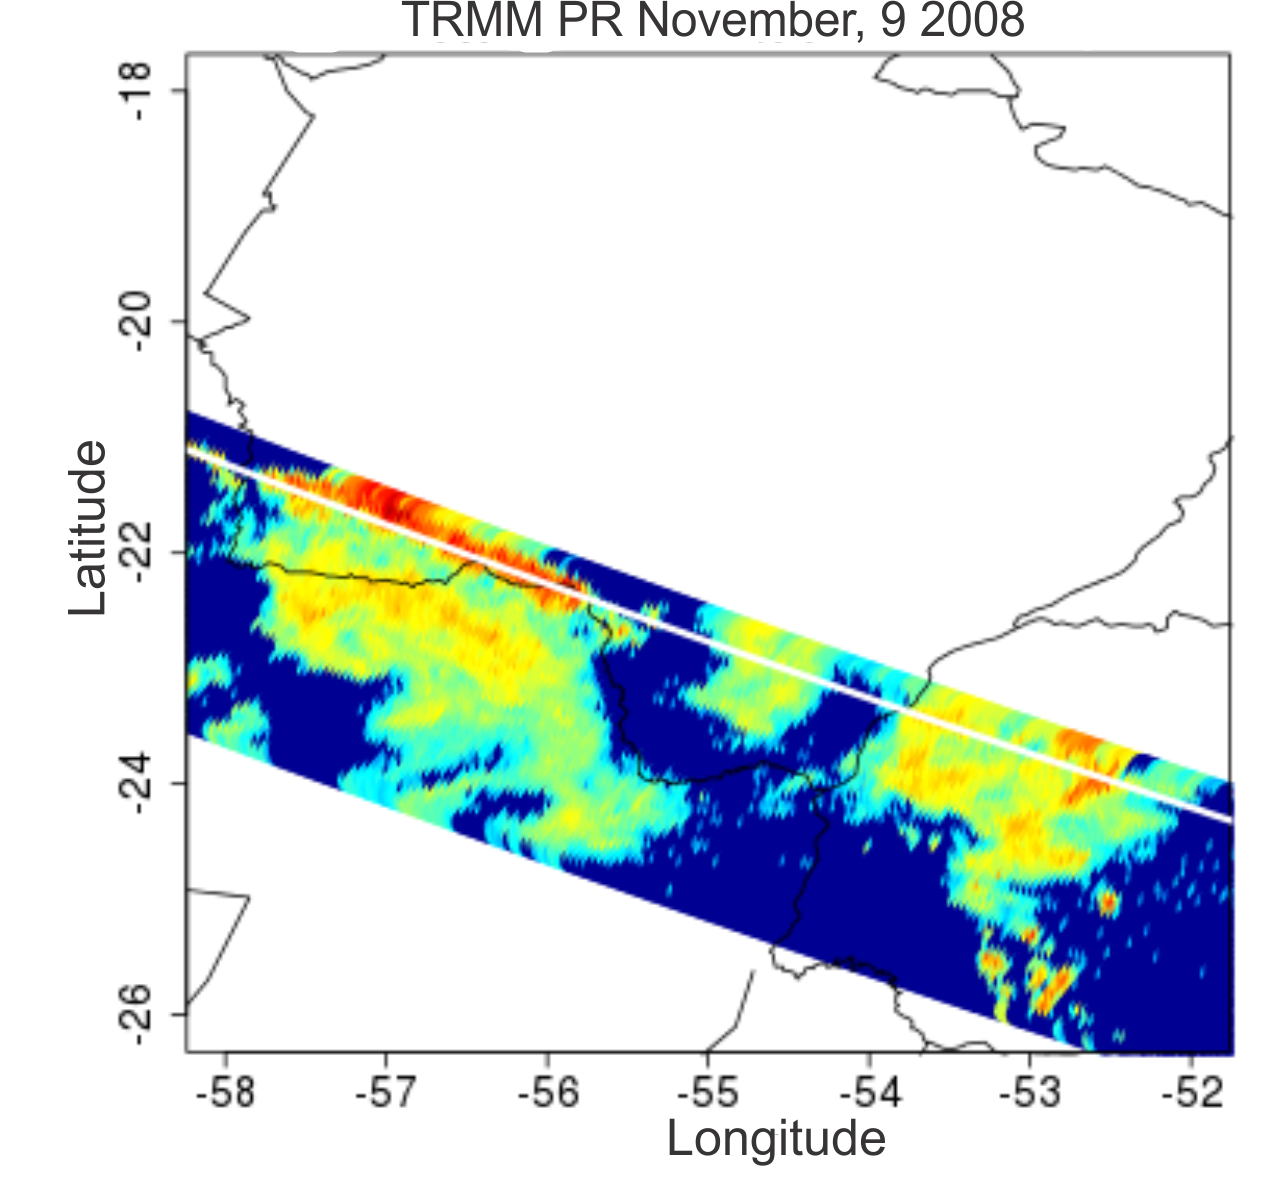
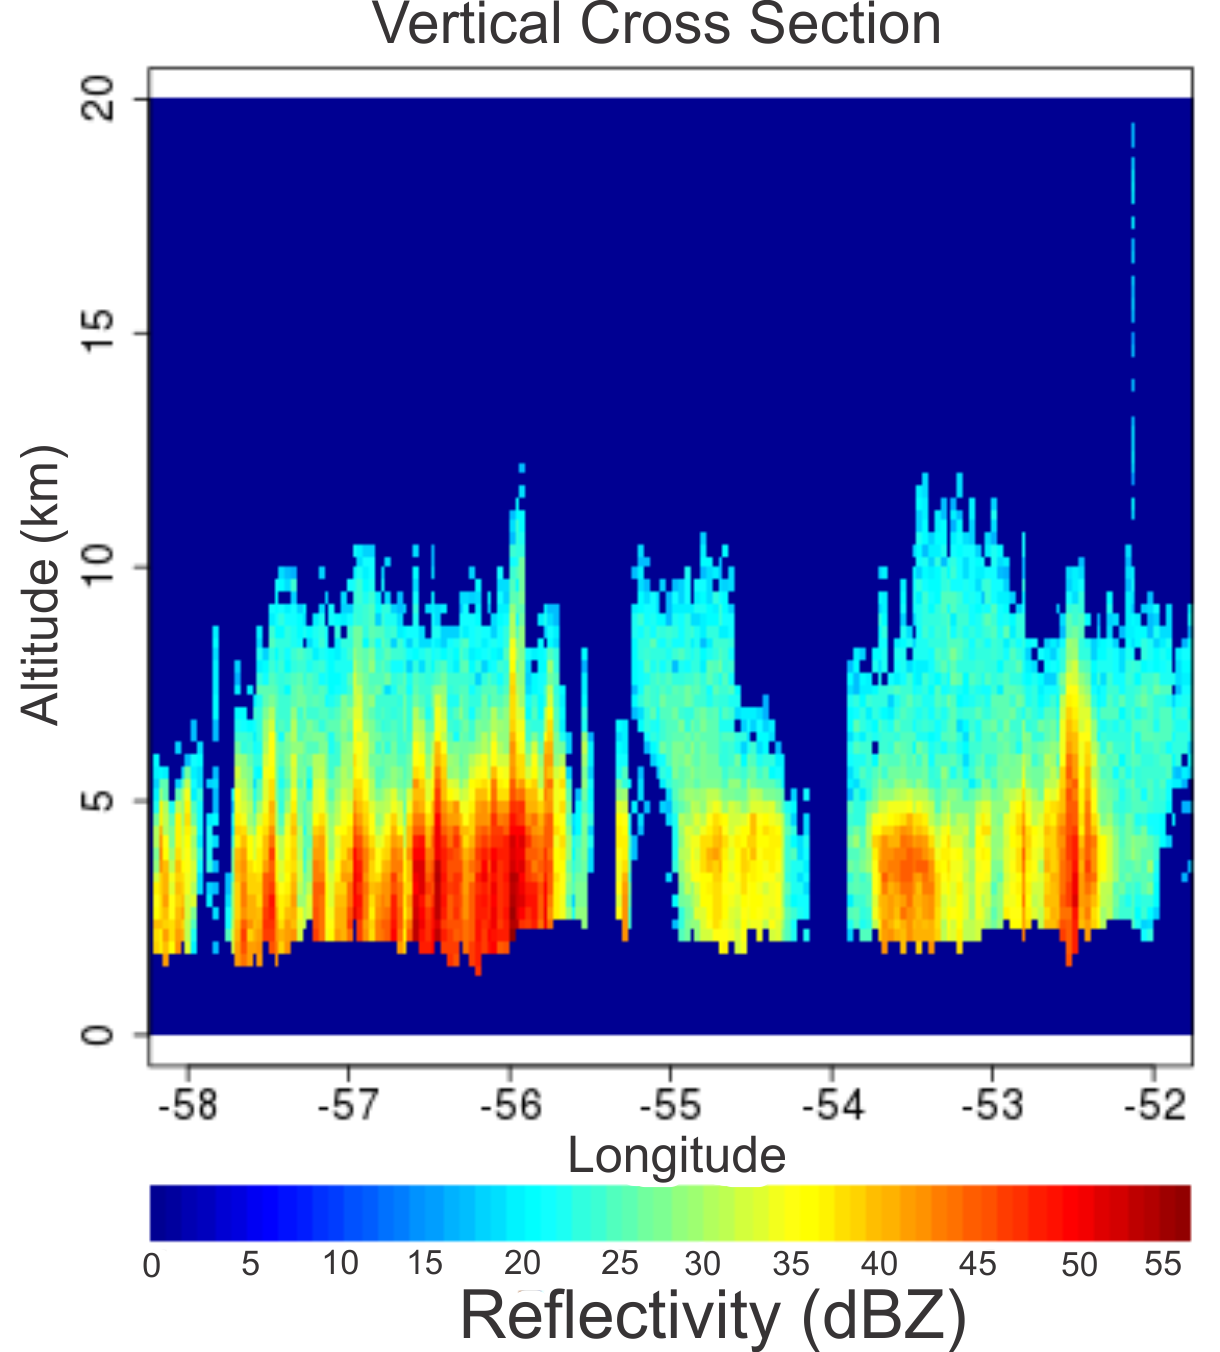
Of the next four images, the lower right image shows the vertical cross section along the white line drawn in the lower left image. From this vertical profile it can be seen that convection extends approximately from 2 km up to 10 km.
|
November, 9 2008 14:21 UTC - TRMM-PR - Surface rain rate (mm/h).
|
November, 9 2008 14:21 UTC - TRMM-PR - Surface reflectivity (dBZ).
|
|
|
|
November, 9 2008 14:21 UTC - TRMM-PR - White line indicates vertical cross section.
|
November, 9 2008 14:21 UTC - TRMM-PR - Vertical cross section of reflectivity (dBZ).
|
|
|
There are three distinct cells within the cluster. The cell on left has reflectivity values that reach 55 dBZ. The cell in the middle exhibits values of 35 dBZ, and the cell on the right has convection with values between 35 dBZ and 50 dBZ.
|
November, 9 2008 14:15 UTC - GOES-10 - Channel 4 (11.0 μm) Enhanced IR, white line indicates the vertical cross section.
|
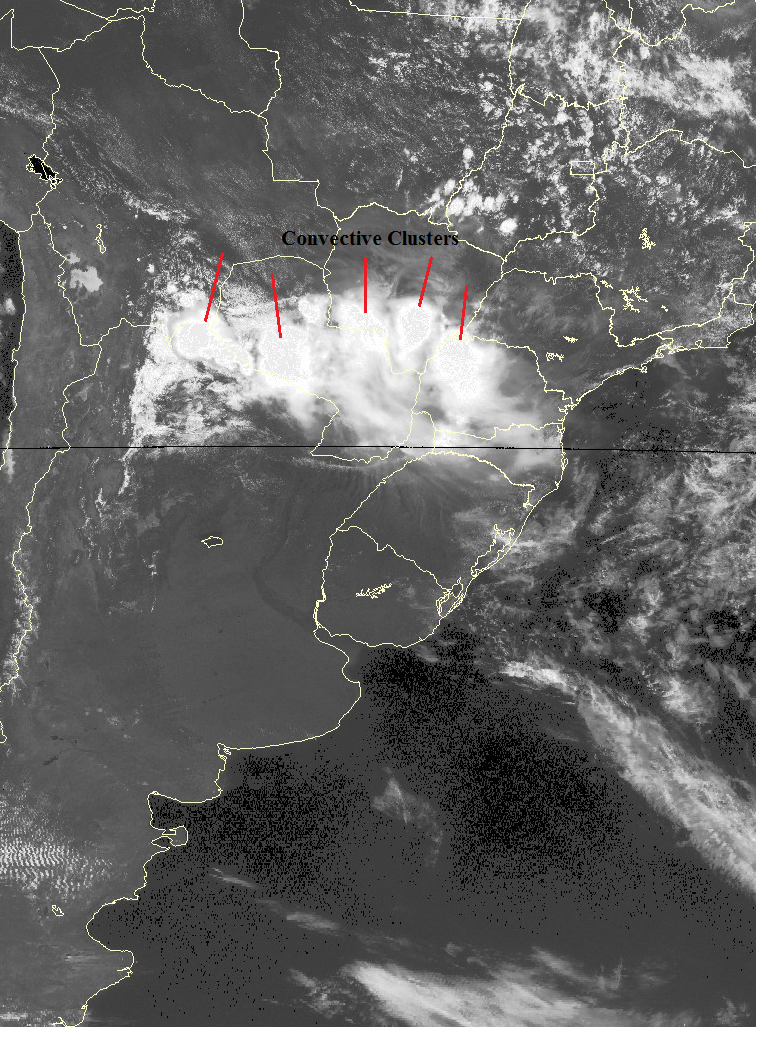
November, 9 2008 14:15 UTC - GOES-10 - Channel 1 (0.65 μm) Cloud clusters in the visible channel.
|
|
|
|
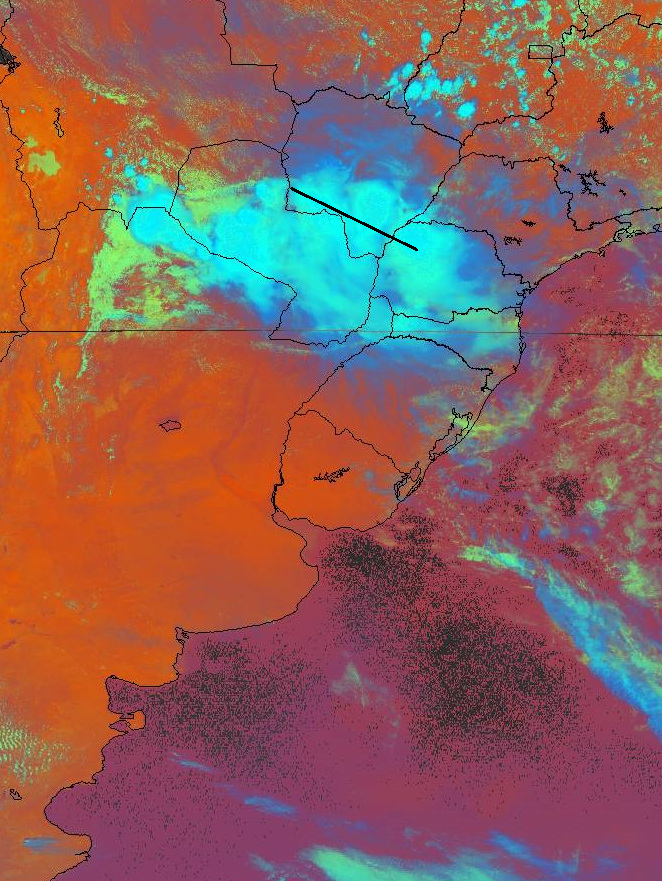
November, 9 2008 14:15 UTC - GOES-10 - RGB image, black line indicates the vertical cross section.
|
|
|