Chapter III: Examples
Examples
Two recent European air quality events are selected for this training module. A Sahara dust event in March 2022 in southern Europe is first presented, followed by a 2019 Po Valley air pollution event.
3.1. Recent Sahara dust event: south-western Europe 15-22 March 2022
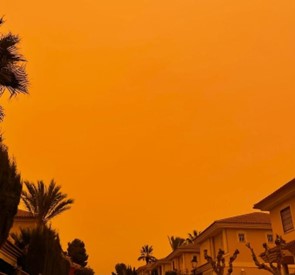
Saharan dust is a mixture of sand and dust from the Sahara Desert region that covers most of North Africa. Dust particles lead to higher particulate matter concentrations in the atmosphere, and therefore to a decrease in air quality. From 15 to 22 March 2022, a large part of western, central, and northern Europe, from Spain to Scandinavia, was affected by a Sahara dust outbreak. Historic amounts of Saharan dust spread into south-western parts of Europe, giving the skies and snow an almost apocalyptic appearance (see Figure 3.1).
The plume was driven by an atmospheric river arising from storm Celia, which brought strong winds, rain, and snow to the Canary Islands. Atmospheric rivers, normally associated with extreme moisture, can also carry Saharan dust. Such events are the result of specific meteorological patterns that favour persistent northward long-range transport (EUMETSAT, 2022).
Figure 3.1: Orange sky in the city of Murcia (south-eastern Spain) due to the Sahara dust storm on 15 March 22.
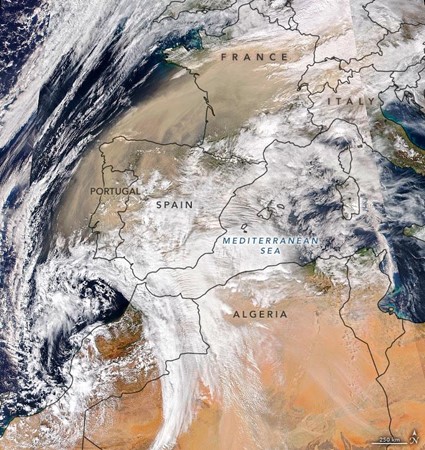
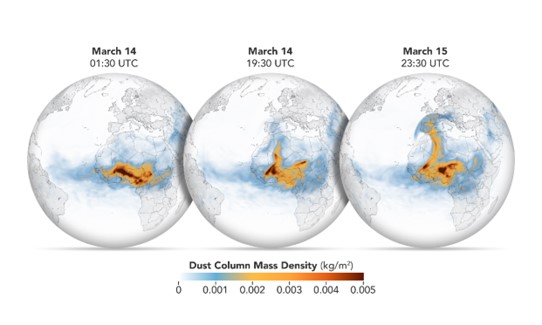
A significant amount of Saharan dust was lifted from the deserts of northern Africa, and gradually spread first over the Mediterranean, and then to central Europe and the Alps (Figure 3.2). Subsequently, the Saharan dust was pushed across the Balkans into south-eastern Europe. Figure 3.3 shows a simulation from the GEOS-5 model showing the Sahara dust plume transport across North Africa and into Europe, giving an indication of how fast the transport of the Saharan dust to Europe was.
Figure 3.2: Image of the Visible Infrared Imaging Radiometer Suite (VIIRS) on the NOAA-20 spacecraft on 15 March 2022. (NASA Earth Observatory).
Figure 3.3: GEOS-5 model Saharan dust plumes blowing across North Africa and into Europe on 14 and 15 March 2022. (NASA Earth Observatory).
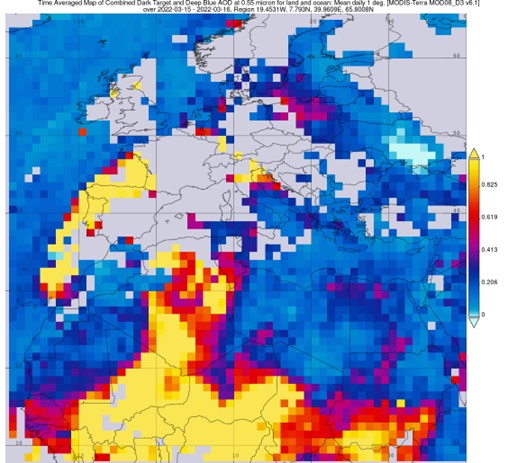
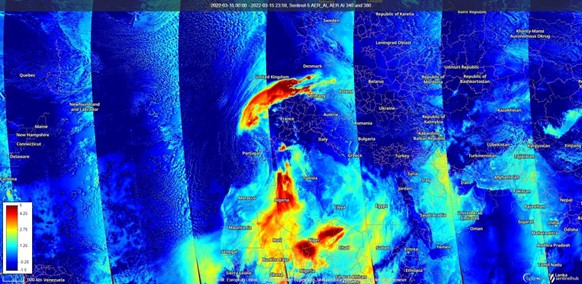
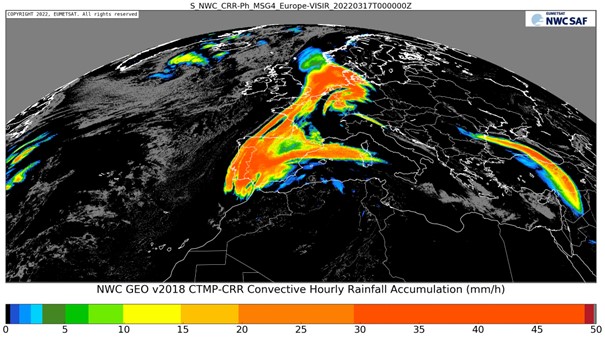
Storm Celia (Figure 3.4) caused precipitation over Spain (Figure 3.5), washing out the Saharan dust particles that were suspended in the air. This caused dust deposits to fall and cover cars, houses, and roads.
Figure 3.4: MODIS AOD (top) and TROPOMI Aerosol Index (bottom) during the Sahara dust event on 15 March 2022 (NASA, Sentinel hub).
Figure 3.5: Convective hourly rainfall accumulation (mm/hour, 17 March 2022) from EUMETSAT, Nowcasting SAF from Meteosat Second Generation (EUMETSAT).
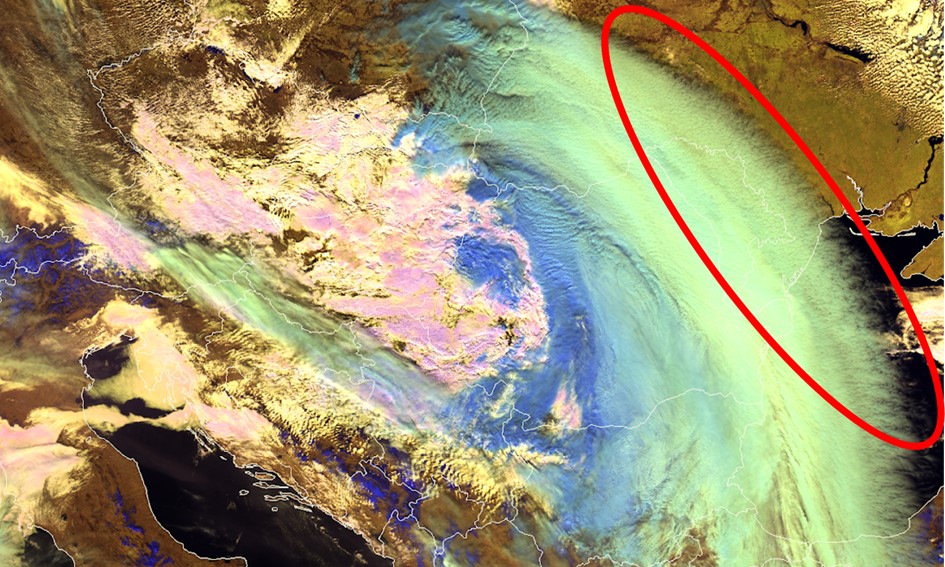
Saharan dust plumes are not uncommon in Europe; they are usually caused by storm systems moving into an area where the strong winds are able to lift the dust up across a large region. Less common is the occurrence of a dust-infused baroclinic storm (DIBS) cloud as was the case for this event: dust acted as nucleation particles for ice, initiating the formation of dust-infused cirrus clouds. The Cloud Phase RGB in Figure 3.6 shows these icy (cirrus) pockmarked clouds permeated with Saharan dust. This VIIRS image is an example of how the 'next generation' RGBs (also available with the future MTG FCI instrument) can observe DIBS (EUMETSAT, 2020).
Figure 3.6: VIIRS Cloud Phase RGB for 16 March 2022 at 11:21 UTC showing a Saharan dust-infused baroclinic storm (DIBS; indicated by the red ellipse) cloud (Putsay).
Saharan dust has several impacts in the populated areas of Europe, on, for example, flight security, air quality, and solar radiation. During this event, there were several reports of red/orange skies, the effect of dust dimming the solar radiation, and dust deposits across Europe, including on snow in the Alps, associated with record concentrations of atmospheric aerosol measured by the Spanish air quality network.
In most of Europe (central and northern areas), no adverse health effects can be expected from Saharan dust directly: as it travels at high altitudes there is generally no effect on surface PM concentrations. Only at a local scale, when the wind resuspends deposited dust, can dust particles be inhaled. However, in the south of Spain, Saharan dust does sometimes arrive at breathing height (for example during the event described here), strongly affecting the air quality.
This event led to record concentrations of Saharan dust at ground level, especially in Spain, as documented by the air quality network and reported by the WMO Barcelona Dust Regional Center. PM10 concentration recordings were historically high and at some measurement stations they exceeded average concentrations of 1,700 µg/m3 (some stations stopped recording above 1,000 µg/m3). The average daily exposure considered safe by the WHO is < 45 µg/m3; therefore, the population (especially at-risk groups and children) were recommended to stay at home, close windows and spend the minimum time possible outside. The Sahara dust concentrations arriving above central Europe were lower, mainly due to the transport and mixing; nevertheless, dust deposition was observed on surfaces.
Question 12
How was the Saharan dust transported to Europe during the Sahara dust event of 15-22 March 2022?
Question 13
Why does the Saharan dust usually not cause any health effects in central Europe?
For more training on dust, see EUMETSAT Dust Trainhub.
3.2. Air pollution event: Po valley, February 2019
The terrain and latitude of the Po valley make it prone to frequent pollution episodes, especially during winter when inversions can be strong. Its topographic and meteorological conditions generally limit the dispersion of pollutants (Figure 3.7).
Figure 3.7: Panoramic view of the main valley over the Aosta-Saint-Christophe station during a pollution advection event. The picture was taken from Croce di Fana (2200 m a.s.l., Quart village, 6 km northeast of Aosta-Saint-Christophe) on 21 October 2017 (Diémoz et al., 2019).
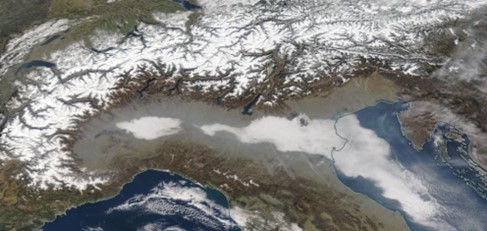
As an example of an air pollution event in the Po valley, a nitrogen dioxide air pollution episode starting on 15 February 2019, is presented here. Figure 3.8 clearly illustrates that, especially on 21 February, the polluted air was trapped between the Alps and the Apennines.
Figure 3.8: Image for 21 February 2019, from MODIS Terra (corrected reflectance, true colour; NASA Worldview) showing accumulated air pollution (in grey).
During this air pollution event, nitrogen dioxide concentration levels at ground stations were reported to exceed 50 µg m-3. Consequently, minor health effects (irritated airways, coughing, exacerbation of existing lung condition symptoms) caused by this relatively high concentration level of nitrogen dioxide could have occurred. As explained above, since nitrogen dioxide is considered an air quality indicator, levels of other air pollutants were presumably also higher, as well as related health effects. In selected regions, traffic reducing measures were taken for a few days. In the following exercise, you are invited to have a closer look at this event.
Question 14
Which of the resources listed in 3.1 do you think are suitable to use for this air pollution event? (You can select multiple answers).
