Chapter I: Introduction
Introduction
Atmospheric composition can be observed using various instruments (satellite and ground-based) and can be analysed and forecasted using numerical models. This training module provides an overview of available online resources that can be used to assess an air pollution or a Sahara dust event. An air pollution event is defined as a time during which the concentration of atmospheric pollutants exceeds air quality standards. In southern Europe, these also include Sahara dust events, which occur mostly in spring and summer, when south-westerly flow transports desert dust from the areas south of the Atlas Mountain range.
This module consists of four chapters. In this first chapter, the key air pollutants, and their sources and health effects, are introduced. The key air pollutants are nitrogen dioxide (NO2), ozone (O3), carbon monoxide (CO), sulphur dioxide (SO2), and atmospheric aerosol particles, also called particulate matter (PM). Saharan dust and Second Inorganic Aerosols (SIA; formed from ammonia (NH3), nitrogen (di)oxide, and sulphur dioxide) are included in PM. The use of nitrogen dioxide as an air pollution indicator is then described, followed by a selection of the World Health Organization (WHO) and European Union (EU) regulations and standards. Finally, the last section of this chapter focuses on the effect of meteorological conditions on chemical processes and, in a few cases, the other way around. Chapter 2 presents selected online resources of satellite observations and other information resources useful for assessing air quality. Two case studies are investigated in chapter 3: a Sahara dust event in the south of Europe in March 2022, and the 2019 Po Valley air pollution event. The training module concludes with an exercise on the 2019 Po Valley air pollution event.
Note: to limit confusion, the word 'sources' is only used for a physically existing source of atmospheric gases and particles, while the word 'resource' is used for online sources of information.
Aim of this training module:
In this air quality module, you will learn to respond (better) to air pollution and Sahara dust events, by learning which resources to use for these events.
Goals of this training module:
- Describe the health effects of key air pollutants such as particulate matter, ozone, and nitrogen dioxide.
- List the major air pollution sources of particulate matter, ozone, and nitrogen dioxide.
- Interpret satellite and non-satellite air quality resources.
- Explain the effects of Sahara dust events on the weather.
- Identify atmospheric conditions leading to air pollution events.
1.1. Air pollution sources
Air pollution is a critical factor for human health and the terrestrial environment. According to a 2019 WHO estimate, ambient (outdoor) air pollution has caused 4.2 million premature deaths worldwide (WHO, 2022). The risk of adverse health effects depends on a person's health status, the pollutant type and concentration, and the length of exposure to the polluted air. For instance, people with heart or lung diseases, children, and the elderly are considered to be the most vulnerable groups. Figure 1.1, Table 1.1, and the text below provide information on the sources, conditions, and health effects of the following air pollutants: particulate matter, ultrafine particulate matter, ozone, nitrogen dioxide, carbon monoxide, and sulphur dioxide. Particulate matter fractions considered in this module include: inhalable coarse particles (with a diameter of 10 µm or less; PM10), fine particles (with a diameter of 2.5 or 1.0 µm or less; PM2.5, PM1), and ultrafine particles (with a diameter of 100 nm or less; PM0.1).
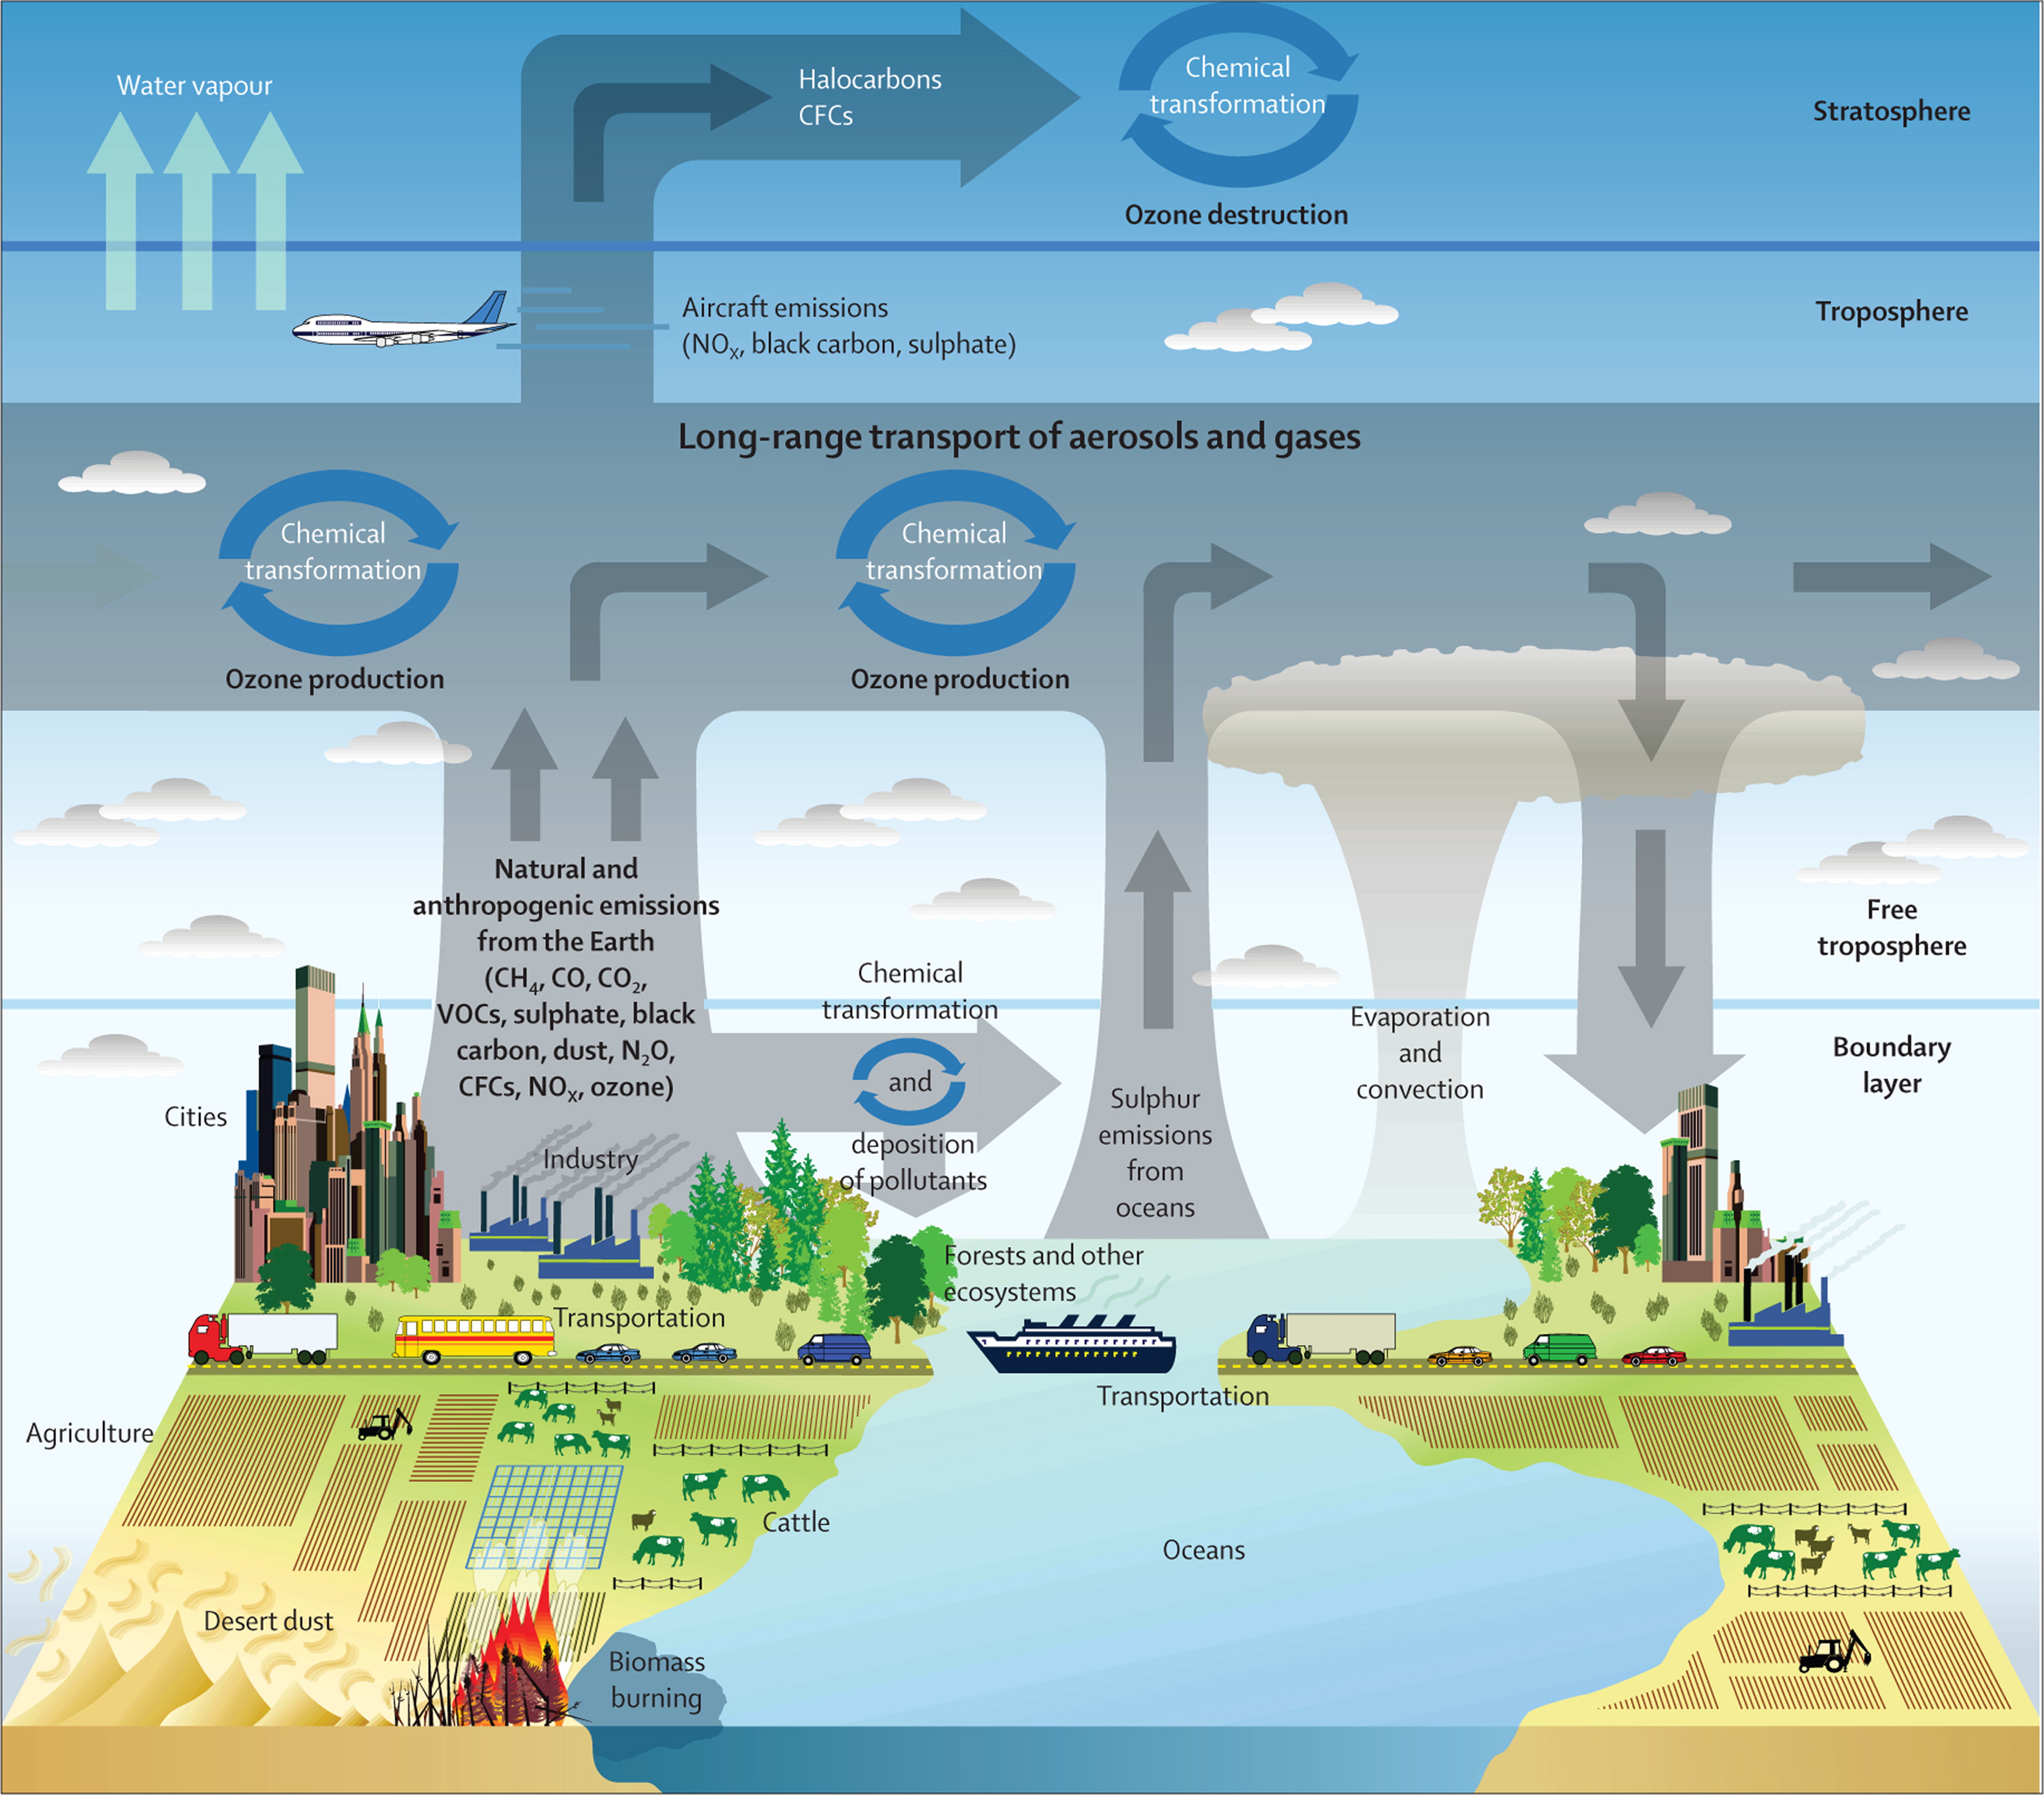
Figure 1.1: Natural and anthropogenic sources of air pollution (The Lancet)
Before taking a closer look at the most common sources, you can test your current knowledge with the following question:
Question 1
What do you think are the most common sources of particulate matter and nitrogen dioxide? For each of these, identify two sources in Figure 1.1.
1.2. Adverse health effects
Here, we present a brief overview of the health effects of the three most relevant air pollutants. The severity of the effects depends on both the person's health status and the duration and frequency of exposure to high concentrations.
- Particulate matter (PM10, PM2.5, PM1, PM0.1):
The particle size directly affects its potential for causing health problems (see Figure 1.2). Coarse particles (diameter less than or equal to 10 µm) will only reach the superior airway cavity. The smaller the diameter the more severe the effects, as small particles can penetrate deep into the lungs (e.g., particles with diameter less than 1 µm) and may even reach the bloodstream (particles with diameter less than 100 nm). Numerous scientific studies have linked particle pollution exposure to a variety of health problems, including:
- Increased respiratory symptoms, such as irritation of the airways, coughing or difficulty breathing.
- Aggravated asthma and decreased lung function.
- Non-fatal heart attacks, irregular heartbeat.
- Premature death of people with heart or lung disease.
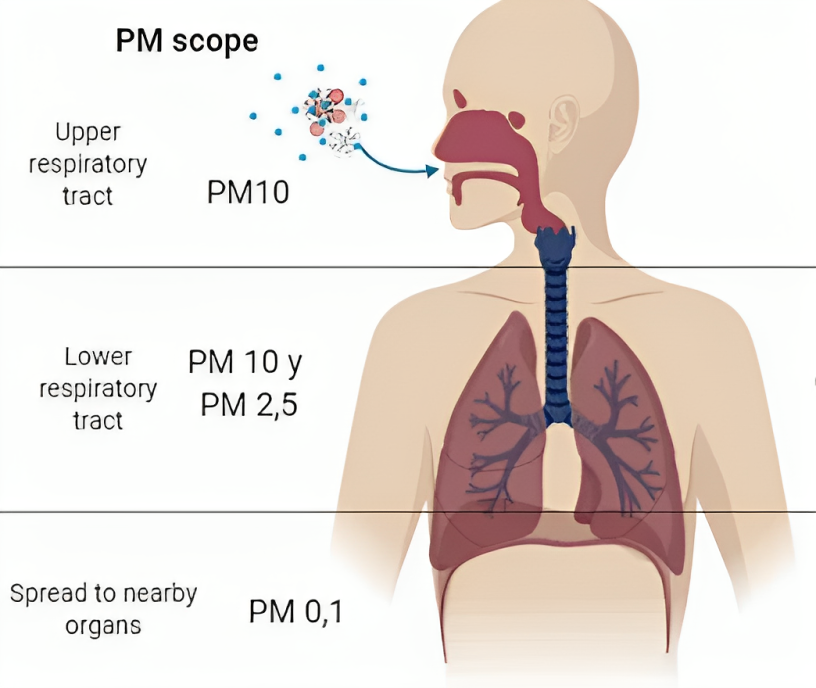
Figure 1.2: Main effects and anatomical reach of particulate matter. Depending on the aerodynamic diameter (< 0.1 µm, 2.5 µm, or 10 µm), particulate matter has the capacity to enter different anatomical sites of the respiratory tract, where it can remain or spread to other organs and tissues, causing diverse effects on them, and increasing susceptibility to human pathologies. (Loaiza-Ceballos et al., 2022).
- Nitrogen dioxide: breathing in air with a high concentration of this pollutant can irritate airways in the human respiratory system:
- Short exposures can aggravate respiratory diseases, particularly asthma, leading to respiratory symptoms (such as coughing, wheezing, or difficulty breathing), hospital admissions, and visits to emergency rooms.
- Longer exposures may contribute to the development of asthma and potentially increase susceptibility to respiratory infections.
-
Ozone: exposure to ozone can produce the following effects, depending on the level of exposure:
- Coughing and sore or scratchy throat.
- Difficulty in breathing deeply and vigorously, and pain when taking a deep breath.
- Inflammation of and damage to the airways.
- Increased susceptibility of the lungs to infection.
- Aggravation of lung diseases such as asthma, emphysema, and chronic bronchitis; increased frequency of asthma attacks.
- Eye irritation, tearing (watery eyes), headaches.
In central to northern Europe, Saharan dust rarely affects the air quality at breathing height; only after it has rained out can resuspended dust reach the breathing height. However, during certain Sahara dust events, high concentrations can occur at breathing height in Spain and Portugal, contributing to poor air quality. In the south of Spain, the Saharan dust can even contribute up to 40% of the PM (Nicolas et al., 2008).
1.3. Nitrogen dioxide as an air pollution indicator
Nitrogen dioxide can be considered an indicator of air quality in urban and industrialized areas. In urban environments (Figure 1.3), nitrogen dioxide is primarily emitted from fossil fuel combustion as nitrogen oxide (NO). This nitrogen oxide plays an important role in atmospheric chemistry by rapidly reacting with ozone or radicals and forming nitrogen dioxide. In the presence of solar light (hv in Figure 1.3), nitrogen dioxide is photolyzed by short-wave solar radiation to nitrogen monoxide and free oxygen. At a local scale, this equilibrium of the NO−NO2−O3 system in the lower troposphere is dominated by a limited number of fast reactions (including carbon monoxide and volatile organic compounds (VOCs)). In turn, high nitrogen (dio)oxide concentrations may favour nitric acid formation as a result of the daytime gas phase recombination reaction of the hydroxyl radical (∙OH) with nitrogen dioxide, and therefore play a key role in secondary inorganic aerosol generation (nitrate aerosols; Masiol et al., 2014). This explains why, when nitrogen dioxide levels are high, levels of other pollutants such as carbon monoxide, volatile organic compounds, and particulate matter will also be high.
Formaldehyde (HCHO) is a volatile organic compound for which satellite observations are available. Sources range from forest fires to furniture, and fuel combustion to personal care products. Health effects from formaldehyde are similar to the ones listed above for particulate matter, nitrogen dioxide, and ozone.
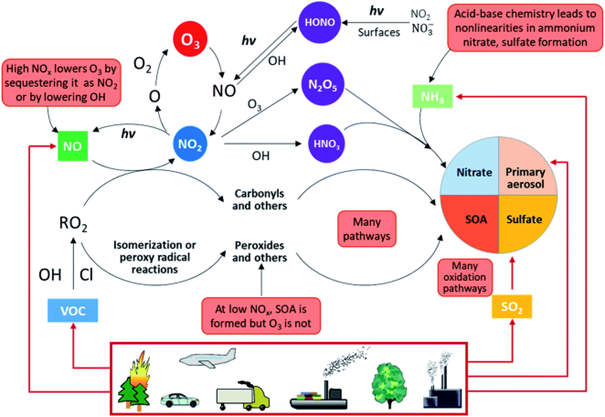
Figure 1.3: Overview of atmospheric physicochemical processes. The red boxes highlight the complexities, nonlinearities, and uncertainties. Primary emissions are denoted by red arrows and secondary reactions are denoted by black arrows. SOA = Secondary Organic Aerosol; hv = solar light. (Molina, L.T., 2021).
Accumulation of pollutants in urban areas can be exacerbated under certain atmospheric conditions. In winter, a cold spell accompanied by a thermal inversion can favour poor air quality (Figure 1.4). Other contributing factors include frequent and prolonged calm wind periods, high atmospheric stability, persistent thermal inversions, and lower planetary boundary layer heights (during the night). Additionally, there are increased domestic emissions in the coldest months.
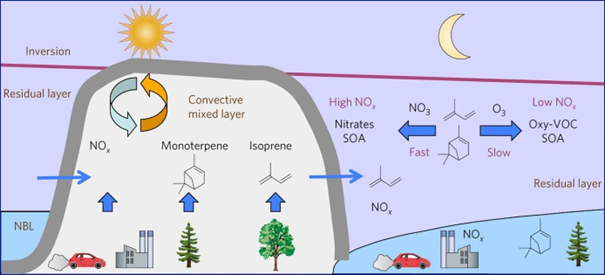
Figure 1.4: (Biogenic) volatile organic compounds ((B)VOCs) oxidation by ozone (O3) and nitrate (NO3), emission sources for nitrogen (di)oxide (NOx) and BVOC, and diurnal variation in boundary-layer structure. Although the vertical axis is not to scale, the residual layer constitutes most of the air mass beneath the inversion. (NBL = nocturnal boundary layer; Edwards, P., Aikin, K., Dube, W. et al., 2017).
Question 2
What is the main reason that nitrogen dioxide is an indicator of air quality?
1.4. Regulations and standards
The WHO Air Quality Guidelines (AQGs) recommend levels and interim targets (Table 1.2) for the following key air pollutants: particulate matter, ozone, nitrogen dioxide, sulphur dioxide, and carbon monoxide. These are designed to offer guidance in reducing the health impacts of air pollution based on expert evaluation of current scientific evidence.
Table 1.2: World Health Organisation Air Quality Guidelines for the following pollutants particulate matter (PM10 and PM2.5), ozone (O3), nitrogen dioxide (NO2), sulphur dioxide (SO2), and carbon monoxide (CO) (µg = microgram; WHO, 2021).
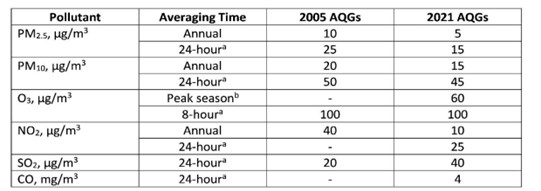
a99th percentile (i.e. 3-4 exceedance days allowed per year).
bAverage of daily maximum 8-hour mean O3 concentration in the six consecutive months with the highest six-month running- average O3 concentration. [Editor's summary: maximum 8-hour mean in 6 consecutive months]
The WHO guidelines serve as goals for air quality policies. To reach these, the EU air quality policy consists of a series of directives defining ambient air quality standards, based on the latest research on the health effects of air pollution. Recent European air quality standards and objectives are summarised in Table 1.3.
Table 1.3: European standards and objectives (European Commission, 2022)
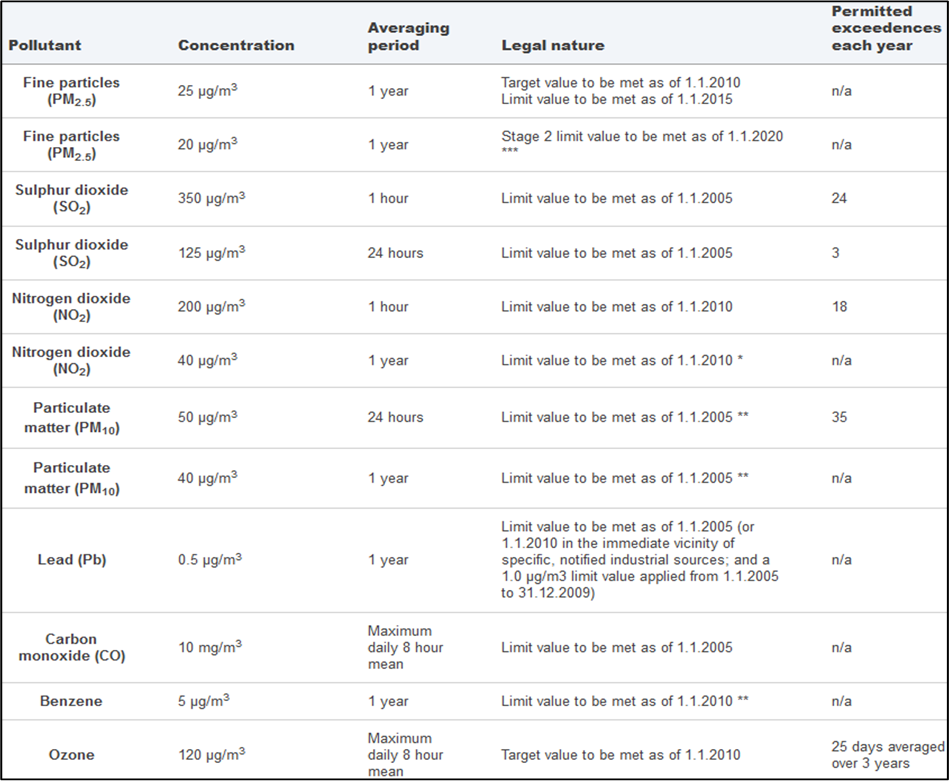
*Under Directive 2008/50/EU, the Member State could apply for an extension of up to five years (i.e. maximum up to 2015) in a specific zone. The request was subject to an assessment by the Commission. In such cases within the time extension period the limit value applies at the level of the limit value + maximum margin of tolerance (48 µg/m3 for annual NO2 limit value).
**Under Directive 2008/50/EU, the Member State was able to apply for an extension until three years after the date of entry into force of the new Directive (i.e. May 2011) in a specific zone. The request was subject to assessment by the Commission. In such cases within the time extension period the limit value applies at the level of the limit value + maximum margin of tolerance (35 days at 75µg/m3 for daily PM10 limit value, 48 µg/m3 for annual PM10 limit value).
***Stage 2: indicative limit value as referred to in Directive 2008/50/EU.
1.5. Interactions between (geo)physical and chemical processes in the atmosphere
Meteorological conditions affect atmospheric chemical processes and, in a few cases, the reverse is also true. The following list contains a selection of these interactions; readers are invited to further investigate each of these topics themselves.
- Wind speed and direction: with more wind, more mixing and dispersion takes place, as well as more (long-range) transport of dust and pollutants. A very low wind speed keeps pollutants near their sources, which can lead to high concentrations. A highly variable wind direction causes the pollutants to be dispersed in all directions. Finally, low wind speed can facilitate gas and particle deposition while high wind speed can cause resuspension of previously deposited particles.
- When (large scale) synoptic systems bring a 'cleaner' air mass, concentrations of pollutants can reduce, whereas if they bring a polluted air mass, local pollution levels increase.
- Atmospheric chemistry (formation and degradation of pollutants) is affected by the air temperature, humidity, and solar radiation (including the effect of clouds). For example, low temperature and high humidity conditions favour the conversion of gaseous ammonia to particulate ammonium (a secondary inorganic aerosol).
- Air temperature inversions in the lowest layer of the atmosphere and high-pressure inversions can cause accumulation of pollutants in the lowest layer of the atmosphere. As a given amount of pollutant is trapped in a smaller volume, under higher pressure, the resulting pollutant concentration is higher.
- Precipitation washes out pollutants: raindrops and snowflakes absorb gases and particles. Raindrops are more efficient at absorbing water soluble and/or small molecules, whereas snow is more effective at absorbing non-water soluble and larger molecules (Lei and Wania, 2004).
- Saharan dust intrusions and volcanic ash can reduce the surface layer air temperature, due to less solar radiation reaching the surface (dust particles reflect the sunlight).
- Clouds can occur unexpectedly: certain atmospheric conditions and aerosol (dust or ash) intrusion can cause cloud formation.
- Less mixing occurs in valleys, and air pollution from within valleys can accumulate at the bottom. In cities, 'artificial canyons' show similar effects.
- Smog (smoke + fog) formation occurs when fog is present at the same time as air pollution. The fog then becomes heavier and darker due to the smoke and chemical fumes. Occurrences of smog in Europe are quite rare these days.
Question 3
Where do you expect the highest PM10, and nitrogen dioxide concentrations? See Figure 1.1. Click on the image to enlarge it.
Question 4
Which of the following is true?
Question 5
How many of the European limit values are below the WHO guidelines?
Question 6
Imagine it is winter and there is a surface inversion. You work in the weather room and receive phone calls from people who complain about having headaches and itchy throats. They ask you if any of these symptoms could be due to the air quality and what you would recommend.
Question 7
Which of the following could be related to a Sahara dust event? Select all that apply.
Question 8
Which atmospheric conditions can favour an air pollution event? You can choose multiple answers.