Chapter II: Online resources for assessing air quality
Online resources for assessing air quality
In the case of an air pollution event, or when travel or outdoor activities are planned, satellite observations can provide a quick overview of where high air pollution levels are occurring. This section provides a summary of selected available online resources from remote sensing, numerical modelling simulations, and ground-based monitoring, focusing on the European region.
2.1. Satellite resources
More and more satellite observations are becoming available online, which are free for private and public use. Most satellite observations of atmospheric gases and particles represent total column values. This means that, for each pixel, one number represents an observation of all the layers of the atmosphere, or of part of the atmosphere if 'stratospheric' or 'tropospheric' are mentioned. For the key air pollutants (carbon monoxide, sulphur dioxide, and nitrogen dioxide) processed total column observations can easily be found, for example from the following intruments, the Global Ozone Monitoring Experiment (GOME-2; for nitrogen dioxide and sulphur dioxide), Infrared Atmospheric Sounding Interferometer (IASI; for carbon monoxide and sulphur dioxide), and the TROPOspheric Monitoring Instrument (TROPOMI; for nitrogen dioxide, carbon monoxide, and sulphur dioxide). Other relevant instruments are the Moderate Resolution Imaging Spectroradiometer (MODIS), Visible Infrared Imaging Radiometer Suite (VIIRS) and Spinning Enhanced Visible and Infrared Imager (SEVIRI). To check particulate matter levels (including desert dust), several aerosol products are available: Dust RGB Composite, Absorbing Aerosol Indices (AAI), Absorbing Aerosol Height (AAH), Aerosol Optical Depth (AOD), Aerosol Index (AI), Aerosol Particle Size Parameter, Active Fires, and Suspended Matter. Total column observations of ozone cannot be used to assess tropospheric ozone levels because they are dominated by the ozone of the so-called 'ozone layer' in the stratosphere. A few relevant satellite instruments, which species and parameters they observe, and where to see their products, are described here.
• GOME-2: nitrogen dioxide, formaldehyde, sulphur dioxide, Absorbing Aerosol Indices, Absorbing Aerosol Height.
The GOME-2 (from the European Space Agency (ESA) and the European Organisation for the Exploitation of Meteorological Satellites (EUMETSAT)) instrument on the MetOp satellites continues the long-term monitoring of atmospheric ozone started by GOME on ERS-2 and SCIAMACHY on Envisat. The first GOME-2 instrument was launched in 2006 on MetOp-A. Identical versions of the GOME-2 instrument were launched on board the MetOp-B and MetOp-C satellites, in 2012 and 2018, respectively. All three MetOp satellites are placed in near-polar, Sun-synchronous orbits, which means they provide one observation per location per 24 hours. Several products are available online as global daily GOME-2 images, for example on the Satellite Application Facility on Atmospheric Composition Monitoring (AC-SAF; acsaf.org) and the German Space Agency (DLR) sites; one can click on a location, and it displays the observed value, see Figure 2.1.

Figure 2.1: GOME-2 Daily SO2 from MetOp-B and -C combined. When clicking on a location an interpolated value is provided (DLR).
• MODIS: Aerosol Optical Depth (AOD).
MODIS is a key instrument aboard the Terra and Aqua satellites. Terra's orbit around the Earth is timed so that it passes from north to south across the equator in the morning, while Aqua passes south to north over the equator in the afternoon. NASA's Terra MODIS and Aqua MODIS view the entire Earth surface every 1 to 2 days, acquiring data in 36 spectral bands, or groups of wavelengths (see MODIS Technical Specifications). AOD is a measure of the atmospheric aerosol load, quantified by the sum of the aerosol extinction of light from the Earth's surface to the top of the atmosphere (0 = no extinction, 1 = maximum extinction). The more (dust) particles are in the air, the more extinction of the radiation from the Sun occurs. Figure 2.2 shows a map of AOD over the Canary Islands, during a Sahara dust outbreak that affected that area.

Figure 2.2: MODIS Aerosol Optical Depth (AOD; 0 = no extinction, 1 = maximum extinction) over the Canary Islands on 22 February 2020 NASA).
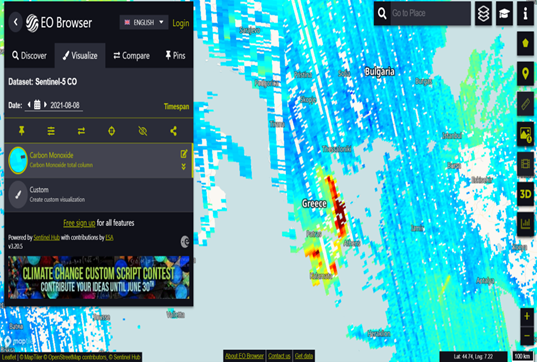
• TROPOMI: nitrogen dioxide, Aerosol Index, carbon monoxide, sulphur dioxide.
The first Copernicus satellite dedicated to monitoring atmospheric chemistry, polar orbiting Sentinel-5 Precursor (S5P), provides daily global information on concentrations of trace gases and aerosols important for air quality, climate forcing, and the ozone layer. It was developed to reduce data gaps between the Envisat satellite and the launch of Sentinel-5, and to complement GOME-2 on MetOp. The satellite carries one instrument, TROPOMI, which performs atmospheric measurements with high spatial resolution (3.5×5.5km). Figure 2.3 shows a carbon monoxide image of the fires in Greece occurring on 08 August 2021.
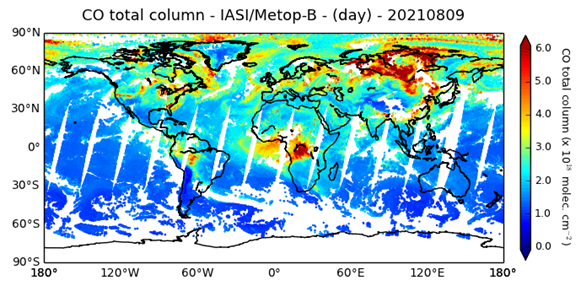
• IASI: carbon monoxide, sulphur dioxide, Dust AOD.
IASI is on board the MetOp polar orbiting satellites, continuously collecting data from an altitude of 817 km. The MetOp satellites carry eight main instruments, which collect essential data for weather forecasting up to 10 days ahead and for climate monitoring. Moreover, they also allow the monitoring of trace gases to improve our understanding of the interactions between atmospheric chemistry, climate and pollution. The AC-SAF (acsaf.org) and the IASI Portal (iasi.aeris-data) provides scientists with free and open access to atmospheric composition Level 2 data products retrieved from the IASI/MetOp observations along with quick-look images for several species:
- Level 2 data products: CO, O3, HCOOH, NH3, SO2, DUST-AOD, CH4 and CLOUD.
- Quick-look images: daily and monthly maps can be viewed on global and continental scales.
Figure 2.4 shows a global carbon monoxide total column image from Metop-B on 9 August 2021, during the summer fire season.
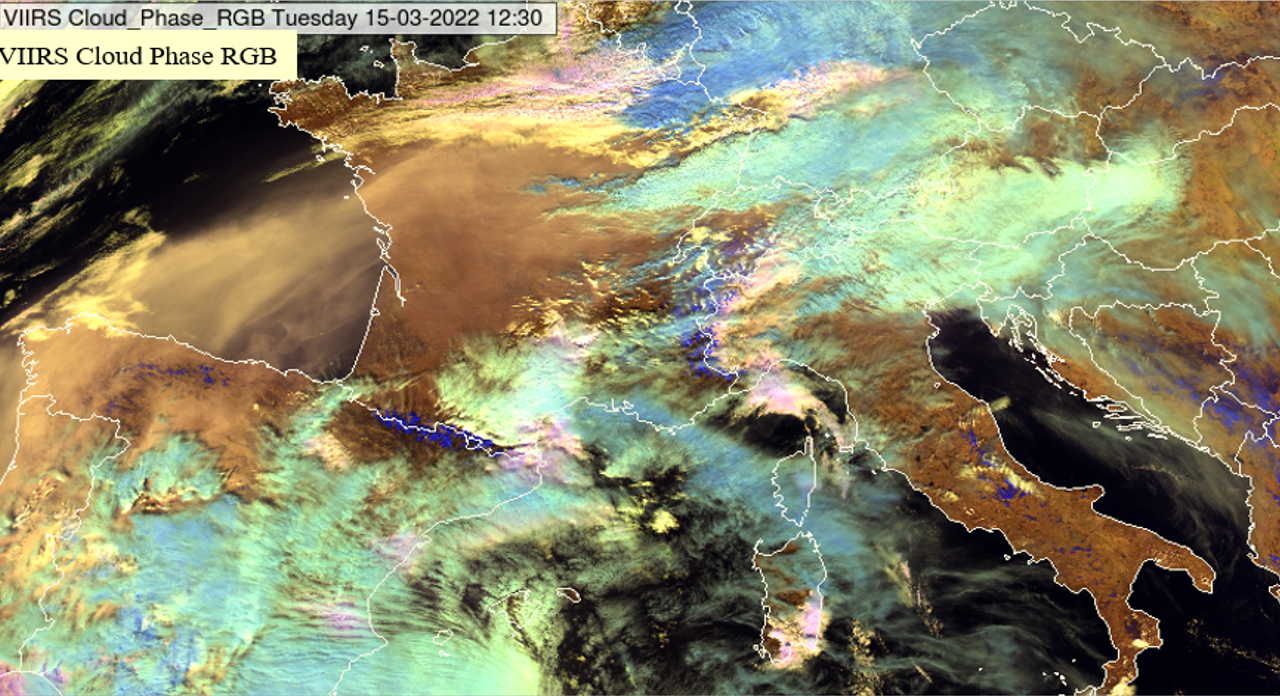
• VIIRS: Dust (AOD and combination of two or more channels, channel differences, or more complex operations into red, green, and blue colour 'components', RGB), Aerosol Particle Size Parameter, Active Fire product, Suspended Matter
VIIRS was first launched in October 2011 aboard the Suomi-National Polar-orbiting Partnership (S-NPP) satellite. VIIRS was designed to enable continuity of the multi-decadal polar orbit environmental satellite data record that includes NOAA's Advanced Very High Resolution Radiometer (AVHRR) and NASA's MODIS. Two separate sets of multispectral channels provide full global coverage at both 375 m and 750 m nominal resolutions every 12 h or less depending on the latitude. Examples of VIIRS environmental products are Aerosol Optical Thickness, Aerosol Particle Size Parameter, Suspended Matter, and Active Fires (NOAA). The Cloud Phase Day RGB enables the detection of Sahara dust over Europe, illustrated in Figure 2.5.
• SEVIRI: Dust (RGB composite), sulphur dioxide.
Two geostationary satellites carry a SEVIRI instrument, which provides image data in four Visible and Near-InfraRed (VNIR) channels and eight InfraRed (IR) channels. The VNIR channels include the High Resolution Visible (HRV) channel, which contains 9 broadband detection elements to scan the Earth with a 1 km sampling distance at Sub-Satellite Point (SSP). SEVIRI provides continuous imaging of Europe and Africa in 12 spectral channels with a baseline repeat cycle of 15 min.
For the analysis of dust events, EUMETSAT provides the EUMETView tool (Figure 2.6) where real time RGB pictures can be consulted (EUMETView).

Question 9
For which of the following are the most remote sensing products available?
Question 10
Which of the listed instruments provides observations of sulphur dioxide? Several answers are possible.
2.2. Other online resources
Besides satellite observations, other air quality resources can be useful and are available online. They can be used to complement the information from satellite observations. A selection of such resources is presented in this section.
To test your current knowledge, what are other online air quality resources that can complement the satellite observations? Write down what you know from your experience and click on 'Submit'.
Air quality models provide high temporal and spatial resolution analyses and forecasts, and can be used, for example, to predict when air pollution events could start and finish. To check current local concentration levels, measurements from ground-based stations are available from national or European services (for example, the EEA). For Sahara dust events, a variety of resources can be found on the website of the Sand and Dust Storm Warning Advisory and Assessment System (SDS-WAS). Finally, it can be helpful to have information on the vertical distribution of aerosols in the lower atmosphere, such as provided by ceilometer profiles (useful for example in the case of a Sahara dust or particulate matter pollution event). For each of the resources listed below the method of interpretation is fairly similar: watch how levels change over time for your area of interest. In order to understand the large-scale movements, you might want to also check a synoptic chart.
• European Air Quality Models
Satellite observations provide a snapshot and generally have low temporal resolution. Air quality models compute analyses and forecasts, with various temporal and spatial resolutions. Many of these models integrate processed satellite observations. A few national meteorological services provide information on current and forecasted air quality (including Saharan dust) on their websites, however, the high-resolution ensemble provided by the Copernicus Atmosphere Monitoring Service (CAMS) is much more comprehensive. CAMS is one of six services that form Copernicus, the European Union's Earth observation programme.
The CAMS website provides an ensemble of model analyses and forecasts, based on eleven state-of-the-art numerical air quality models developed in Europe. They are combined via an ensemble approach, which calculates the median value of the individual outputs for particulate matter, nitrogen dioxide, sulphur dioxide, ozone, desert dust, and pollen. Forecasts are available from 0 h to 96 h, at a spatial resolution of 0.1°, temporal resolution of 1 hour and from the surface up to 5000 m. Figure 2.7 shows what a PM10 forecast can look like.

Figure 2.7: PM10 daily max concentration for 19 April 2022, forecast computed with the ensemble of the selected models. The yellow icons indicate cities, for which graphs are shown after clicking on the icon. (CAMS).
National Meteorological Services' model analyses and forecasts, for example the forecast of the Sahara dust load from the WRF-Chem model, by GeoSphere Austria (see Figure 2.8).
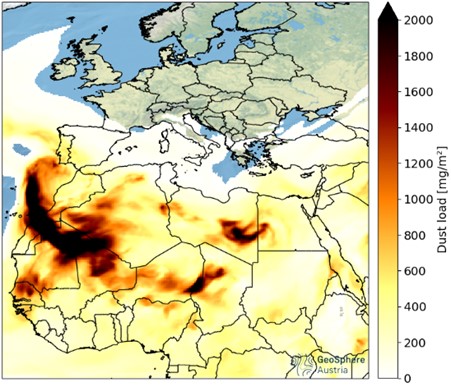
Figure 2.8: Sahara dust load forecast in North Africa and Europe on 21 April 2022 from the WRF-Chem model (GeoSphere Austria).
Another example is the ozone forecast from the Finish Meteorological Institute, illustrated in Figure 2.9.
• Ground-based air quality measurements
The European Environment Agency (EEA) collects observations from European air quality stations on the ground and provides concentrations of nitrogen dioxide, ozone, PM10, and PM2.5 (see Figure 2.10).
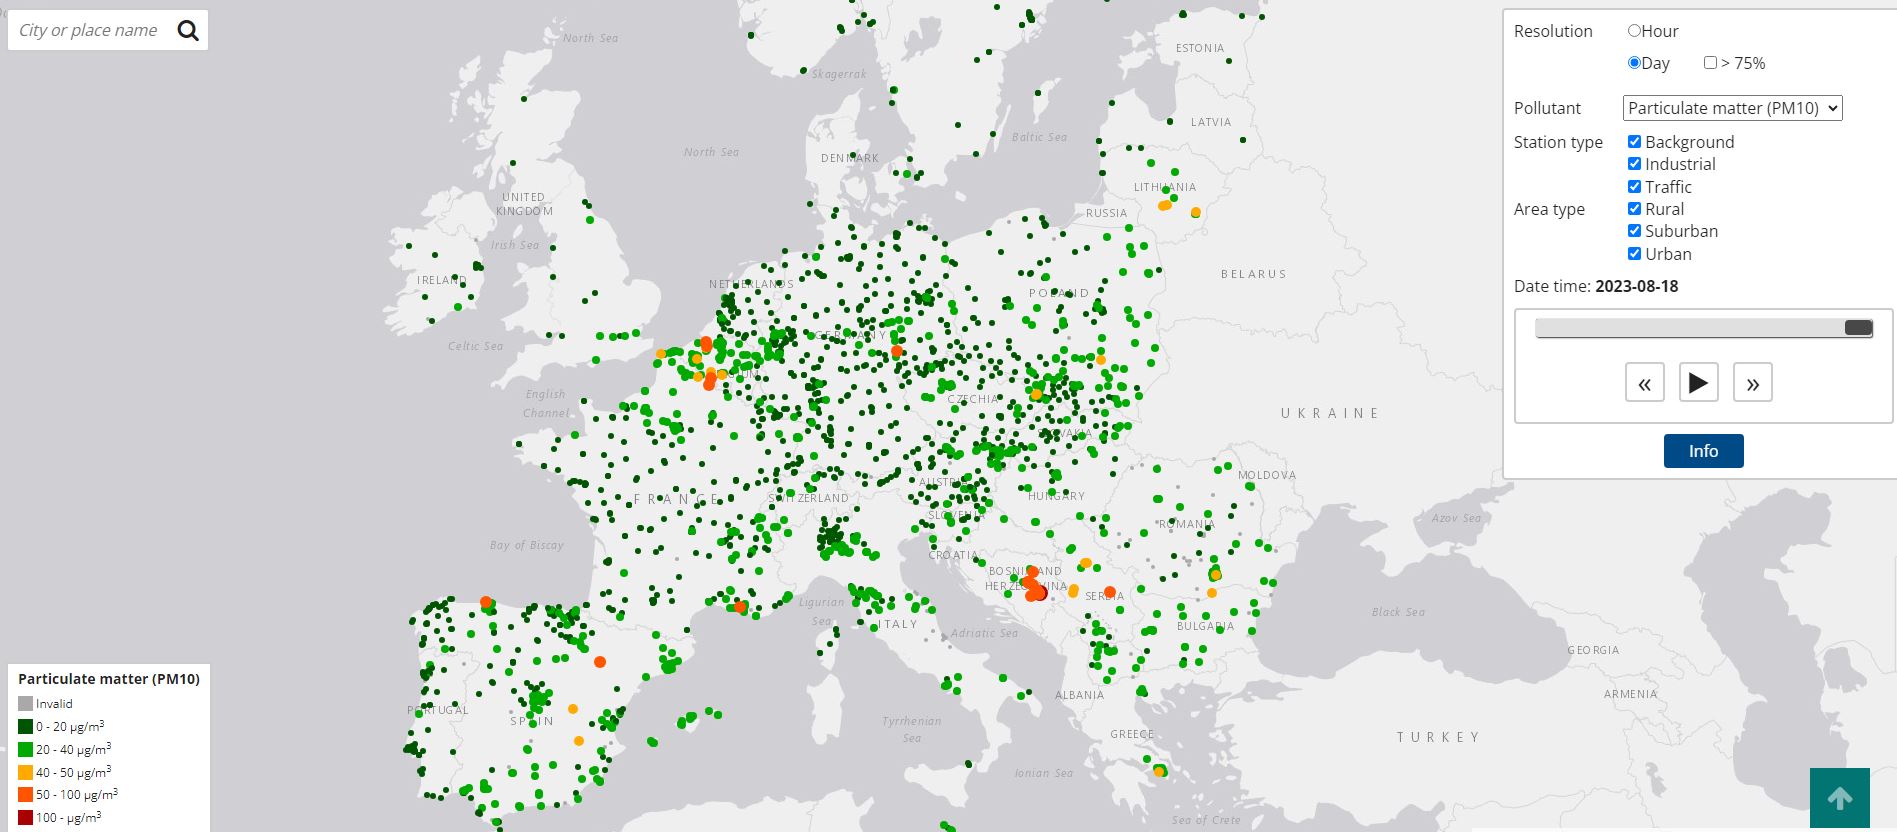
Figure 2.10: PM10 concentration levels from ground-based observations at European stations on 19 April 2022 (EEA).
• Sand and Dust Storm Warning Advisory and Assessment System (SDS-WAS)
The World Meteorological Organization (WMO) has taken the lead with international partners to develop and implement a Sand and Dust Storm Warning Advisory and Assessment System (SDS-WAS). The purpose is to deliver timely and quality sand and dust storm forecasts, observations, information, and knowledge (Figure 2.11).
• Vertical profiles
Ceilometers are single-wavelength backscatter lidars operating in the near-infrared, traditionally used only to report cloud base and fraction and vertical visibility, rather than vertical profiles of the backscatter coefficient. Recent applications include aerosol applications such as volcanic ash tracking and boundary layer monitoring. Online European profiles are available at EUMETNET, see Figure 2.12.
Question 11
Which non-satellite online resource listed would you check first in case of a Sahara dust event? [Click on any of the images from Section 2.2 to enlarge them/select them, click again to close the image.]
Figure 2.7:(CAMS)
Figure 2.8: WRF-Chem model
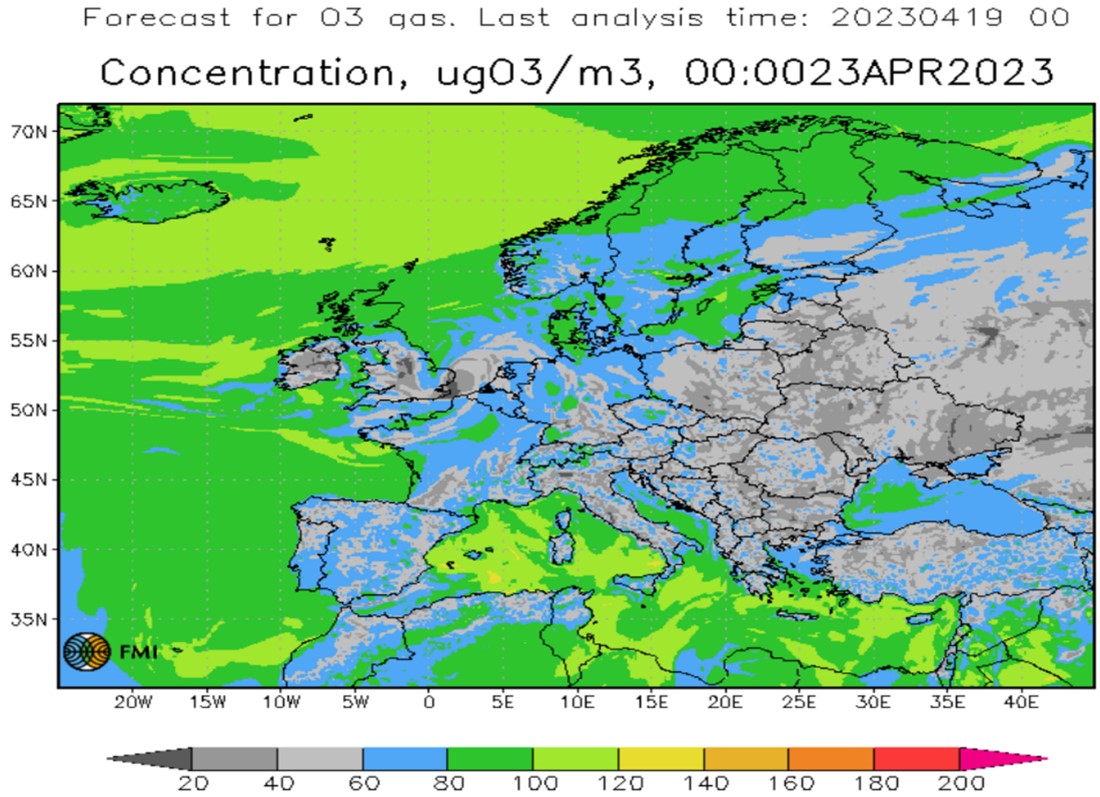
Figure 2.9: Ozone forecast from the SILAM model
Figure 2.10: PM10 concentration levels from ground-based observations at European stations on 19 April 2022

Figure 2.11: SDS-WAS products
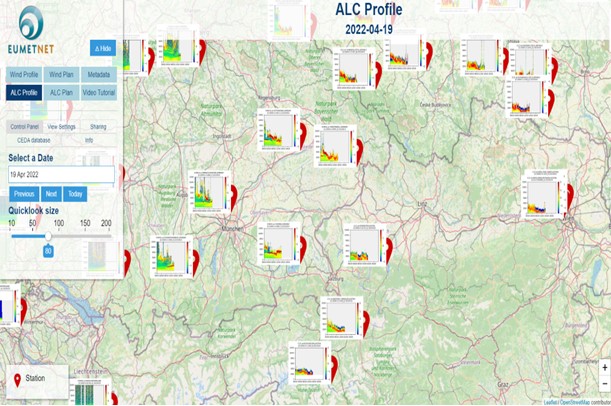
Figure 2.12: European ceilometer profiles