3.2. Air pollution event: Po valley, February 2019
The terrain and latitude of the Po valley make it prone to frequent pollution episodes, especially during winter when inversions can be strong. Its topographic and meteorological conditions generally limit the dispersion of pollutants (Figure 3.7).

Figure 3.7: Panoramic view of the main valley over the Aosta-Saint-Christophe station during a pollution advection event. The picture was taken from Croce di Fana (2200 m a.s.l., Quart village, 6 km northeast of Aosta-Saint-Christophe) on 21 October 2017 (Diémoz et al., 2019).
As an example of an air pollution event in the Po valley, a nitrogen dioxide air pollution episode starting on 15 February 2019, is presented here. Figure 3.8 clearly illustrates that, especially on 21 February, the polluted air was trapped between the Alps and the Apennines.
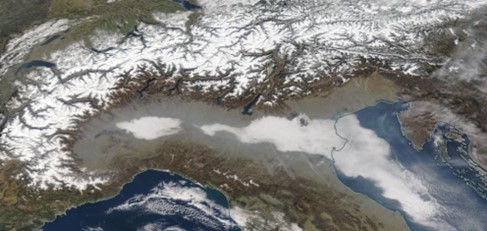
Figure 3.8: Image for 21 February 2019, from MODIS Terra (corrected reflectance, true colour; NASA Worldview) showing accumulated air pollution (in grey).
During this air pollution event, nitrogen dioxide concentration levels at ground stations were reported to exceed 50 µg m-3. Consequently, minor health effects (irritated airways, coughing, exacerbation of existing lung condition symptoms) caused by this relatively high concentration level of nitrogen dioxide could have occurred. As explained above, since nitrogen dioxide is considered an air quality indicator, levels of other air pollutants were presumably also higher, as well as related health effects. In selected regions, traffic reducing measures were taken for a few days. In the following exercise, you are invited to have a closer look at this event.
Question 14
Which of the resources listed in 3.1 do you think are suitable to use for this air pollution event? (You can select multiple answers).