2.2. Other online resources
Besides satellite observations, other air quality resources can be useful and are available online. They can be used to complement the information from satellite observations. A selection of such resources is presented in this section.
To test your current knowledge, what are other online air quality resources that can complement the satellite observations? Write down what you know from your experience and click on 'Submit'.
Air quality models provide high temporal and spatial resolution analyses and forecasts, and can be used, for example, to predict when air pollution events could start and finish. To check current local concentration levels, measurements from ground-based stations are available from national or European services (for example, the EEA). For Sahara dust events, a variety of resources can be found on the website of the Sand and Dust Storm Warning Advisory and Assessment System (SDS-WAS). Finally, it can be helpful to have information on the vertical distribution of aerosols in the lower atmosphere, such as provided by ceilometer profiles (useful for example in the case of a Sahara dust or particulate matter pollution event). For each of the resources listed below the method of interpretation is fairly similar: watch how levels change over time for your area of interest. In order to understand the large-scale movements, you might want to also check a synoptic chart.
• European Air Quality Models
Satellite observations provide a snapshot and generally have low temporal resolution. Air quality models compute analyses and forecasts, with various temporal and spatial resolutions. Many of these models integrate processed satellite observations. A few national meteorological services provide information on current and forecasted air quality (including Saharan dust) on their websites, however, the high-resolution ensemble provided by the Copernicus Atmosphere Monitoring Service (CAMS) is much more comprehensive. CAMS is one of six services that form Copernicus, the European Union's Earth observation programme.
The CAMS website provides an ensemble of model analyses and forecasts, based on eleven state-of-the-art numerical air quality models developed in Europe. They are combined via an ensemble approach, which calculates the median value of the individual outputs for particulate matter, nitrogen dioxide, sulphur dioxide, ozone, desert dust, and pollen. Forecasts are available from 0 h to 96 h, at a spatial resolution of 0.1°, temporal resolution of 1 hour and from the surface up to 5000 m. Figure 2.7 shows what a PM10 forecast can look like.

Figure 2.7: PM10 daily max concentration for 19 April 2022, forecast computed with the ensemble of the selected models. The yellow icons indicate cities, for which graphs are shown after clicking on the icon. (CAMS).
National Meteorological Services' model analyses and forecasts, for example the forecast of the Sahara dust load from the WRF-Chem model, by GeoSphere Austria (see Figure 2.8).
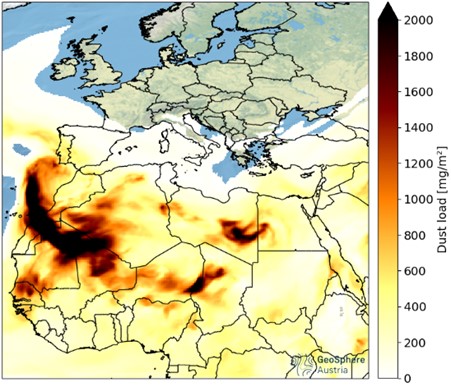
Figure 2.8: Sahara dust load forecast in North Africa and Europe on 21 April 2022 from the WRF-Chem model (GeoSphere Austria).
Another example is the ozone forecast from the Finish Meteorological Institute, illustrated in Figure 2.9.
• Ground-based air quality measurements
The European Environment Agency (EEA) collects observations from European air quality stations on the ground and provides concentrations of nitrogen dioxide, ozone, PM10, and PM2.5 (see Figure 2.10).
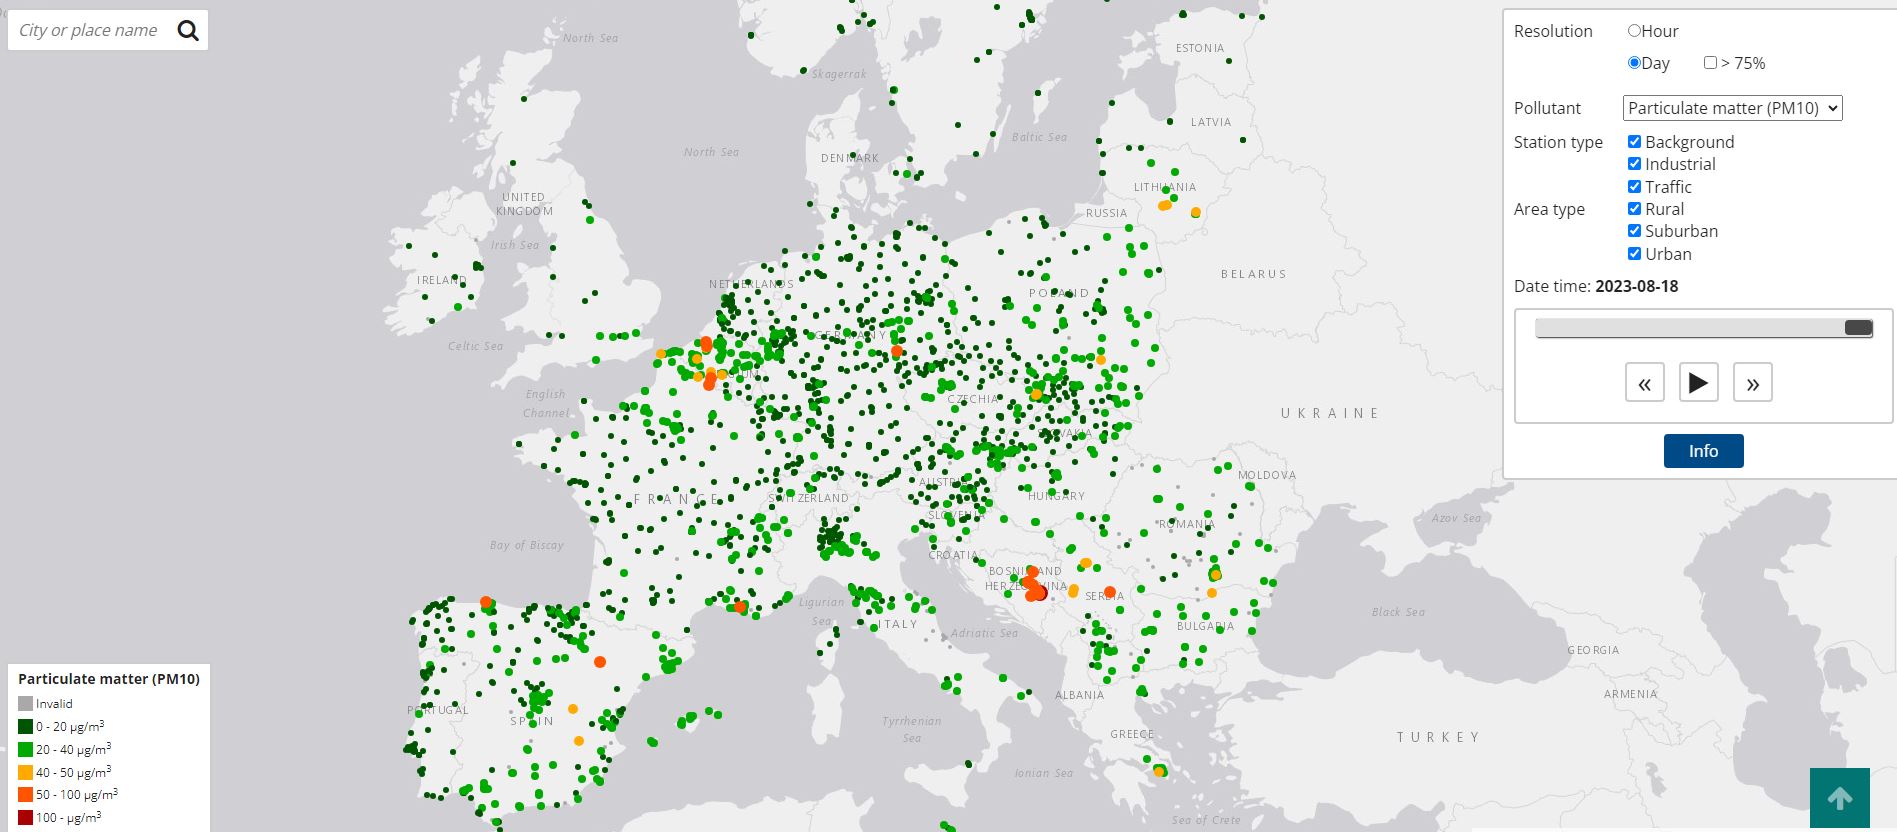
Figure 2.10: PM10 concentration levels from ground-based observations at European stations on 19 April 2022 (EEA).
• Sand and Dust Storm Warning Advisory and Assessment System (SDS-WAS)
The World Meteorological Organization (WMO) has taken the lead with international partners to develop and implement a Sand and Dust Storm Warning Advisory and Assessment System (SDS-WAS). The purpose is to deliver timely and quality sand and dust storm forecasts, observations, information, and knowledge (Figure 2.11).
• Vertical profiles
Ceilometers are single-wavelength backscatter lidars operating in the near-infrared, traditionally used only to report cloud base and fraction and vertical visibility, rather than vertical profiles of the backscatter coefficient. Recent applications include aerosol applications such as volcanic ash tracking and boundary layer monitoring. Online European profiles are available at EUMETNET, see Figure 2.12.
Question 11
Which non-satellite online resource listed would you check first in case of a Sahara dust event? [Click on any of the images from Section 2.2 to enlarge them/select them, click again to close the image.]
Figure 2.7:(CAMS)
Figure 2.8: WRF-Chem model
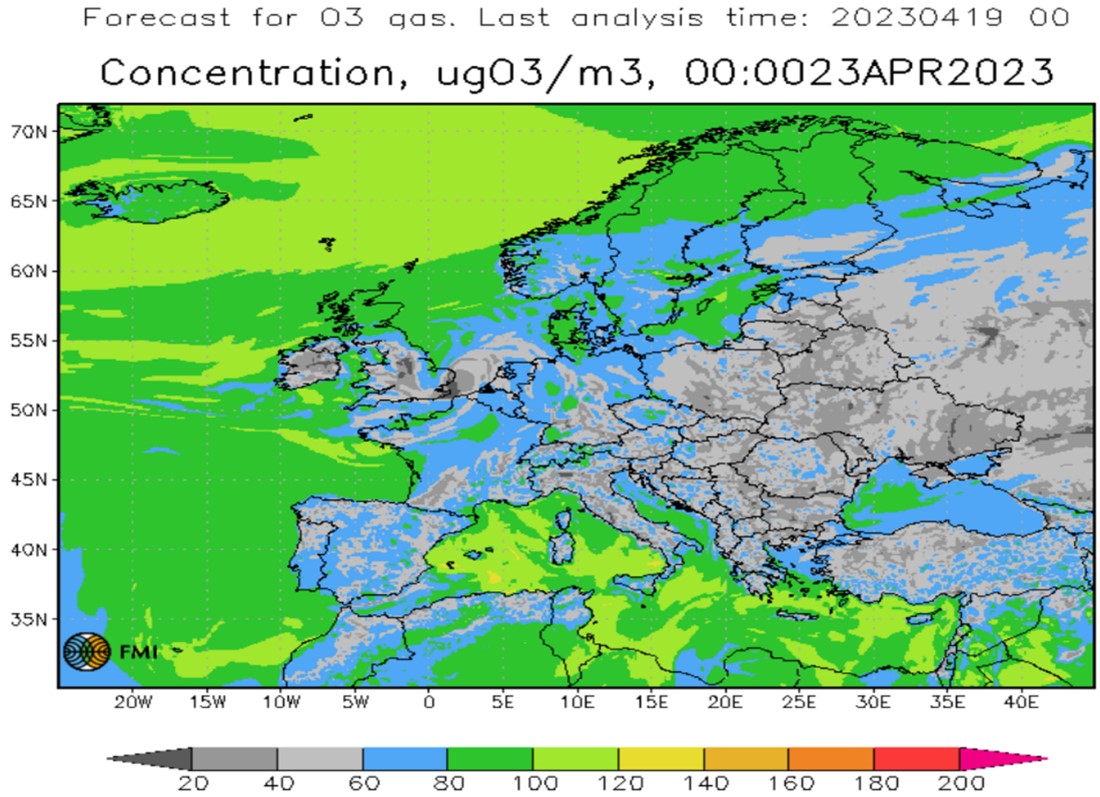
Figure 2.9: Ozone forecast from the SILAM model
Figure 2.10: PM10 concentration levels from ground-based observations at European stations on 19 April 2022

Figure 2.11: SDS-WAS products
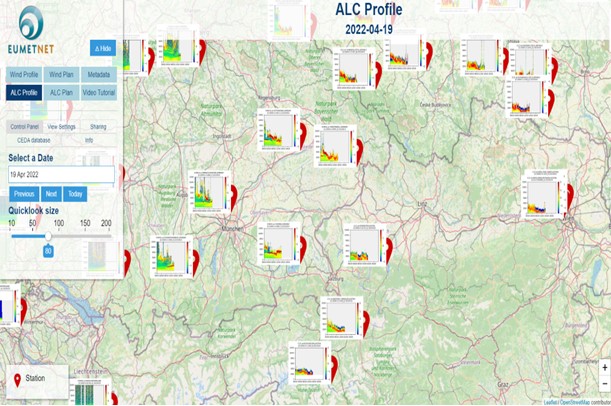
Figure 2.12: European ceilometer profiles