Chapter V: Vegetation Products
5 - Vegetation Products
Satellite observations are a valuable tool for the monitoring of dynamic processes occurring at the earth surface. The changes in the structure and the functioning of vegetation are part of such processes, that can be detected through remote sensing. In particular, FVC (Fractional Vegetation Cover), LAI (Leaf Area Index) and fAPAR (Fraction of Absorbed Photosynthetically Active Radiation) are key variables for a wide range of land biosphere applications (Product User Manual (PUM) of LSA SAF Vegetation Products).
In this chapter you will learn:
- how this variables can be retrieved from satellite observations;
- the main applications of this vegetation products;
- the main characteristics of FVC, LAI and fAPAR estimated on the aim of the LSA SAF project;
- the advantages of using geostationary satellite derived products in comparison to polar orbiters;
5.1 - Definitions
Although the names of these variables might be self-descriptive, we should pay attention to their physical definitions:
5.1.1 - Fraction of Vegetation Cover (FVC)
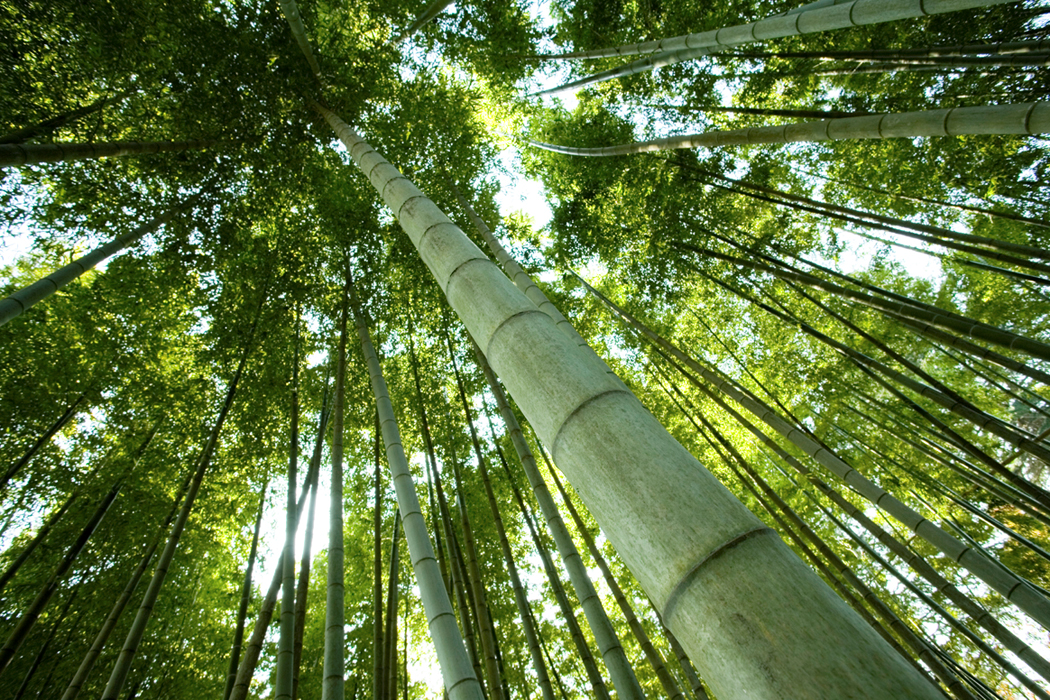
The FVC accounts for the amount of vegetation distributed on a flat background. For a pixel such as that on the next figure, FVC = 24% would tell us the fraction of the total pixel that is covered by green vegetation.

(adapted from Pixabay by Pok Rie)
MAIN APPLICATIONS:
FVC is relevant for agriculture and forestry, environmental management and land use, hydrology, natural hazards monitoring and management, vegetation-soil dynamics monitoring, drought conditions and fire scar extent. (Fraction of Vegetation Cover Product User Manual (PUM)).
5.1.2 - Leaf Area Index (LAI)
LAI [m2/m2] is geometrically defined as the total one-sided area of photosynthetic tissue per unit of ground surface area. It represents the amount of leaf material in ecosystems and controls the links between biosphere and atmosphere through various processes such as photosynthesis, respiration, transpiration and rain interception.
Monitoring the distribution and changes of LAI is important for assessing growth and vigour of vegetation on the planet. It is fundamentally important as a parameter in land-surface processes and parameterizations in climate models.
MAIN APPLICATIONS:
LAI is a key parameter in Numerical Weather Prediction (NWP) models, regional and global climate modelling, weather forecasting and global change monitoring. Monitoring the distribution and changes of LAI is important for assessing growth and vigour of vegetation on the planet. (Leaf Area Index Product User Manual (PUM)).
FVC and LAI are important structural properties of land surface areas occupied by plant canopies, which yield complementary information to describe the three-dimensional structure of the vegetation attributes.
5.1.3 - Fraction of photosynthetically active radiation (fAPAR)
fAPAR represents the fraction of incoming solar radiation in the photosynthetically active radiation (PAR) spectral range (0.4 - 0.7 μm) that is absorbed by the green parts of the canopy.

MAIN APPLICATIONS:
fAPAR has been recognized as one of the fundamental terrestrial state variables in the context of the global change sciences (Steering Committee for GCOS, 2003; Gobron et al., 2006). It is a key variable in models of vegetation primary productivity and, more generally, in carbon cycle models implementing up-to-date land surfaces process schemes (e.g., Sellers et al., 1997). Besides, it is an indicator of the health of vegetation (Fraction of Absorbed Photosynthetic Active Radiation Product User Manual (PUM)).
Seasonal variations in LAI and fAPAR are vital to determine landscape water, energy and carbon balances, as well as in the detection of long-term climate change (Potter et al, 1993, Churkina and Running 1998, cited by Huemmrich et al, 2005).
FVC, LAI and fAPAR are currently estimated from SEVIRI on board MSG (METEOSAT SECOND GENERATION), within the framework of the LSA SAF. The LSA SAF is part of the EUMETSAT SAF Network.
VEGETATION PRODUCTS FROM OTHER SATELLITE PROGRAMS:
The following programs have also implemented algorithms in their operational lines to provide advanced biophysical products:
- POLDER (Leroy et al. 1997, Roujean and Lacaze 2002);
- MODIS and MISR (Knyazikhin et al. 1999);
- MERIS (Gobron et al. 1999, Bacour et al. 2006, Baret et al. 2007);
- SEAWIFS (Gobron et al. 2001);
- VEGETATION (Baret et al. 2007, Bartholomé et al. 2006);
- GLOBCARBON (Plummer et al. 2006, Deng et al. 2006)
5.2 - Spatial Coverage of the LSA SAF Vegetation Products
The Land SAF vegetation products are estimated at the full spatial resolution of the MSG/SEVIRI instrument over 4 geographical areas, covering the full MSG disk.
5.3 - Temporal Resolution & Data Availability
The LSA SAF vegetation products are produced on a daily (and 10-day) basis. To access LSA SAF products a simple registration is required on the following address: https://landsaf.ipma.pt/en/
The data files can be obtained by different ways:
- In Offline mode:
- Direct download from the webpage;
- In Near Real Time:
- ftp transfer;
- via EUMETCAST
5.4 - Product Content
The FVC, LAI and fAPAR products contain 3 datasets each, comprising the following fields:
- a vegetation field;
- an error estimate field;
- a quality control information field.
The data is coded in HDF5 format. The HDF5 files in Land SAF system have the following structure:
- A common set of attributes for all kind of data, containing general information about the data;
- A dataset for the parameter values;
- Additional datasets for metadata (e.g., quality flags, error field).
5.5 - Algorithms
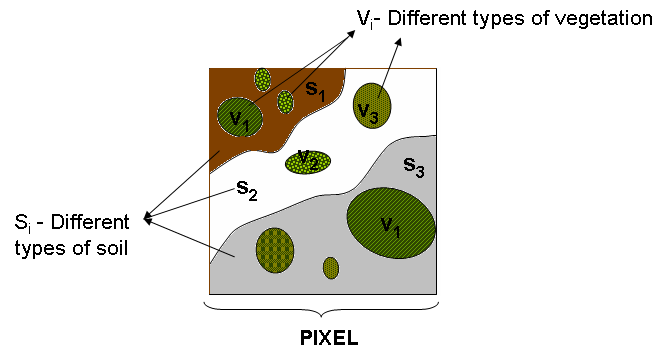
The retrieval of FVC, LAI and fAPAR in the LSA SAF rely on Spectral Mixture Analysis (SMA); the signal from a single pixel (surface reflectance) is assumed to be the contribution of different vegetation and bare soil components within the scene (next figure).
As detailed in Chapter 2, the surface BRDF may be written as:
ρ (θs, θv, φ) = K0 + K1 x F1(θs, θv, φ) + K2 x F2(θs, θv, φ)
Where:
K0 - represents isotropic reflectance;
K1 - represents geometric reflectance;
K2 - represents volumetric reflectance;
Parameters K0 in the SEVIRI channels VIS 0.6 μm, VIS 0.8 μm and NIR 1.6 μm are used to determine FVC and LAI, while fAPAR uses K0, K1 and K2.
5.5.1 - LSA SAF FVC
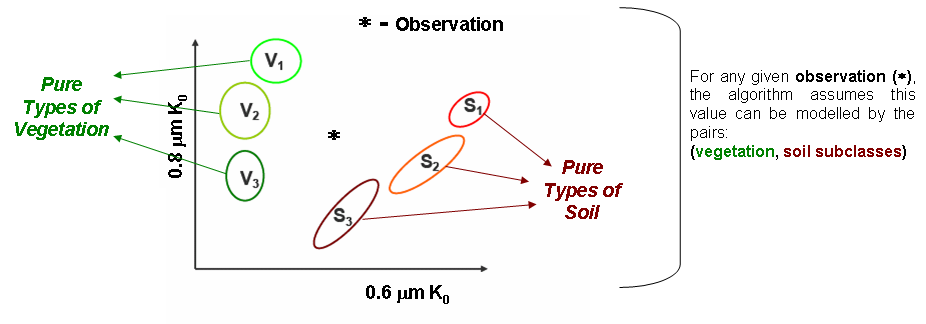
The estimation of FVC is based on the analysis of K0 for VIS 0.6 μm, VIS 0.8 μm and NIR 1.6 μm channels. The K0 component of surface reflectance is the less affected by shadows and, therefore is able to provide a physically correct estimation of FVC. Taking into account the spectral signature of pure types of vegetation (V1,V2,V3) and soil (S1,S2,S3), the SMA process allows to estimate the fraction of the vegetation types present in the pixel.
Next figure shows an example, considering a 2 dimensional space [0.8 μm K0 and 0.6 μm K0 ]
Therefore FVC is estimated by the following expression:
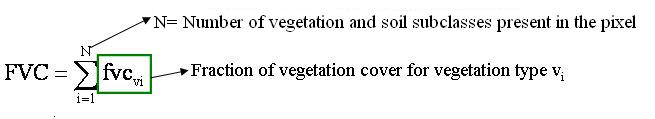
Pure vegetation types consider species prevalent in:
- V1 - Crops
- V2 - Herbaceous ecosystems
- V3 - Forest
Soil types include:
- S1 - Bare soil
- S2 - Rock
- S3 - Human-built surfaces
Next figure shows an example of FVC over the Full SEVIRI disk (figure on the left), and the corresponding Error (figure on the right) for the 15th April 2007.
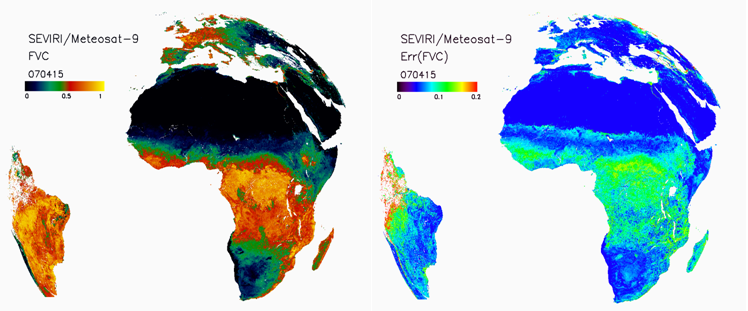
The FVC image adequately captures the spatial patterns of vegetation cover at continental level. Large spatial variation gradients are observed over Africa. This figure also highlights the spatial homogeneity and the absence of large gaps in the FVC field.
5.5.2 - LSA SAF LAI
LAI in the LSA SAF is retrieved using a semi-empirical method proposed by Roujean and Lacaze (2002), in which LAI is related to FVC trough the following expression:
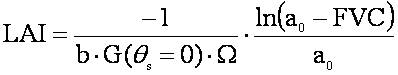
Where:
- a0 - is a coefficient within the range 1.04 to 1.07;
- b = 0.945;
- G = 0.5;
Both coefficients a0 and Ω depend on a Land Cover Classification Map (GLC2000) GLC2000_EUR.pdf
The next figure shows an example of LAI over the Full SEVIRI disk (figure on the left), and the corresponding Error (figure on the right) for the 15th April 2007.
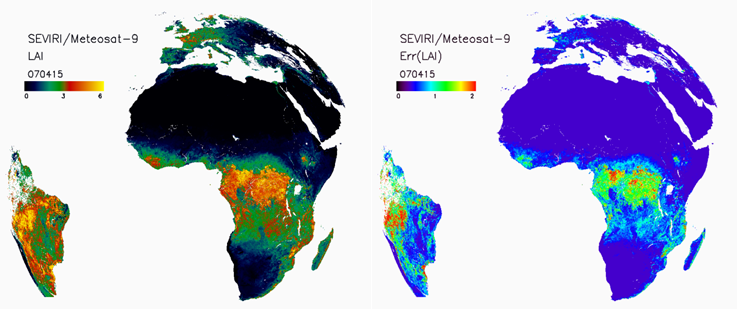
Large spatial gradients of LAI are also found over Africa:
- LAI ~ 0 on the Sahara desert;
- LAI gradually increases in the Sahel from areas with sparse vegetation to woody Savannas, reaching the highest values in the equatorial forests;
- In the southern hemisphere, LAI decreases again from tropical forest through the woody savannas to the desert of Namibia;
- The higher values within the Meteosat disk (LAI= 6.5) are found in Amazonian forest.
5.5.3 - LSA SAF fAPAR
The fAPAR is estimated from a NDVI-like vegetation index, the RDVI (Renormalized Difference Vegetation Index).
As you have seen, in chapter 4, NDVI is given by the normalized difference between reflectances in channels 0.6 μm and 0.8 μm. RDVI, is a very similar parameter given by:

RDVI has a behaviour close to that of NDVI for large LAI, but tends to be more sensitive to changes in vegetation coverage under low LAI conditions. Since the view-illumination geometry may have a large impact on reflectance observations, RDVI is computed using 0.6 μm and 0.8 μm surface reflectances corrected to an optimal geometry, which maximizes the correlation with fAPAR. Such corrected reflectance values are estimated, for each channel, from K0, K1 and K2 parameters (Roujean et al. 1992):
corresponding to solar and view zenith angles of 45° and 60°, respectively. fAPAR estimation explores its linear relationship to RDVI (obtained for the optimal geometry):
Next figure shows an example of fAPAR over the Full SEVIRI disk (figure on the left), and the corresponding Error (figure on the right) for the 15th April 2007.

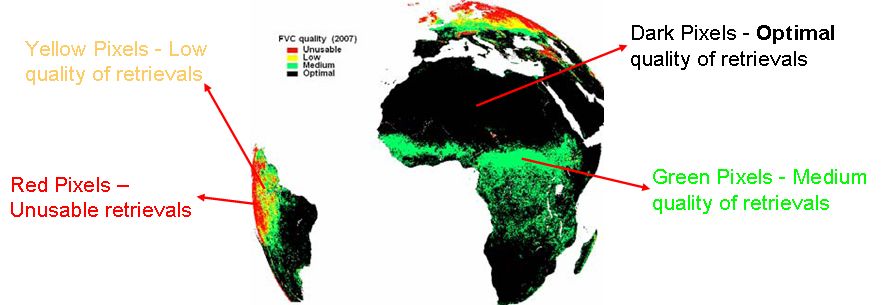
5.6 - Overall quality of LSA SAF Vegetation Products
The overall quality of the LSA SAF vegetation products depends on the pixels location:
-
regions with large view zenith angles (e.g., North of Europe, South America) are expected to have larger errors (next Figure).

This is mainly the case of Europe during wintertime as a combination of multiple effects, such as:
- low illumination and high observation angles;
- higher anisotropy;
- higher cloud occurrence;
- larger shadows or traces of snow cover;
- the African continent and the Mediterranean Basin are consolidated areas with optimal geometry of acquisition.
The spatial distribution of the mean FVC uncertainty along the year 2007 is depicted in next Figure:
The fraction of valid pixels (i.e. processed with reliability) for FVC over Africa is nearly 100% through the whole year. This is partly because products benefit from the high temporal sampling of the SEVIRI data, guaranteeing a high rate of cloud-free radiances per pixel.
Europe and South America present generally a decreased accuracy.
5.7 - Scientific validation of LSA SAF products
Validation techniques are required to provide the confidence intervals that are mandatory for the users in a number of applications. LSA SAF products are validated through (LSA SAF VEGA Validation Report from 2017):
- Intercomparison with vegetation products derived from other satellite sensors (e.g., MERIS on ENVISAT, MODIS on EOS and VEGETATION on SPOT)
- Comparison with in situ measurements
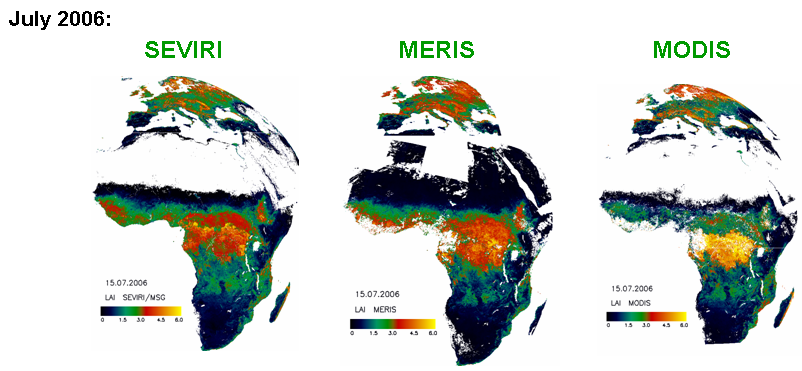
1) Intercomparison with vegetation products derived from other satellite sensors
Next figures show composites of actual products for 2 distinctive months, July and November. As observed there is a high spatial consistency between LAI from SEVIRI/MSG, MERIS/ENVISAT and MODIS/TERRA. The latter overestimates LAI at equatorial Africa, when compared to those obtained from the remaining sensors. SEVIRI/MSG LAI presents less gaps in vegetated areas.

2) Comparison with in situ measurements
Next Figure shows the comparison between FVC, LAI and fAPAR products estimated from MSG measurements with in-situ based maps obtained within the framework of the VALERI (Validation of Land European Remote sensing Instruments) project.
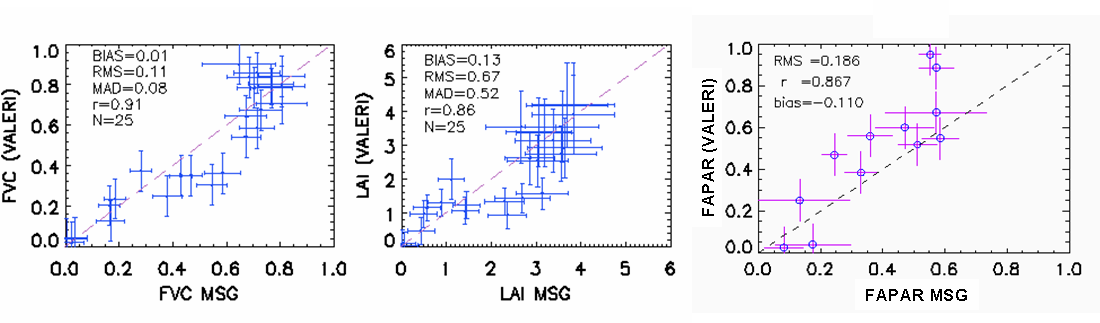
As shown in the figures above, LSA SAF products compare well with globally distributed VALERI* in-situ observations.
Further results on scientific validation of the LSA SAF vegetation products can be found on the LSA SAF VEGA Validation Report from 2017.
5.8 - Comparison of LSA SAF to Polar-Orbiter Derived Products and Applications
Since LSA SAF Vegetation Products are derived from geostationary satellite observations (MSG), they benifit from a high temporal sampling and therefore from a relatively high rate of cloud-free radiances per pixel. As a consequence these products have important advantages when compared with similar parameters derived from polar-orbiters, namely:
- Spatial Continuity;
-
Temporal Continuity;
- Better monitor the vegetation dynamics;
- Robustness against double-seasons false alarms;
- Extracting phenological parameters;
-
Spatial Continuity - As seen in 5.6 - Overall quality of LSA SAF Vegetation Products there are almost no gaps in Africa;
On the other hand, if we look at the percentage of gaps of polar-orbiter derived products over Africa, we can conclude that the occurrence of missing data is highly correlated with the cloud coverage, as demonstrated by next two figures:
-
First figure(*) presents the spatial distribution of the percentage of gaps of LAI derived from MODIS over Africa:
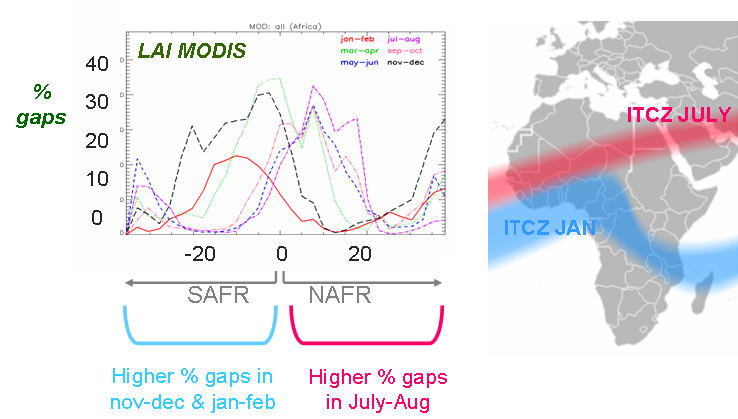
- the higher % gaps in South Africa occurs in nov-dec & jan-feb, which coincides with the position of the The Intertropical Convergence Zone (ITCZ);
- during July-Aug the ITCZ moves Northwards, wich results in an increase of clouds, and therefore in the percentage of gaps in North Africa region.
-
Next figure(**) shows equivalent results but for LAI-VEGETATION (VGT4Africa) product:

(*) and (**): Images on the left are taken from LSA SAF Biophysical Products FVC, LAI, FAPAR. F. Camacho, J.García-Haro , A. Verger, J. Meliá: Workshop on product availability for users in Africa, EUMETSAT, 27-28 August 2009. The images on the right have been adapted from http://en.wikipedia.org/wiki/File:ITCZ_january-july.png , accessed in 2010
-
First figure(*) presents the spatial distribution of the percentage of gaps of LAI derived from MODIS over Africa:
-
Temporal Continuity - In contrast to polar-orbiter derived products, LSA SAF vegetation products provide continuously-updated information about the vegetation, enabling to:
- better monitor the vegetation dynamics;
- For some regions with persistent cloud coverage as in western and Central Africa, polar orbiter estimates are missing for long periods, particularly during the growing season, limiting the ability to capture underlying modes of seasonality.
Next figure (source: LSA SAF VEGA Validation Report from 2017) shows the temporal evolution of LAI over 2006 and 2007 for the Dahra (Senegal), estimated from MSG, MODIS, MERIS and measured in-situ:
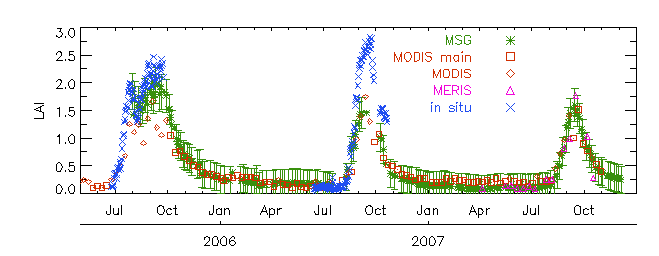
From this figure:
- LAI from MSG (LSA SAF) is the product showing less temporal gaps;
- LAI from MSG (LSA SAF) follows the seasonality of the vegetation activity during 2006 and 2007;
- Robustness against double-seasons false alarms:
In some regions a double season may occur (two vegetation peaks per year) and there is no a priory method to distinguish a real double season from a fake second season.
One important feature of the LSA SAF vegetation products is the ability to generate spatially coherent images of phenological parameters, such as:
- the amplitude;
- the maximum and minimum values;
- the timing of phenological stages (onset of greenness, maximum development, senescence);
- the growing season length.
In particular, the date of the start of growing season (SOS) is a critical parameter for food security monitoring. For deciduous plants the SOS is the time when new leaves start their development. Determining the SOS accurately using satellite remote sensing is essential to:
- determining the length of the growing period;
- an early assessment of the crop production.
The overall pattern through the year observed here appears to be in agreement with the climatic patterns in this region.
Similar outcomes for SOS based on NOAA rainfall estimate were obtained during year 2007 in this same region (Brown and de Beurs, 2008).
5.9 - Further Applications of LSA SAF Vegetation Products
In this section we will show how vegetation products can be used for a wide range of land biosphere applications that are directly related to vegetation properties and health.
5.9.1 - Estimation of Vegetation productivity
Vegetation productivity along the Kalahari transect:
The Kalahari Transect (KT), is one of the International Geosphere-Biosphere Programme (IGBP) (accessed in 2010) proposed Transects.
It spans a strong climatic gradient in southern Africa, from the arid south to the humid north, while remaining on a single broad soil type, the deep sands of the Kalahari basin.The vegetation ranges over the length of the transect from shrubland through savannas and woodlands to closed evergreen tropical forest, with land uses ranging from migratory wildlife systems, through pastoralism, subsistence cropping to forestry.
The aim to define this transect was to:
- integrate ongoing and future biophysical and relevant socio-economic work in the Kalahari eco-region;
- to enhance understanding of the entire system within the context of human and climatically induced environmental change.
5.9.2 - Dry Matter Productivity
Dry Matter Productivity (DMP) is the increase in dry matter biomass. Its estimation is useful for:
- Crop monitoring;
- Yield forecasting;
- Carbon sequestration / Net Primary Productivity (NPP)
The Joint Research Center (JRC) is computing this parameter following the approach proposed by Monteith (1972) (LSA SAF 3rd User Training Workshop), in which DMP is a function of the:
- Incoming solar radiation (0.2-3.0 μm);
- Surface Temperature;
- fAPAR
Next figure shows the comparison between DMP as estimated by JRC, based on fAPAR from SPOT and MSG, in a north-south transect through Africa along the 20 °E meridian, from Lybia (left of the graphic) to Cape Town (right of the graphic). The example is for the 3rd decade of February 2008 and shows very good spatial consistency between the two estimated fields.
![]()
5.9.3 - Drought Monitoring
DROUGHT OVER EUROPE
The 2021 Summer was very warm and several regions, such as the eastern Mediterranean area, were also affected by drought conditions. In late July, a strong 'blocking high' pressure system was formed over southeastern parts of Europe, increasing dry conditions and causing an intense heatwave with exceptionally high temperatures initially across the eastern and central Mediterranean areas and the Balkans. Satellite observation revealed that vegetation is under stress conditions, presenting lower greenness (NDVI) than usual (brown regions).
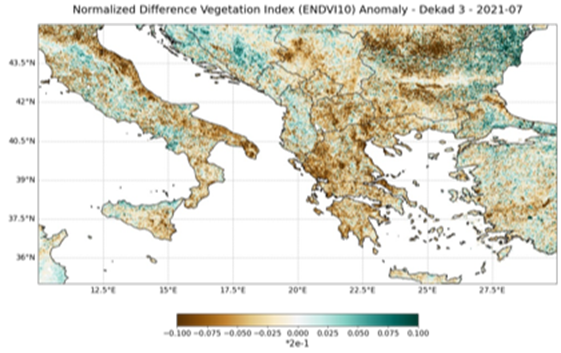
https://fire.trainhub.eumetsat.int/docs/figure1_LSA_SAF_NDVI.html