Chapter II: Physical concepts
2 - Physical concepts
In this chapter we make a revision of the physical concepts that support the monitoring of vegetation with satellite observations.
2.1 - Radiation principles
The Sun is the main source of energy in the earth-atmosphere system, irradiating electromagnetic energy in a wide range of wavelengths. According to Planck's law, all bodies with temperature above 0 K emit electromagnetic radiation. A black body at Temperature T emits radiation according to equation 2.1:
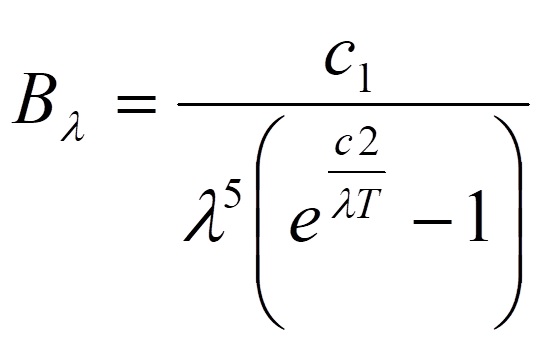
Where:
Bλ (Wm-3) = energy emitted at a given wavelength λ (m);
c1 and c2 are constants (3.74x10⁻¹⁶ Wm2 and 1.44x10⁻¹² mK, respectively).
The spectral distribution of the emitted radiation of a body (B as a function of λ) can be obtained by applying the Planck function at a given temperature T and considering a range of possible wavelengths.
2.1.1 - Solar radiation
For the case of the Sun, and considering its temperature at approximately 6000 K, we can plot its emitted radiance as a function of the wavelength (Figure 2.1):
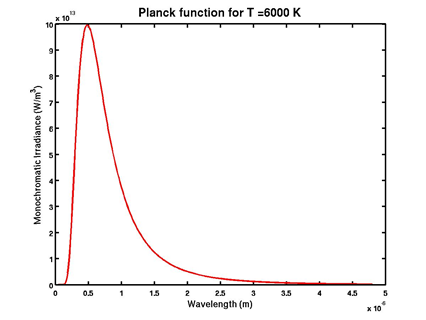
Figure 2.1: Blackbody radiance curve for the sun at 6000 K
2.1.2 - Visible light and thermal radiation
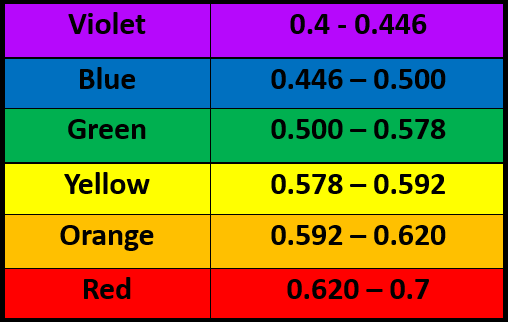
The visible region of the electromagnetic spectrum, commonly called visible light, is the portion of the electromagnetic spectrum that is visible to (can be detected by) the human eye. Within this region, the longest wavelength is red and the shortest is violet. Table 2.1 lists the common wavelengths of what humans perceive as colours within visible light:
Table 2.1: List of visible wavelengths (units: micrometer, µm)
Up to now we have seen that electromagnetic radiation emitted from a body at a certain wavelength is determined by its temperature. The most relevant features of the solar emitted radiance have been revised.
Having in mind that objects at the surface of the Earth are at lower temperatures than the Sun, should we expect them to emit radiation with characteristics similar to those of solar irradiance?
Figure 2.2 shows the spectral distributions of radiation emitted both by the Sun and the Earth considered to be at a mean temperature of about 300 K (close to the temperature of most objects at the surface of the Earth).
Figure 2.2: Spectral irradiance for the Sun and the Earth (credit: Ritter, Michael E. The Physical Environment: an Introduction to Physical Geography.)
This figure shows significant differences of terrestrial radiation when compared to solar irradiance:
- The peak of terrestrial irradiance is located at about 10μm, in the thermal infrared region;
- The most significant fraction of terrestrial irradiance occurs between [3 - 100μm] (longwave radiation);
So all objects emit radiation (as far as their temperature is above the absolute zero). But emissions from objects at the Earth surface occur mostly at wavelengths at which our eyes are unable to see.
In summary:
- Earth objects emit radiation at long wavelengths.
- Human eyes are only sensitive to short wavelengths (only emitted by the Sun).
So the question is, how can we see the objects? And why do we distinguish different colours?
To answer these questions we must understand how radiation interacts with matter.
2.2 - Interactions with matter
When electromagnetic energy hits a target three different interactions may occur, as illustrated in Figure 2.3:
![]()
Figure 2.3: illustration of the different possible interactions between radiation and a surface feature.
So from the incident light on a surface, there may be a fraction which is transmitted, another which is absorbed, and a third fraction that is reflected. This portion of reflected radiation is the reason why we can actually see the objects. Moreover, the colour of the object results from the combination of wavelengths of the reflected portion of light bouncing off the object, as illustrated in the figures 2.4 and 2.5.
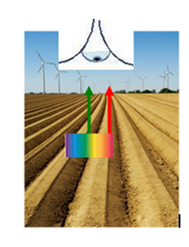
Figure 2.4: More green and red wavelengths reflected -> The soil looks yellow-brown
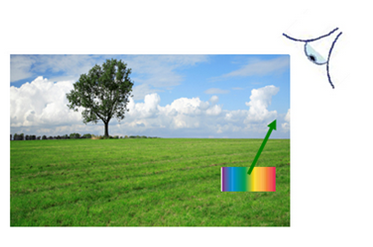
Figure 2.5: More green wavelengths reflected -> The grass looks green
This principle is applied while making composites of satellite images. An RGB true colour image is a composite of satellite images using red, green and blue spectral channels. The result is an image that has the same appearance as seen from human eyes.
Figure 2.6 is an example of a true colour RGB Image of the earth showing the ongoing eruption of Chile's Chaitén Volcano, in a region with different types of soil, as well as a variety of bluish tones in sea water.
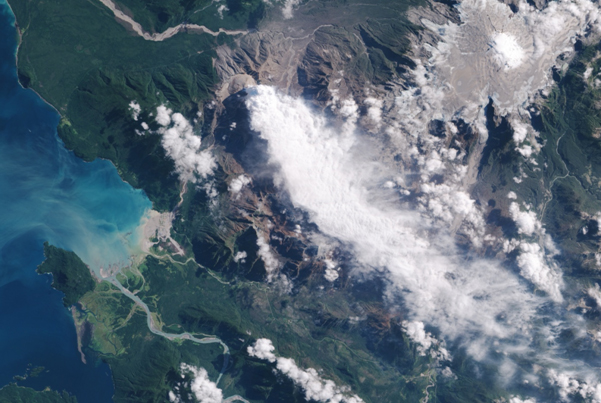
Figure 2.6: True colour image taken on March 6, 2009 with the Advanced Land Imager on the Earth Observing-1 (EO-1) satellite over South America (Image from http://earthobservatory.nasa.gov/NaturalHazards/).
While sensing vegetation from space, we will be interested in the reflectance mechanism. Reflectance is usually expressed as a fraction of the total amount of energy striking an object, taking the values:
- 1 - if all of the incident radiation bounces off and is detected by the sensor;
- 0 - if no light returns from the surface
In most cases, the reflectance value of an object for any region of the electromagnetic spectrum is somewhere between these two extremes.
2.3 - The effect of the atmosphere
So interaction of light with objects allows us to see them. But what affects radiation reaching a sensor at the top-of-atmosphere? What is the contribution from the surface? How does radiation interact with the atmosphere?
Exercise: Please look at next figure showing the spectral distribution of the solar radiation both at the top of the atmosphere (TOA) and at ground level. Can you select the proper legend to the figure, from the two options below?
Next figure illustrates what happens to solar radiation in its transmission through the atmosphere:
As you can see, solar radiation is attenuated by:
- Reflection (by clouds and atmospheric constituents);
- Absortion (by atmospheric constituents)
What are the atmospheric constituents causing this attenuation of solar radiation? Do they act equally for the all regions of the electromagnetic spectrum?
2.3.1 - Absorption bands and atmospheric windows
Figure 2.8 shows the absorption spectra for the various atmospheric gases between the top of the atmosphere and the earth's surface, as a function of the wavelength, namely:
- The tropospheric nitrous oxide (N2O) and methane (CH4), which have absorption bands in the infrared. Nevertheless, their concentrations are too low to have a significant impact.
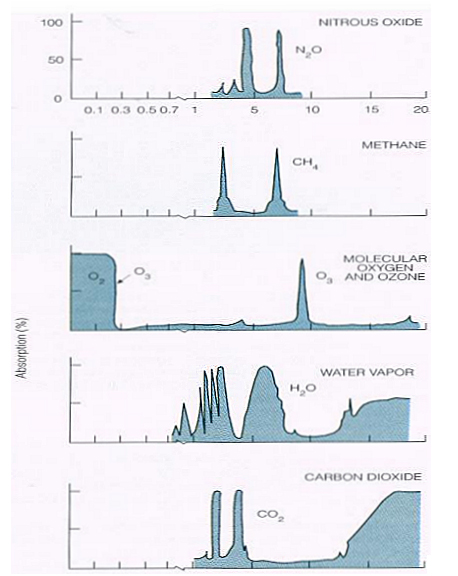
Figure 2.8: Absorption spectra for various atmospheric gases (adapted from Peixoto and Oort, 1992)
EXERCISE LOST DUE TO FLASH DISCONTINUATION
To answer to this question you should have mentally combined the individual effects of the atmospheric gases. This corresponds to Figure 2.9:

Figure 2.9: Impact of the atmospheric gases on solar radiation (adapted from Peixoto and Oort, 1992)
The spots you selected are called atmospheric windows, where radiation is allowed to pass through the atmosphere with little attenuation (transmissivity is high and absortivity is low). It is through these windows that satellites observe the surface of the Earth on the visible and/or infrared regions of the electromagnetic spectrum.

The areas of the electromagnetic spectrum where radiation is most absorbed are known as absorption bands.

The solar energy that is able to pass through the atmosphere will reach the surface of the earth and interact with the surface features through the same mechanisms of reflection, absorption and transmission.
2.4 - Spectral signature of an object
The reflectance values for different objects, over a range of wavelengths, may be plotted for comparison. Such plots are called "spectral response curves" or "spectral signatures." Differences among spectral signatures of landscape features are used to help classifying remotely sensed scenes, since the spectral signatures of similar features have similar shapes.
Figure 2.10 shows the spectral signatures of 3 different materials: conifers (in green), water (blue) and soil (red).

Figure 2.10: Spectral response curves for 3 different types of features on the surface of the Earth.
The previous figure implies that the mentioned feature types are normally spectrally separable. The degree of separation of landscape features depends, however, on the range of wavelengths we are considering. This means that two features may be indistinguishable for a certain spectral range and perfectly individualized for other spectral band.
2.5 - Bidirectional reflection
So far we have seen that the visual perception of colour is related to the differential absorption/reflection of radiation by an object in the different regions of the electromagnetic spectrum. But why do we perceive different intensities of light? What is the physical explanation for the creation of patterns of light and dark?
The concept of bidirectional reflection helps explain why objects look different under different lighting conditions and viewing angles, and it is crucial for remote sensing image interpretation. The term Bidirectional Reflectance Distribution Function (BRDF) quantitatively describes how light is reflected at different angles of incidence and reflection, considering the physical properties of the material and the roughness of the surface. The key elements of Bidirectional reflection are:
- Angle of incidence: This is the angle at which incoming light rays strikes the surface.
- Angle of Reflection: This is the angle at which light rays leave the surface after reflection. In a perfect mirror-like (specular) reflection, the angle of reflection is equal to the angle of incidence. Surfaces that are not perfectly smooth scatter light in different directions.
- Reflectivity of the Surface: Surfaces differ in the way they reflect light. Some are specular (like a mirror), some are diffuse (like matte paint), and many are a combination of both. These characteristics are captured in the BRDF.
Sun glint (Figure 2.11) is the result of specular reflection, where light rays are reflected at an angle equal to the angle of incidence. This type of reflection is different from diffuse reflection, which scatters light in many directions and is typical for rough surfaces.
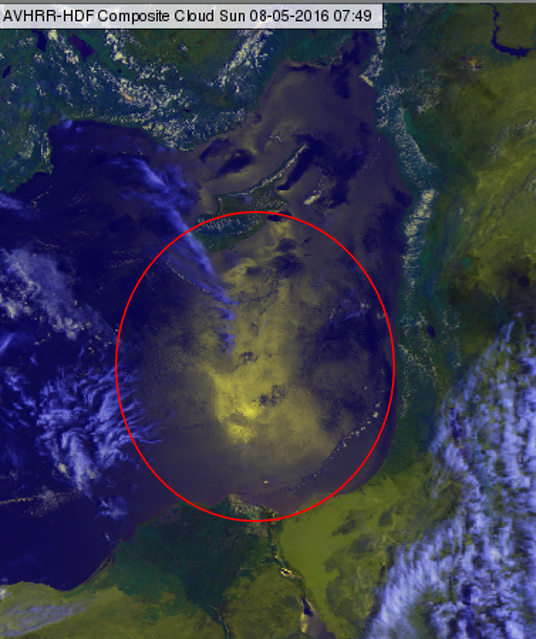
Figure 2.11: Sun glint over the east Mediterranean on 8 May 2016 at 07:49 UTC
2.5.1 - BRFDs
The measured surface reflectance depends on the configuration: sun position - observation geometry.
First think of a geostationary satellite, located at fixed position above the Earth. For each individual pixel only the Sun geometry varies from slot to slot.
For the case of polar orbiters, (normally sun-synchronous) it is mainly the satellite observation angles that change between observation slots of the same region.
This means that reflectance values measured with geostationary or polar satellites need to be corrected for directional effects. Such corrections may be easily performed if the Bidirectional Reflectance Distribution Functions (BRDF) are known. The BRDF model describes reflection behavior for all possible combinations of sun-viewing geometries. The characteristics of the BRDF will determine what "type" of material the viewer thinks the displayed object is composed of.
Among the several Bi-directional Reflectance Distribution Functions proposed by different authors, the one by Roujean et al. (1992) has been extensively used for vegetation parameters estimations:
ρ (θs, θv, φ) = K0 + K1 x F1(θs, θv, φ) + K2 x F2(θs, θv, φ)
F1 and F2 are functions, called kernels, which only depend on the angular configuration of aquisition:
- θs is the sun zenith angle;
- θv is the satellite zenith angle
- φ is the relative azimuth angle between sun and satellite
The K coefficients quantify the respective contribution of each kernel to the whole BRDF and are derived by model inversion.
- K0 corresponds to isotropic reflectance, i.e. reflectance values directionally normalised to reference illumination and observation zenith angles of 0°. This geometry leads to a minimum of the shadow proportion (hotspot geometry);
- K1 and K2 represent angular distribution related to geometric (caused by diffuse reflectors) and volumetric (caused by volume scatter reflectors) surface scattering processes.
The isotropic, geometric and volumetric components of surface reflectance are intrinsically linked to the amount and state of vegetation, canopy structure and to the leaf and soil optical properties, as you will see in more detail in chapter 5.