5.8 - Comparison of LSA SAF to Polar-Orbiter Derived Products and Applications
Since LSA SAF Vegetation Products are derived from geostationary satellite observations (MSG), they benifit from a high temporal sampling and therefore from a relatively high rate of cloud-free radiances per pixel. As a consequence these products have important advantages when compared with similar parameters derived from polar-orbiters, namely:
- Spatial Continuity;
-
Temporal Continuity;
- Better monitor the vegetation dynamics;
- Robustness against double-seasons false alarms;
- Extracting phenological parameters;
-
Spatial Continuity - As seen in 5.6 - Overall quality of LSA SAF Vegetation Products there are almost no gaps in Africa;
On the other hand, if we look at the percentage of gaps of polar-orbiter derived products over Africa, we can conclude that the occurrence of missing data is highly correlated with the cloud coverage, as demonstrated by next two figures:
-
First figure(*) presents the spatial distribution of the percentage of gaps of LAI derived from MODIS over Africa:
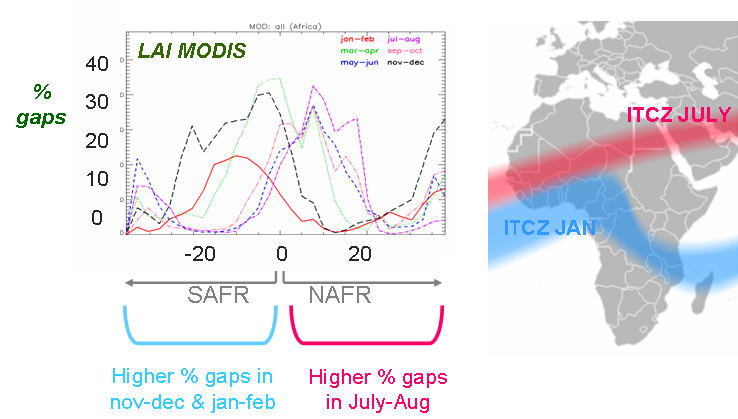
- the higher % gaps in South Africa occurs in nov-dec & jan-feb, which coincides with the position of the The Intertropical Convergence Zone (ITCZ);
- during July-Aug the ITCZ moves Northwards, wich results in an increase of clouds, and therefore in the percentage of gaps in North Africa region.
-
Next figure(**) shows equivalent results but for LAI-VEGETATION (VGT4Africa) product:

(*) and (**): Images on the left are taken from LSA SAF Biophysical Products FVC, LAI, FAPAR. F. Camacho, J.García-Haro , A. Verger, J. Meliá: Workshop on product availability for users in Africa, EUMETSAT, 27-28 August 2009. The images on the right have been adapted from http://en.wikipedia.org/wiki/File:ITCZ_january-july.png , accessed in 2010
-
First figure(*) presents the spatial distribution of the percentage of gaps of LAI derived from MODIS over Africa:
-
Temporal Continuity - In contrast to polar-orbiter derived products, LSA SAF vegetation products provide continuously-updated information about the vegetation, enabling to:
- better monitor the vegetation dynamics;
- For some regions with persistent cloud coverage as in western and Central Africa, polar orbiter estimates are missing for long periods, particularly during the growing season, limiting the ability to capture underlying modes of seasonality.
Next figure (source: LSA SAF VEGA Validation Report from 2017) shows the temporal evolution of LAI over 2006 and 2007 for the Dahra (Senegal), estimated from MSG, MODIS, MERIS and measured in-situ:
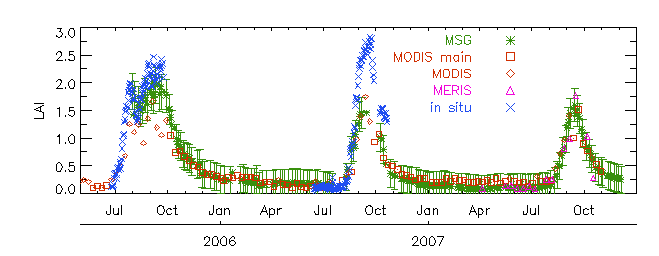
From this figure:
- LAI from MSG (LSA SAF) is the product showing less temporal gaps;
- LAI from MSG (LSA SAF) follows the seasonality of the vegetation activity during 2006 and 2007;
- Robustness against double-seasons false alarms:
In some regions a double season may occur (two vegetation peaks per year) and there is no a priory method to distinguish a real double season from a fake second season.
One important feature of the LSA SAF vegetation products is the ability to generate spatially coherent images of phenological parameters, such as:
- the amplitude;
- the maximum and minimum values;
- the timing of phenological stages (onset of greenness, maximum development, senescence);
- the growing season length.
In particular, the date of the start of growing season (SOS) is a critical parameter for food security monitoring. For deciduous plants the SOS is the time when new leaves start their development. Determining the SOS accurately using satellite remote sensing is essential to:
- determining the length of the growing period;
- an early assessment of the crop production.
The overall pattern through the year observed here appears to be in agreement with the climatic patterns in this region.
Similar outcomes for SOS based on NOAA rainfall estimate were obtained during year 2007 in this same region (Brown and de Beurs, 2008).