Example: 28 July 2005: A case of DMC over northern Austria

Figure 5: Deep moist convection seen from the ground. Cirrus clouds indicate that convective activity has reached the ice phase.
These synoptic charts from 28 July 2005 show a cold front over Spain and France and a warm front over Germany and the Czech Republic (Figure 6a and 6b). Austria lies within the warm sector.
a) 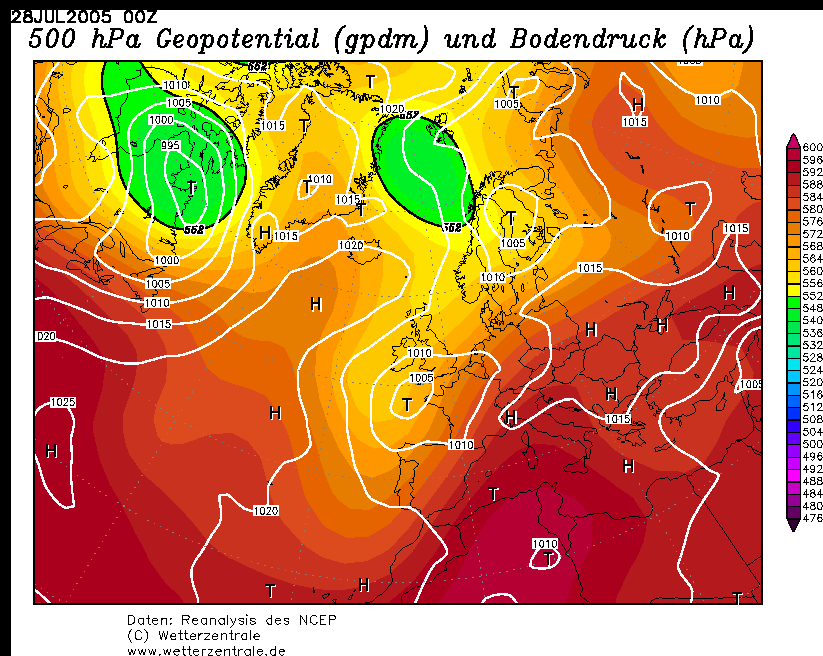 |
b) 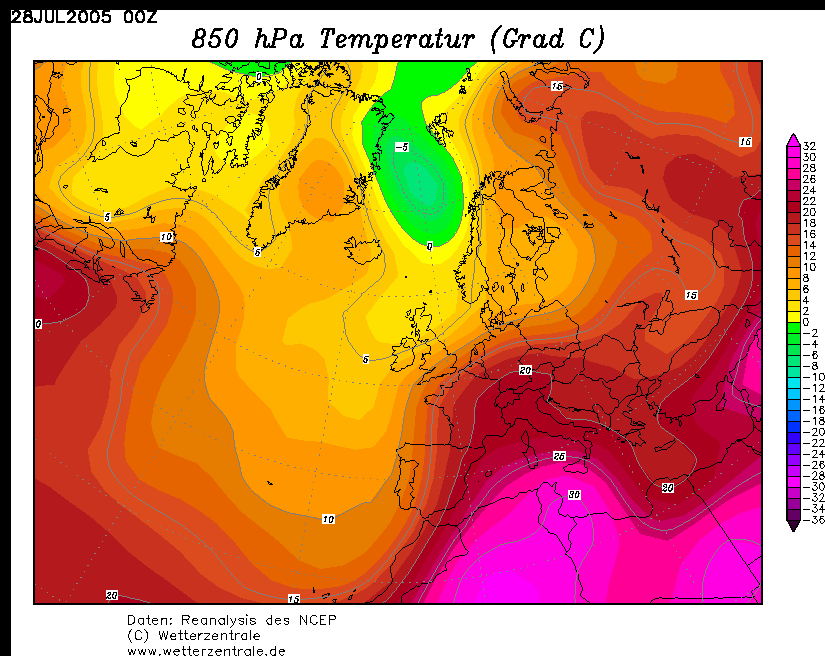 |
Figure 6a and 6b: Reanalysis from NCEP: 500 hPa geopotential (left) and 850 hPa temperature (right).
The 28 July 2005 case is ideal for demonstrating the onset of DMC at a WV boundary. The distinct black stripe extends from Italy to Poland and crosses Austria (figure 7b). There is no significant frontal circulation over central Europe.
a) 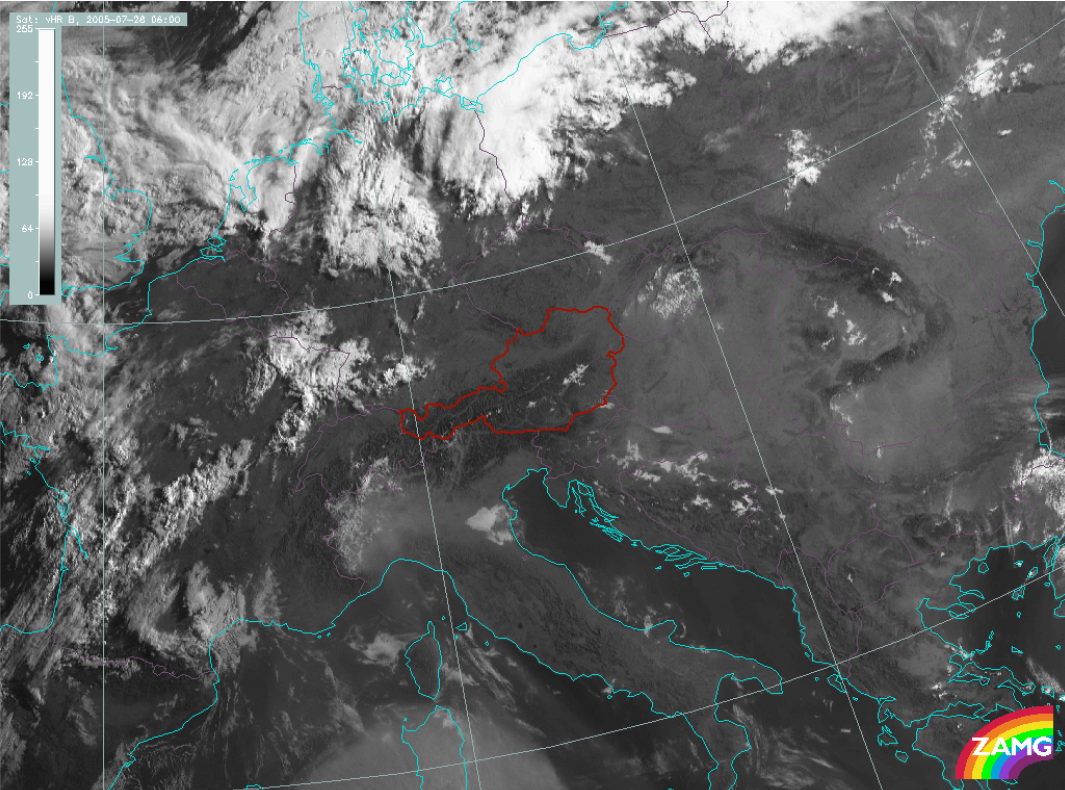 |
b) 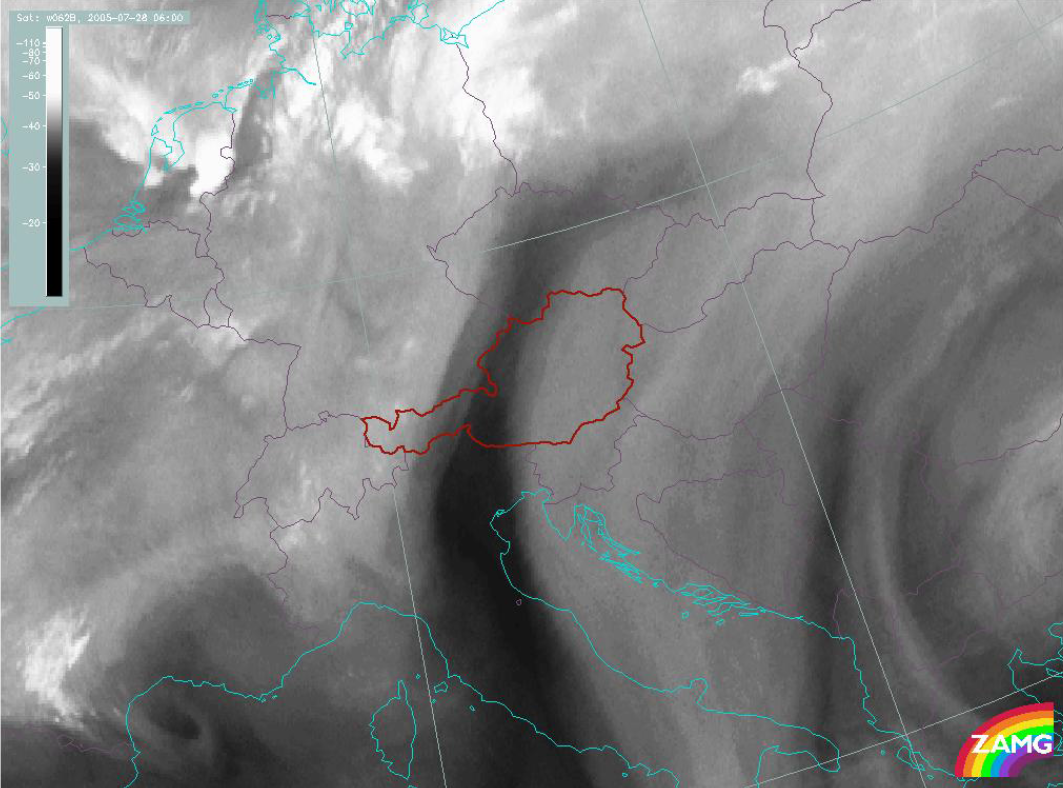 |
Figure 7a and 7b: HR-VIS (left) and WV 6.2 µm satellite image (right) from 28 July 2005, 12:00 UTC.
The HR-VIS image on the left side (figure 7a) makes it possible to detect even shallow convection over the Alps and their surroundings. In the MSG WV 6.2 µm channel, only DMC reaching above the height of 500 hPa appears as bright white spots (figure 8).

Figure 8: WV 6.2 µm satellite image loop from 28 July 2005 from 08:00 to 19:00 UTC.
The WV 6.2 µm loop above depicts the initiation of DMC in the north-eastern parts of Austria, right within the transition zone between moist and dry troposphere. A few hours later DMC starts at the opposite boundary south of the first convective cell. The larger convective cells over France and Germany belong to the frontal zone and are subject to different processes that also initiate convection. The convective cells developing over Romania are mainly triggered by the Carpathian Mountains.
It might be worthwhile to look at NWP fields to get a better insight into the physical processes accompanying convection at WV transition zones. As seen in the previous chapters, WV black stripes often result from descending stratospheric air and exhibit a lower dynamic tropopause. This also limits the vertical extension of convection. Figure 9 depicts the height of the PV=1.5 PVU surface. DMC appears in the crowding zone of the isobars on this surface.
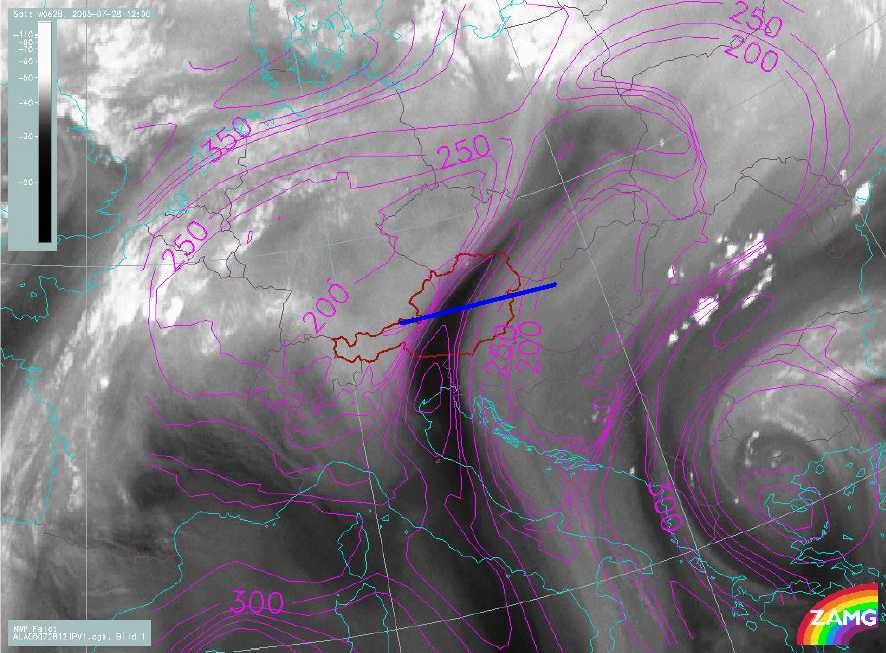
Figure 9: MSG WV 6.2 µm satellite image with PV=1.5 PVU surface from the ALADIN model. The blue line indicates the position of the vertical cross section in figure 13.
The vertical cross section shown in figure 10 shows the PV=1.5 PVU surface reaching down to 300 hPa in the area of the black stripe.
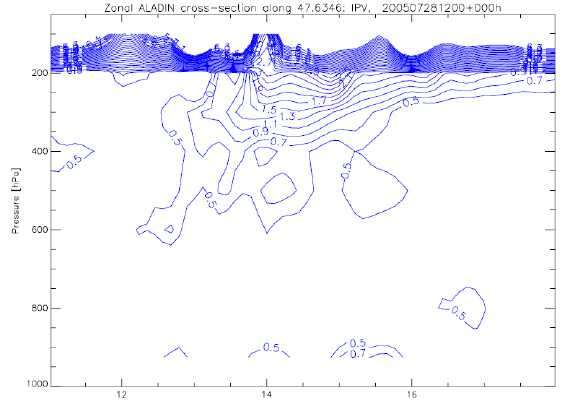
Figure 10: 28 July 2005, 12:00 UTC, ALADIN zonal vertical cross section. Positive values of potential vorticity: solid blue lines. Values of PV=1.5 PV units at a level of about 300 hPa indicate the dry intrusion of the WV dark stripe.
The ALADIN humidity field at 300 hPa reflects the dry zone in the WV 6.2 µm satellite image (figure 11). Relative humidity of 10% coincides with the dark stripe.
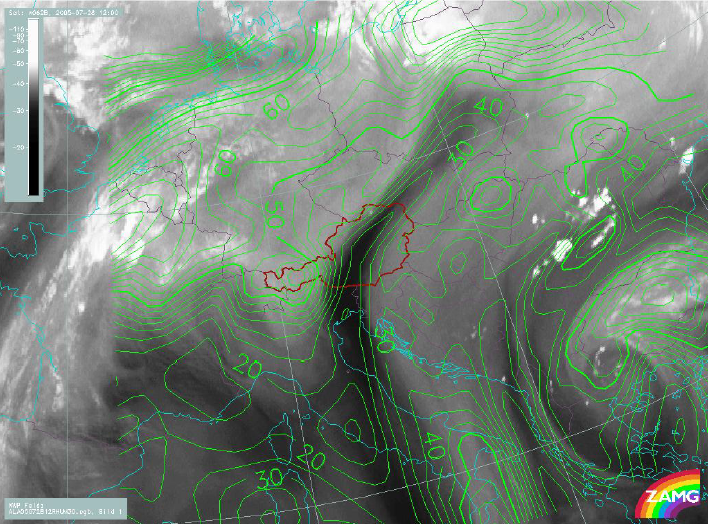
Figure 11: MSG WV 6.2 µm, 28 July 2005, 12:00 UTC, relative humidity at 300 hPa.