Black stripes
Water vapor images depict atmospheric flows much better than visible or infra-red images. The distribution of humid and dry regions depends not only on vertical motion in the troposphere but also on the horizontal movement of air (figure 1). Humidity acts as a tracer, reflecting upper air streams above 600 hPa.
Figure 1: WV 6.2 µm image from 18 December 2012 at 12:00 UTC and wind vectors at 400 hPa.
Black stripes in WV images result from the subsidence of dry stratospheric air and are often associated with jet streaks. The jet stream axes are oriented along the moisture gradients in WV images. The orientation of the dark stripe on the cold side of the jet corresponds to the orientation of the jet axis.
Jet streams are located along the thermal gradient of the polar front. Jet streaks (maxima of wind speed within the jet stream) can be observed at the rear side of cold fronts, ahead of warm fronts and along the rear sides of upper level troughs.
As can be seen in figure 2, not all moisture gradients and black stripes in WV images coincide with jet streams. Additionally, there has to be a strong gradient in the geopotential of the 1.5 PVU surface.
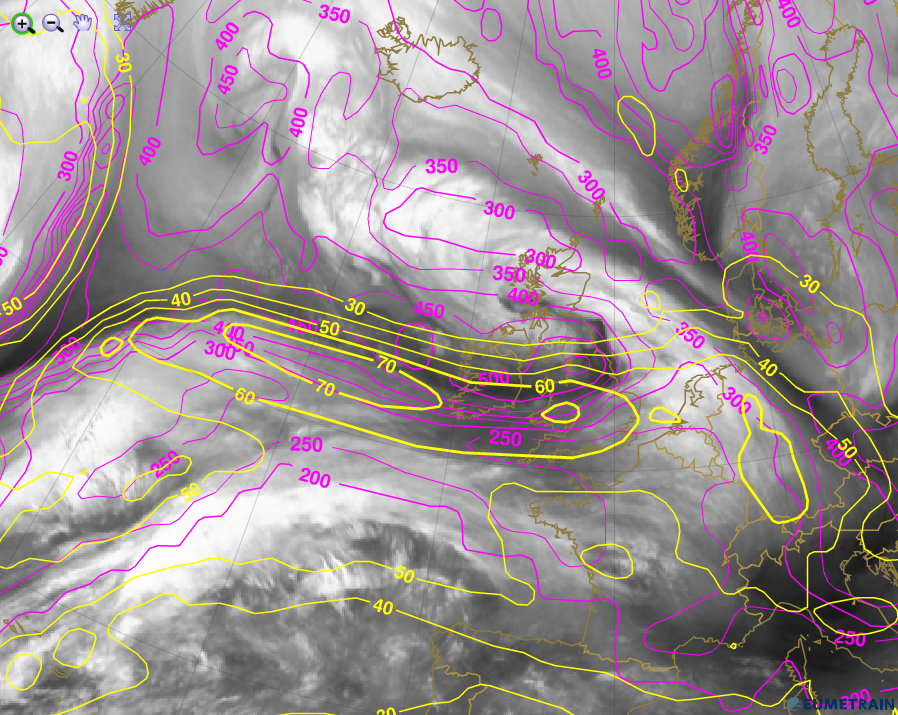
Figure 2: WV 6.2 µm image from 31 January 2013 at 06:00 UTC. Magenta isolines depict the height of the PV=1.5 PVU surface, yellow isolines depict the isotachs of the polar jet at 300 hPa.
In WV imagery, the dark, dry zones located near jet streaks usually correspond to the cold side of the jet axis. In the case of a classic cold front, the jet axis is oriented along the back of the frontal zone, showing as a moisture boundary within the cold, sinking air mass. The highest wind speeds in the upper troposphere are located at these moisture boundaries.
These boundaries not only contrast sharply in WV imagery near polar frontal zones (see figure 3), but they are also visible at the back of upper level troughs and near baroclinic boundaries or upper level fronts.
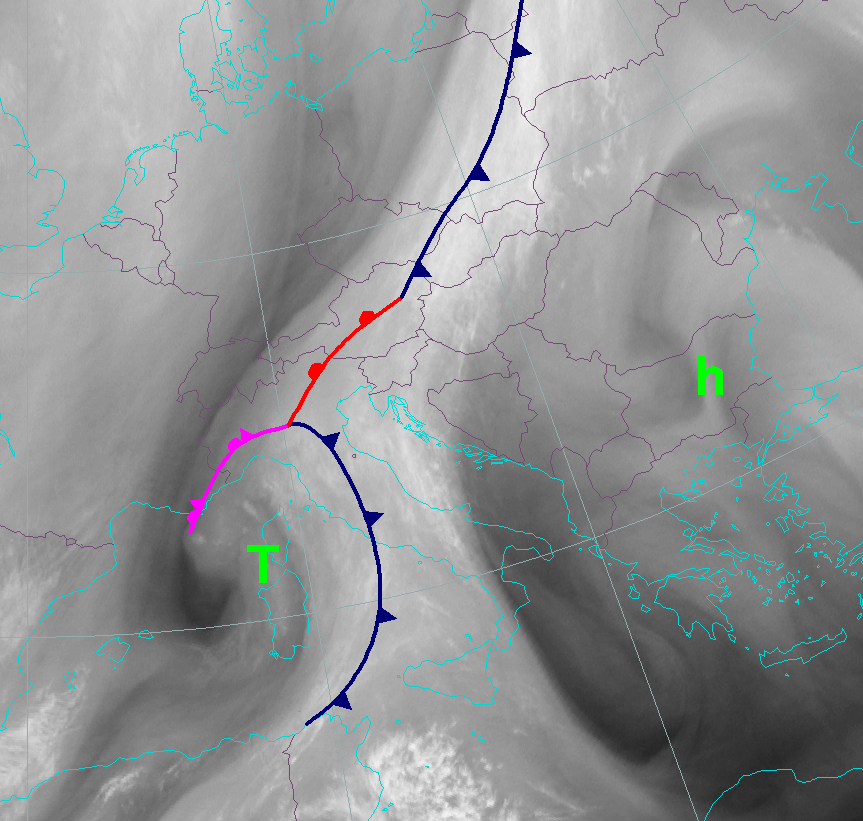
Figure 3: Surface analysis of a frontal system over central Europe superimposed over the WV 6.2 µm image from 2 January 2013 at 12:00 UTC.
In Polar Regions, the black stripes are less distinct in images taken by geostationary satellites. For the most part, the following three reasons are responsible for this effect:
- The tropopause is lower than in mid-latitudes; hence moisture gradients may be below the main contribution levels of the WV spectral channels
- The geostationary MSG satellite sees polar regions from a strongly inclined angle, resulting in a blurred image without sharp moisture contrasts.
- Due to the cold temperatures, the moisture content of the troposphere is much lower than in mid-latitudes.
In mid-latitudes, the position of the jet axis is well reflected by sharp boundaries in the WV image. While IR images also give information on the presence of strong upper level winds (e.g. cirrus fibers), WV images indicate the position of the jet axes. This information can be used when comparing the NWP output of the jet axis with the actual position of the WV boundary. Deviations between the position or the structure of the WV boundary and the model-derived jet axis can be an indication of the model being inaccurate. This is the most important way of using WV imagery in weather forecasting (see also chapter 9 on real and simulated WV imagery).
a) 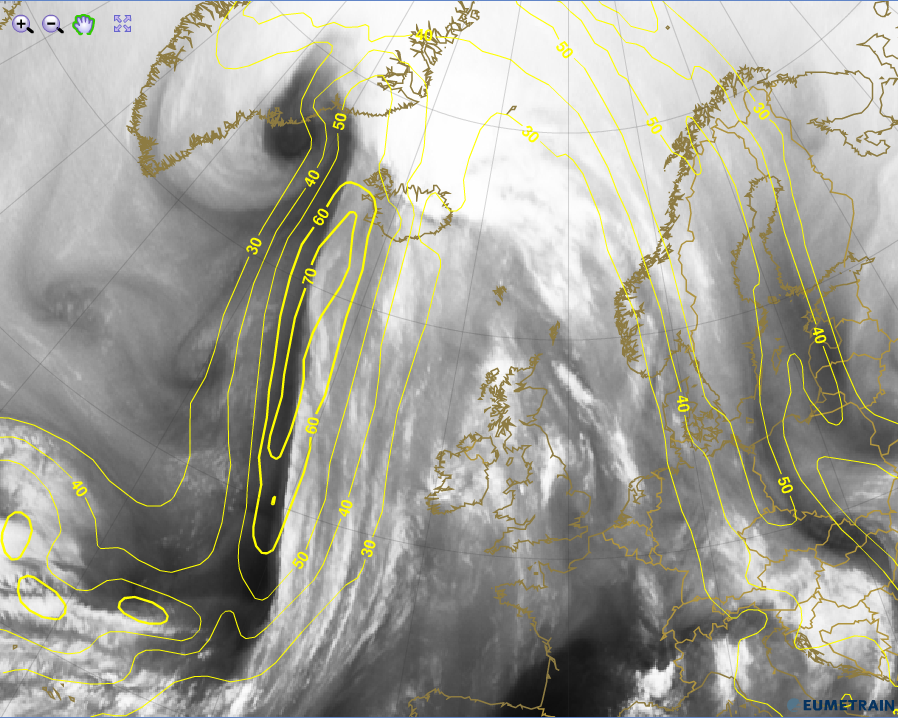 |
b) 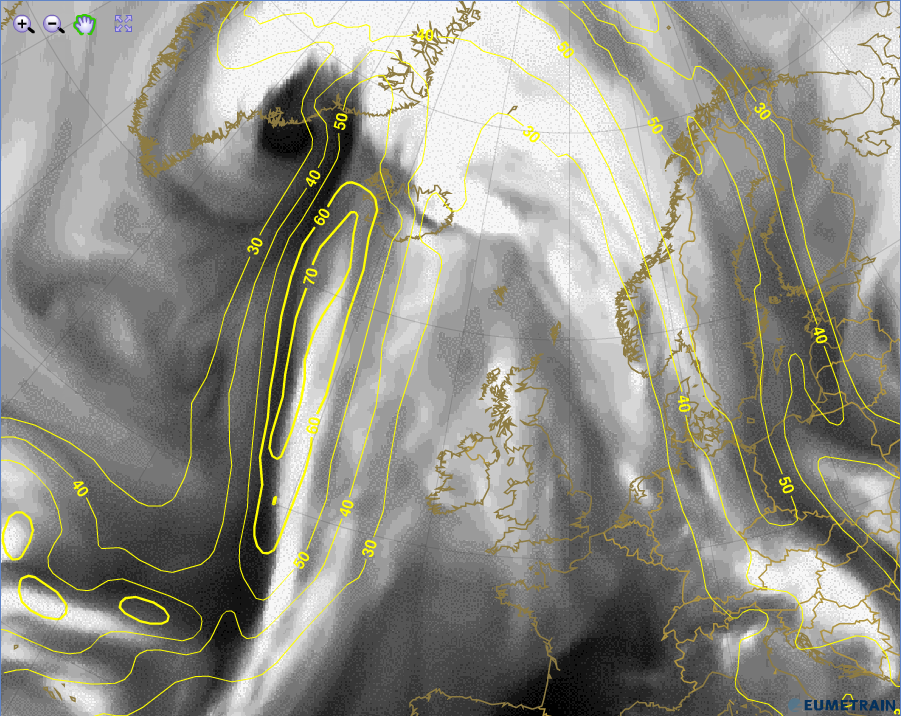 |
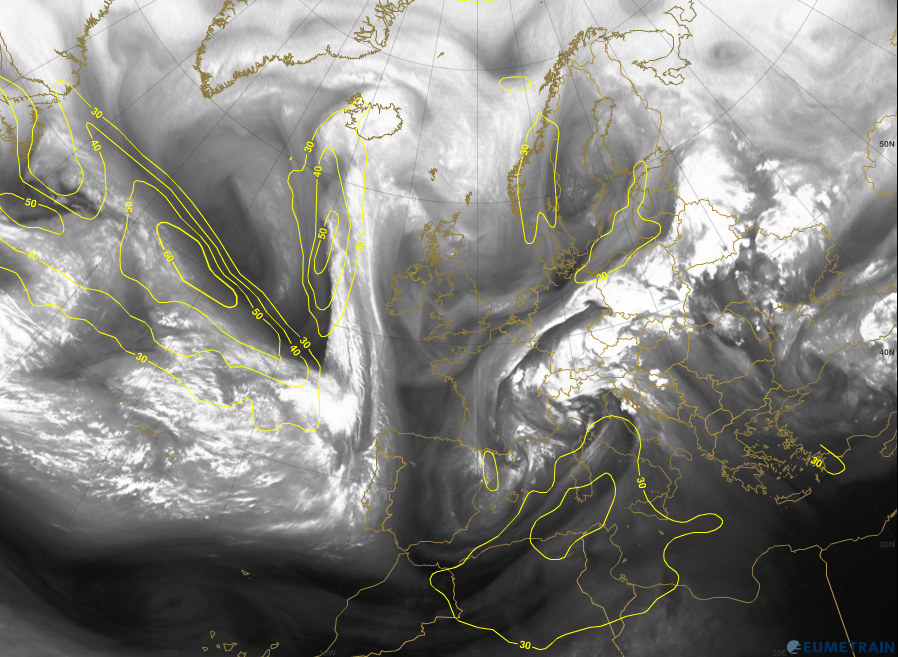
Figures 4a and 4b show a real WV 6.2 µm (left) and a simulated WV 6.2 µm (right) satellite image. The yellow isolines depict the isotachs at 300 hPa.
Question
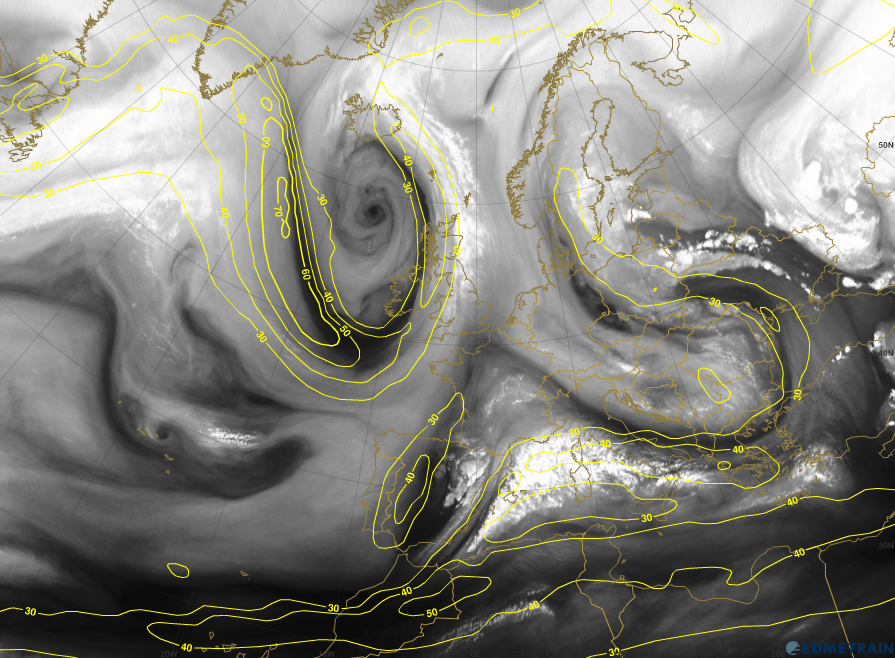
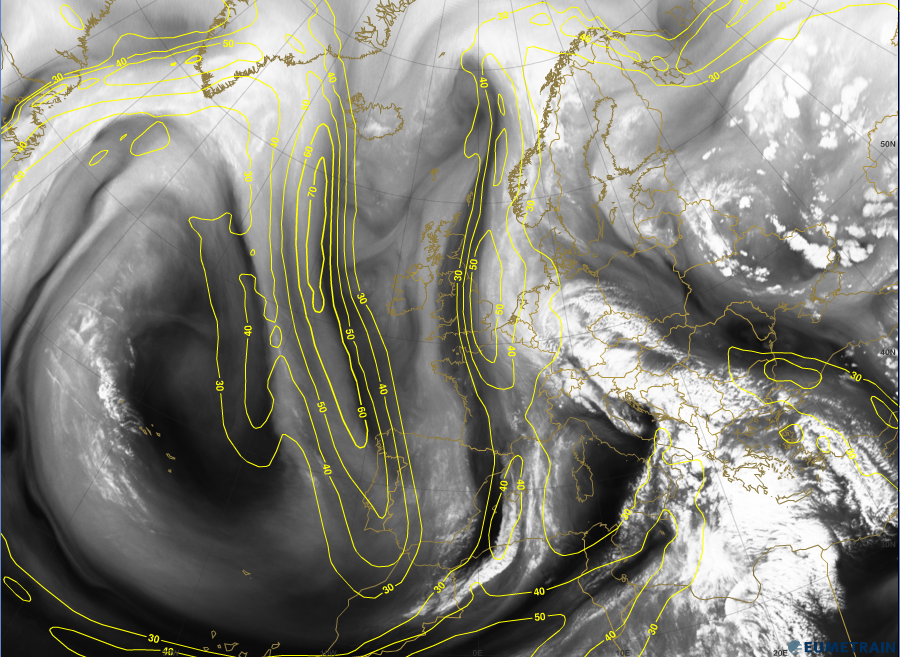
In the next three images (WV 6.2 µm) click on where you think the jet streak is.
- Solution: Click here for the WV image with isotachs at 300 hPa.
- Solution: Click here for the WV image with isotachs at 300 hPa.
- Solution: Click here for the WV image with isotachs at 300 hPa.