Appearance in Satellite Data
Satellite products prove to be one of the most powerful and useful tools in identifying and tracking the movement of cold fronts around South Africa. Combination imagery, such as the Airmass RGB and the Day Microphysical RGB give clues as to the intensity of the cold fronts, the cloud types associated with them, the state of the atmosphere and airmasses to the east and west of the cold fronts. Satellite products can also show whether the middle and upper troposphere are favorable for intense frontal weather. Satellite imagery from geostationary satellites is also available 24 hours per day, and makes the tracking and placement of cold fronts more accurate.
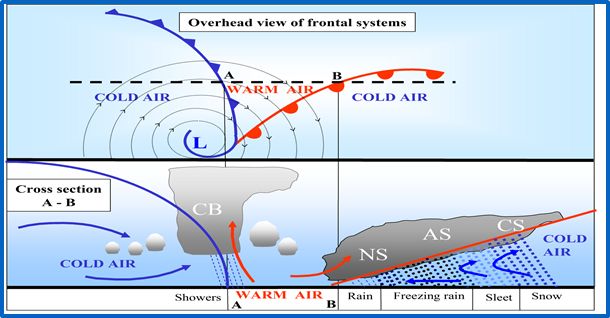
A typical vertical cross section of the cloud types associated with a cold front is given below. The unstable cloud is mostly associated with the cold front, while the more stable/layered cloud can be found around the warm front.
 |
Using the Airmass RGB, one must look for the main cloud band associated with the cold front. Sometimes it is easiest to start by finding the vortex of the low pressure associated with the front and then following the "tail" of the cold front from there. The cloud band associated with the cold front will mostly appear as a bright white cloud band, indicating the presence of cold cloud, or a more mustard or dull yellow colour, indicating mid level cloud (area A on the image). The bright white, cold clouds are mostly cumulonimbus cloud found along the cold front boundary (mainly far south of Africa) , as a result of convergence and upward motion in that area (area B on the image). The upper level trough associated with the surface front will also enhance the convective development because of upper divergence in the area above the surface front. The airmass RGB will also help in identifying the warmer, low level cloud as a smoother, more homogenous, green (high amount of upper level humidity) or yellow colour (low amount of upper level humidity) seen in area C on the image. The red colour is an indication of high values of upper level potential vorticity, which is normally associated with an upper level trough or low pressure system (Area D on the image). The deep blue colour on the RGB depicts low level cold air, and is normally found coincident with or slightly westward of the cold front (area E on the image).
The High Resolution Visible channel can be used to accurately place the surface cold front during daylight hours, and to identify small scale cloud and land features. Ahead of the cold fronts that pass over the southern parts of South Africa, one will often be able to identify mountain and gravity waves in the cloud structures (Area A on the image). When the winds at the mountain tops are perpendicular to the mountains, mountain waves develop in the stable atmosphere to the east of the front. Snow on the mountains and fog on the ground are also clearly visible in this channel. Fog will appear as a smooth white/grey cloud, while snow will be bright white and follow the contours of the topography, as seen south-east of Lesotho in this case. The cumulonimbus cloud associated with the cold fronts can also be identified accurately as bright white, cellular shaped cloud. In this example, the cold front is identified by the grey/white band of thick cloud to the south west of South Africa (Area B on the image).
By making use of the Day Microphysical RGB during daylight hours, many cloud and land features are visible to the user. Phenomena such as fires are easily identifiable by the bright cyan coloured pixels (area A on the image). Fires are common over South Africa during the winter months and more likely to occur ahead of the approaching cold fronts due to the increase in wind speeds during that time. The Day Microphysical RGB makes the identification of low level stratus, stratocumulus, cumulus and cumulonimbus possible. Stratocumulus appears as a layer of bright pink cloud, while the cumulus cloud has more of a cellular shaped and smaller pink clouds (area B on the image). Cumulonimbus cloud appears as a large cellular shaped orange cloud. The identification of the different cloud types is very important when forecasting precipitation types associated with the cold fronts. Snow on the ground can also be seen as a red colour using this RGB (area C on the image), as well as super-cooled water in mid level cloud which appears as a smooth green cloud.
The Night Microphysical RGB allows the user to identify the convective cloud associated with the cold front, as well as the low level cloud over night. Identifying the position of the surface cold front overnight can be very difficult as the cloud top temperatures are often similar to the temperatures of on the ground. A user should look for the vortex of the surface front and trace the position of the tail of the front back towards the country. The tail of the front can either be seen as a band of convective cloud, with smaller cellular shaped cells towards the northern tip of the tail, or even as a narrow band of cellular shaped cells, thinning out into low level stratiform cloud. The single channel IR imagery can also be used for this purpose but the Night Microphysical RGB is the preferred option to use, as various cloud types are easily identifiable. Cumulonimbus clouds appear as a deep red color and have the classical cellular shape (Area A on the image). At times, these cloud will also have some yellow pixels in them, indicating low cloud top temperatures. Low level stratus cloud or fog will appear a more blue/grey color (area B on the image), and should be a smooth layer of cloud. The upper level cirrus cloud will be a dark blue/black and can be easily distinguished from the thicker mid level cloud (area C on the image).
|
18 September 2008, 0900UTC, Meteosat Second Generation, Airmass RGB
|
18 September 2008, 1200UTC, Meteosat Second Generation, High Resolution Visible
|

|

|
|
11 August 2012, 1200UTC, Meteosat Second Generation, Day Microphysical RGB
|
19 September 2008, 0300UTC, Meteosat Second Generation, Night Microphysical RGB
|

|

|
This is a loop of the Airmass RGB, valid from the 11th August 2012 0600UTC, until the 12th August 2012 at 0900UTC. At the start of the loop, the cold front is identifiable by the broad band of mid and upper level cloud, passing over the western parts of South Africa. The vortex of the low pressure is seen to the south of the country and a broad area of cold air cumulus cloud is found beneath the upper air low pressure accompanying this cold front. Ahead of the cold front, the eastern parts of South Africa are dry with high level cloud blowing off the eastern escarpment. The cold front progresses over the western and central parts of South Africa and then starts to dissipate as it moves over the eastern and south-eastern coastal belt. The cloud cover and associated precipitation are limited to the western, central and southern parts of South Africa, spreading to the south-east and eastern coastal areas by the end of the loop.

|
Press "Play Button" to see the loop; 11 August 2012 0600UTC - 12 August 2012 0900UTC Meteosat Second Generation: Airmass RGB. |